仕事が完了した
指定
I need a EA that uses price action setup formation ie doji, high close doji, low close doji, doji star, jackhammer
We will only take trades within a set zone of support/resistance that is to work of the daily/weekly/monthly pivots
Code is to be clearly commented in English - we retain full rights to the code and is not for public domain.
The Indy/EA needs to
- watch and identify when and at what price points the dojis, hammers, and shooting stars develop ensuring our entrys are always within the correct zones of price extension before taking trades.
- Identifying what the market condition is—overbought or oversold bullish, bearish, or neutral.
- Identifying the levels that the pivot points lines are at, using the various time frames—monthly, weekly, and daily periods.
- Market condition filter - take trend trades only on/off take counter trends only on/off - Trend is to be defined using TMA slop
- Indy will need to paint signals showing the various market conditions ie ranging, starting to range, trending up, trending down
- When price action setup within S/R zone triggers optional alerts can be setup
- all trades must be commented with trade condition met - IE trend trade Buy doji MA Stoch etc
- option to close trades end of trading day when in profit
Rules
1. Dont take buy signals at resistance levels and vise versa for support levels)
Trade filters
1. optional on/off for stochhastic confirmation Refer to attached stoch filter example 1 picture attached
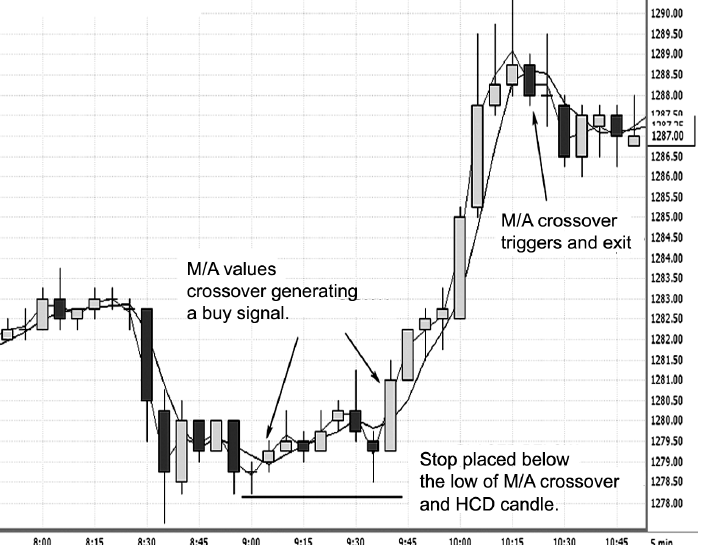
2. optional on/off MA cross Price close above or belove MA - Refer to attached MA filter example picture attached
3. option on/off for each candle formation type/trigger
4. Market condition filter - take trend trades only on/off take counter trends only on/off ranging markets on/off filter - Trend is to be defined using TMA slop
Ranging Market ( defined by the TMA SLOPE as between > -0.4 to < 0.4 means the market is ranging.
Strong Trending Market ( defined by the TMA SLOPE as between >= 0.8 Or <= -0.8)
Sells are losing steam Indication its time to sell off current trades as Trend is weakening <= -0.4 the market is falling but not necessarily strongly.
Buys are loosing steam - indication its time to take profit on buy trades as trend has weakened >= 0.4: the market is rising but not necessarily strongly.
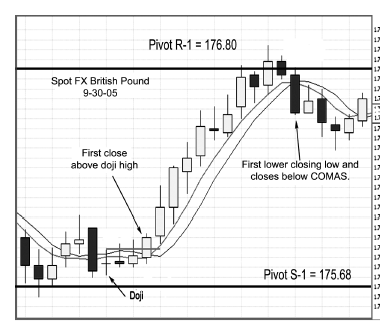
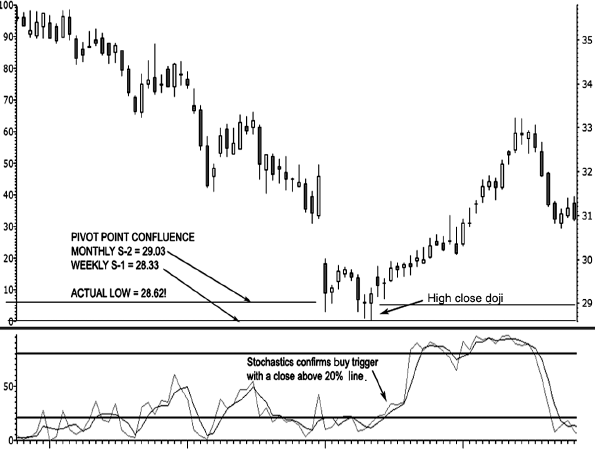
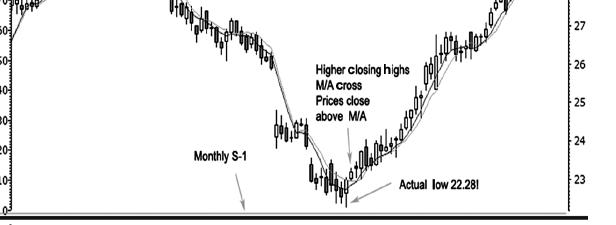
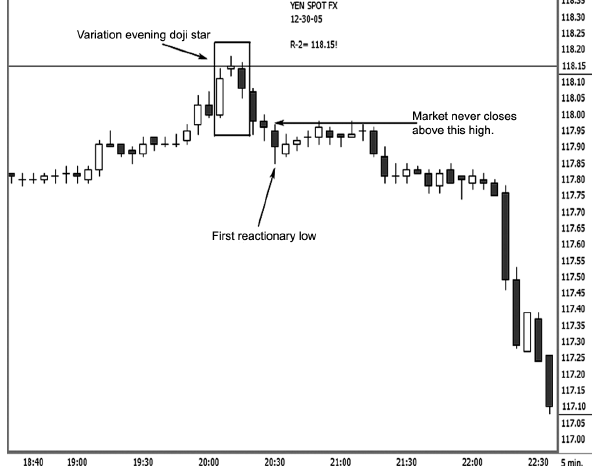
Characteristics - High Close Doji (support level trade)
When the market is in an extended trend to the downside and the market
condition is oversold, a doji appears, indicating indecision and weakness of
sellers to maintain the downward trend. In addition, prices are near a projected
pivot point support target level
When a doji appears, it should:
• Buy on the close or on the next open after a new closing high is made
from the previous doji candle high, especially when the market is
against a key pivot point support target number.
• Place stops below the lowest low point of the doji. Stops should be initially
placed as a stop-close-only, meaning we do not exit the trade unless
the market closes back below the doji’s low.
• Sell or exit the trade on the close or on the next open of a candle that
makes a lower closing low near a key pivot point resistance number.
Refer to picture example 1 to review the above concept
Vise versa for a extended trade on the upside when the market is over bought
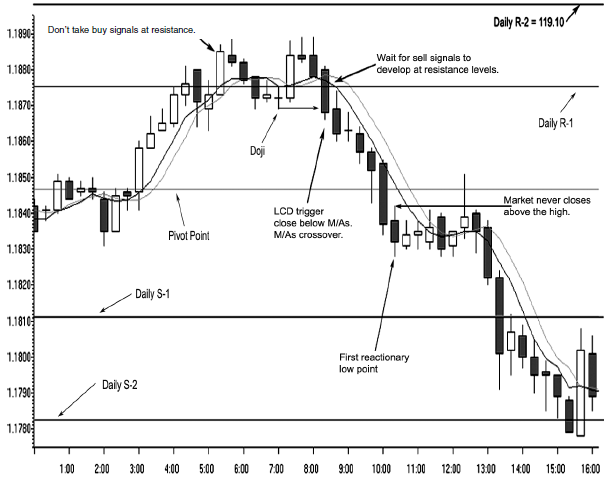
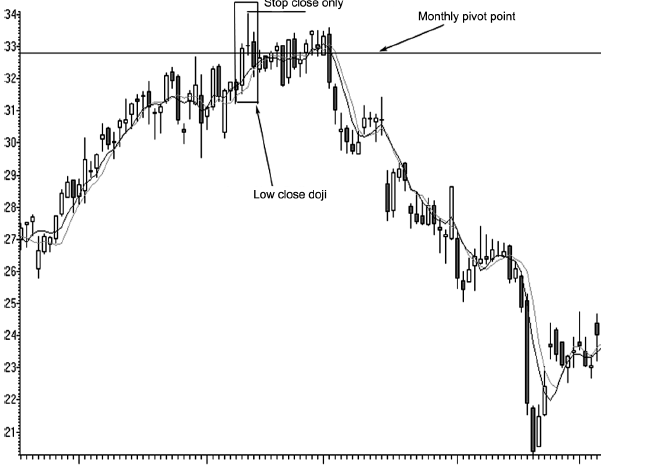
Characteristics Low close Doji (resistance level trade)
When the market is in an extended trend to the upside and the market is
overbought, a doji appears, indicating indecision and weakness of buyers to
maintain the upward trend. Pay particular attention if the candle preceding
the doji is a tall white candle, which would be a two-candle pattern called
a bearish harami doji cross. Watch for increased volume, as this also confirms
a blow-off-top formation.
Trading Rules
When a doji appears, you should:
• Sell on the close or the next time period’s open once a new closing low
is made from the previous time period’s doji’s low, especially when the
market is against a key pivot point resistance target number.
• Place stops above the highest high point of the initial doji candle. Stops
should be initially placed as a stop-close-only, meaning you do not exit
the trade unless the market closes back above the doji’s high.
• Buy or exit on the open of the first candle after the previous candle
makes a higher closing high than the previous candle.
Refer to picture example 2 to review the above concept
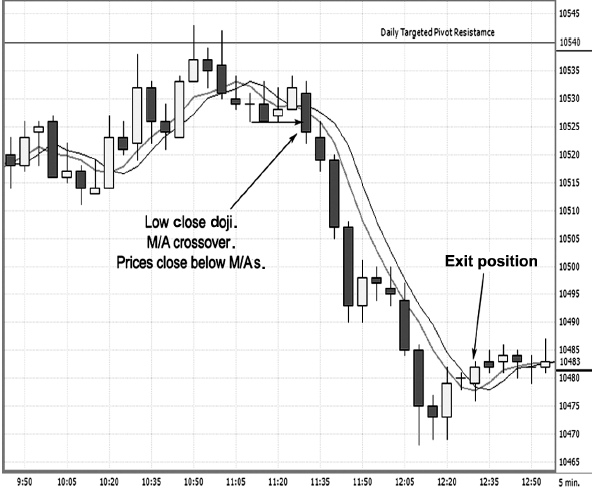
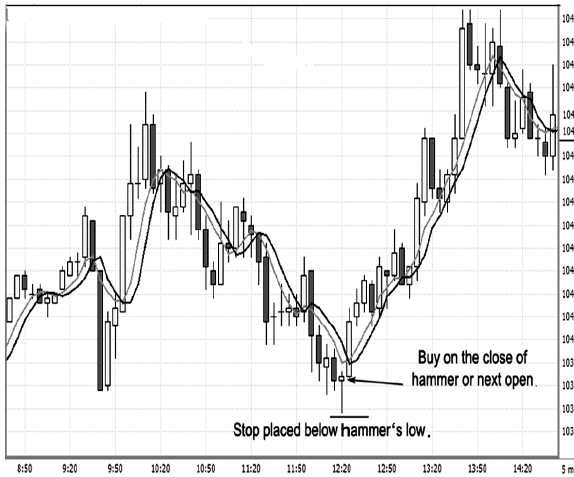
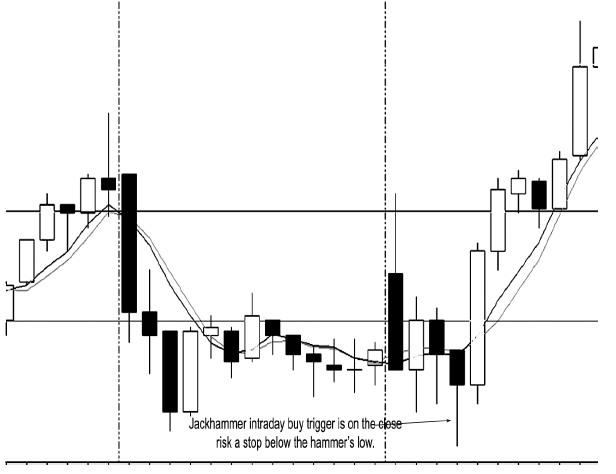
Jackhammer signal
The hammer formed is a secondary low with the close at or near the
primary low’s low.
• It does not matter whether the real body is formed with a higher close
than open or positive assigned value; however, it is generally a more
solid signal when the close is above the open.
• This action generally completes a bullish convergence in the stochastics
or MACD oscillator.
• Buy on the close of the hammer or the next time periods’ open; initial
risk is a regular stop below the hammer’s low.
• Give additional importance if this pattern develops near pivot point
support targets, especially if there is a confluence of pivot support targets
from different time frames.
• Stock traders should watch for an increase or a volume spike, which indicates
an exhaustion bottom is confirmed.
Figure 8.31 shows a 5-minute chart on the CBOT mini-Dow. Notice that
the “midsession” is defined by the middle of the day. The first intraday low
has been established, nearly three hours pass by, and the market makes a
nosedive as prices hit a new low for the trading session. In this example, the
hammer closes back within the primary low’s range. The trigger to go long
is on the hammer’s close or on the open once the hammer formation is con-
Refer to picture jackhammer signal example to review the above concept
Optional trade TP exit methods.
1. close trades on reversal ie if currently in sell position - close trade close on MA cross over i
2. When market changes to ranging close 50% of position and leave remaining position with trailing stop of 50 pips
3. Set stop to 50% of 10 day daily average range pips
4. At 50 pips profit close 50% postion and trail at X amount of pips
Price Zone Rules which qualify the above trades.
-optional settings
The above trades can only be taken From the support/resistance level 2 zones and above for Daily/weekly/monthly zones
we must retain the option to set daily and or weekly and or monthly zones to false and retain the option to force only zone X and above.
Pivot point CalculationsTo determine current support/resistance levels, the first step is to find the pivot point number:
- PP = (H + L + C)/3
- The first resistance level(R1)=(PPx2)-L
- The second resistance level (R2)=PP+H-L
- The fist support level (s1)=(PPx2)-H
- The second support level (S2)=PP-H+L
Money Management
trades are to work off free margin/1000
Trade optins
max trades
at x amount of loss stop trading for the day
at x amount of gain start trading for the day
trade only certain times
trade only certain pairs