仕事が完了した
指定
I am attaching attaching a few pics. Read what i have written down and then see the pictures. Concentrate on the circles that i have made please.
Please read carefully:
I have attached a few pics and i have circled a few things.
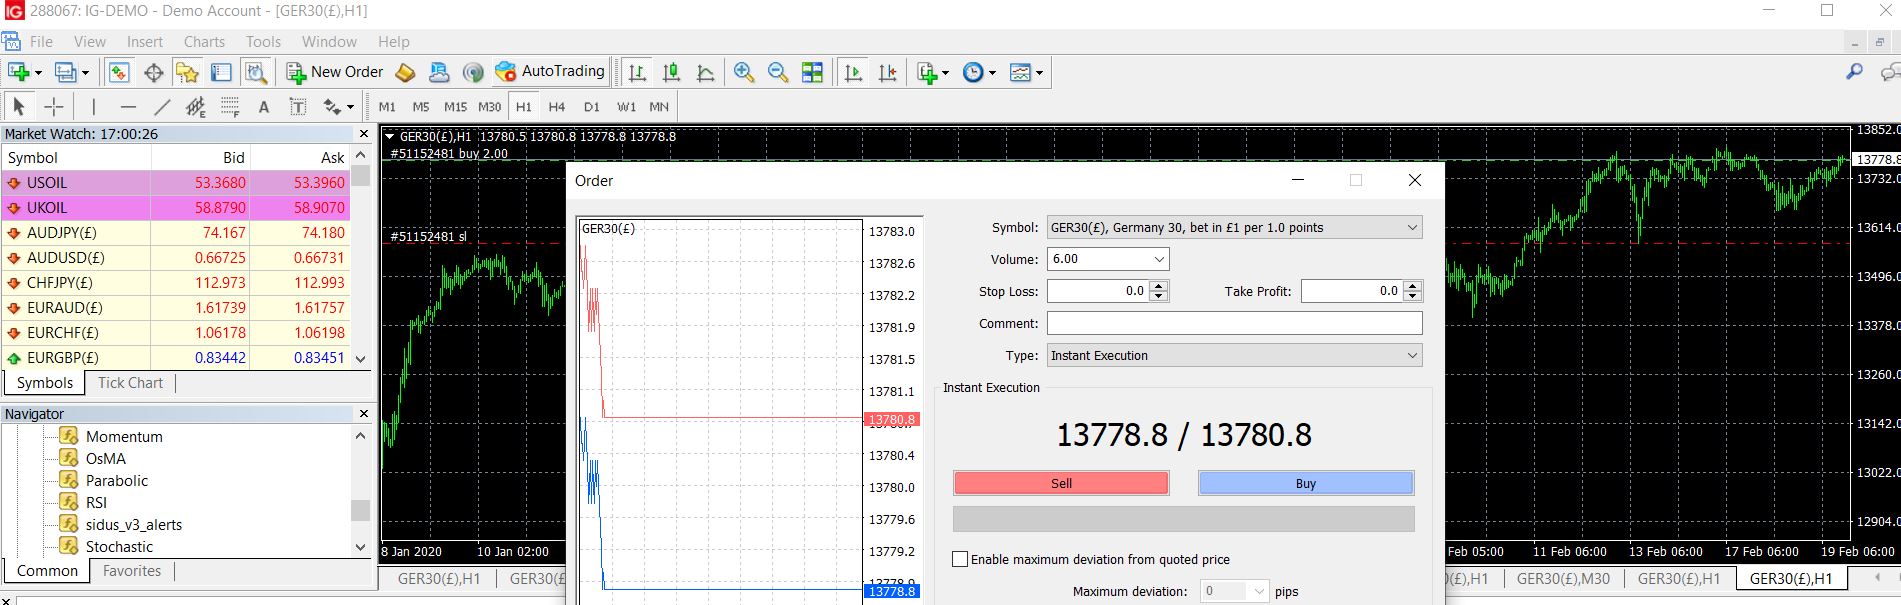
This ea is only for trading germany 30(dax 30) index on the ig markets uk mt4 platform.
Take profit, stop loss will be measured in points.
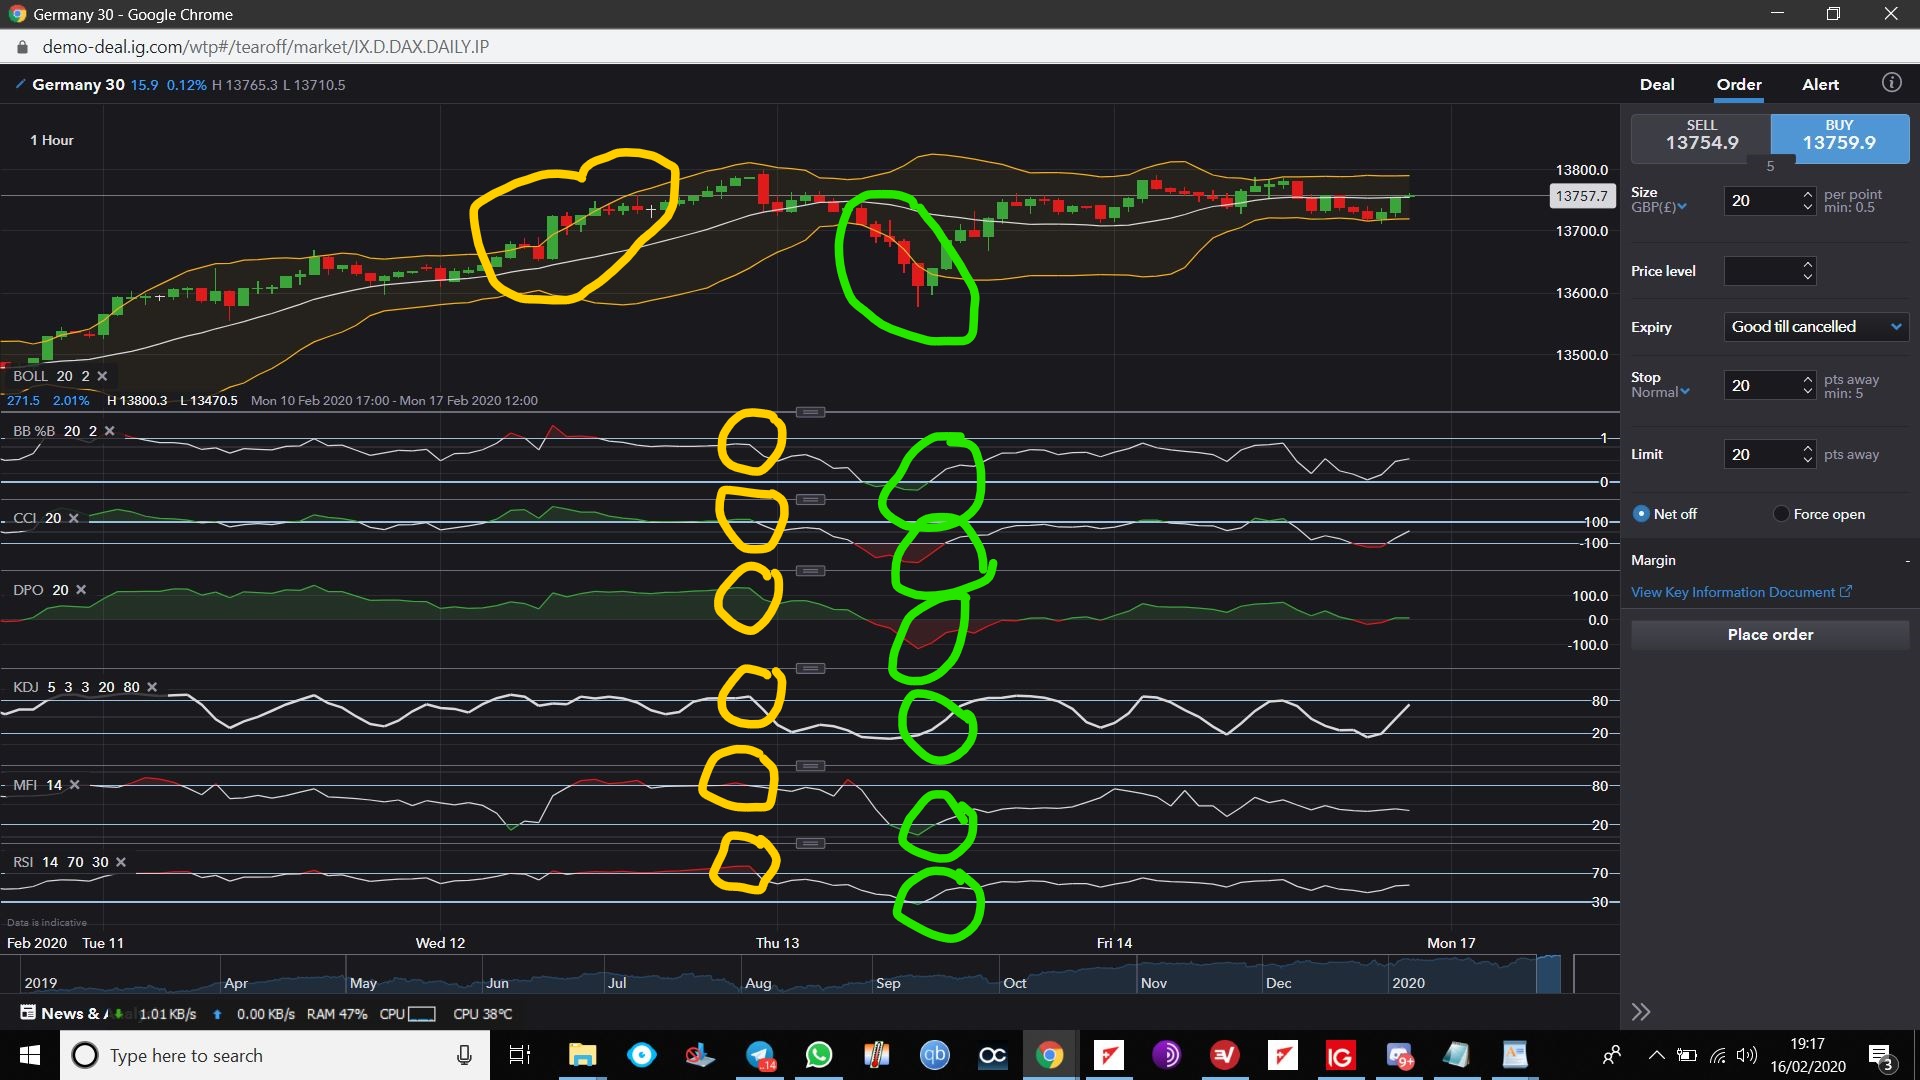
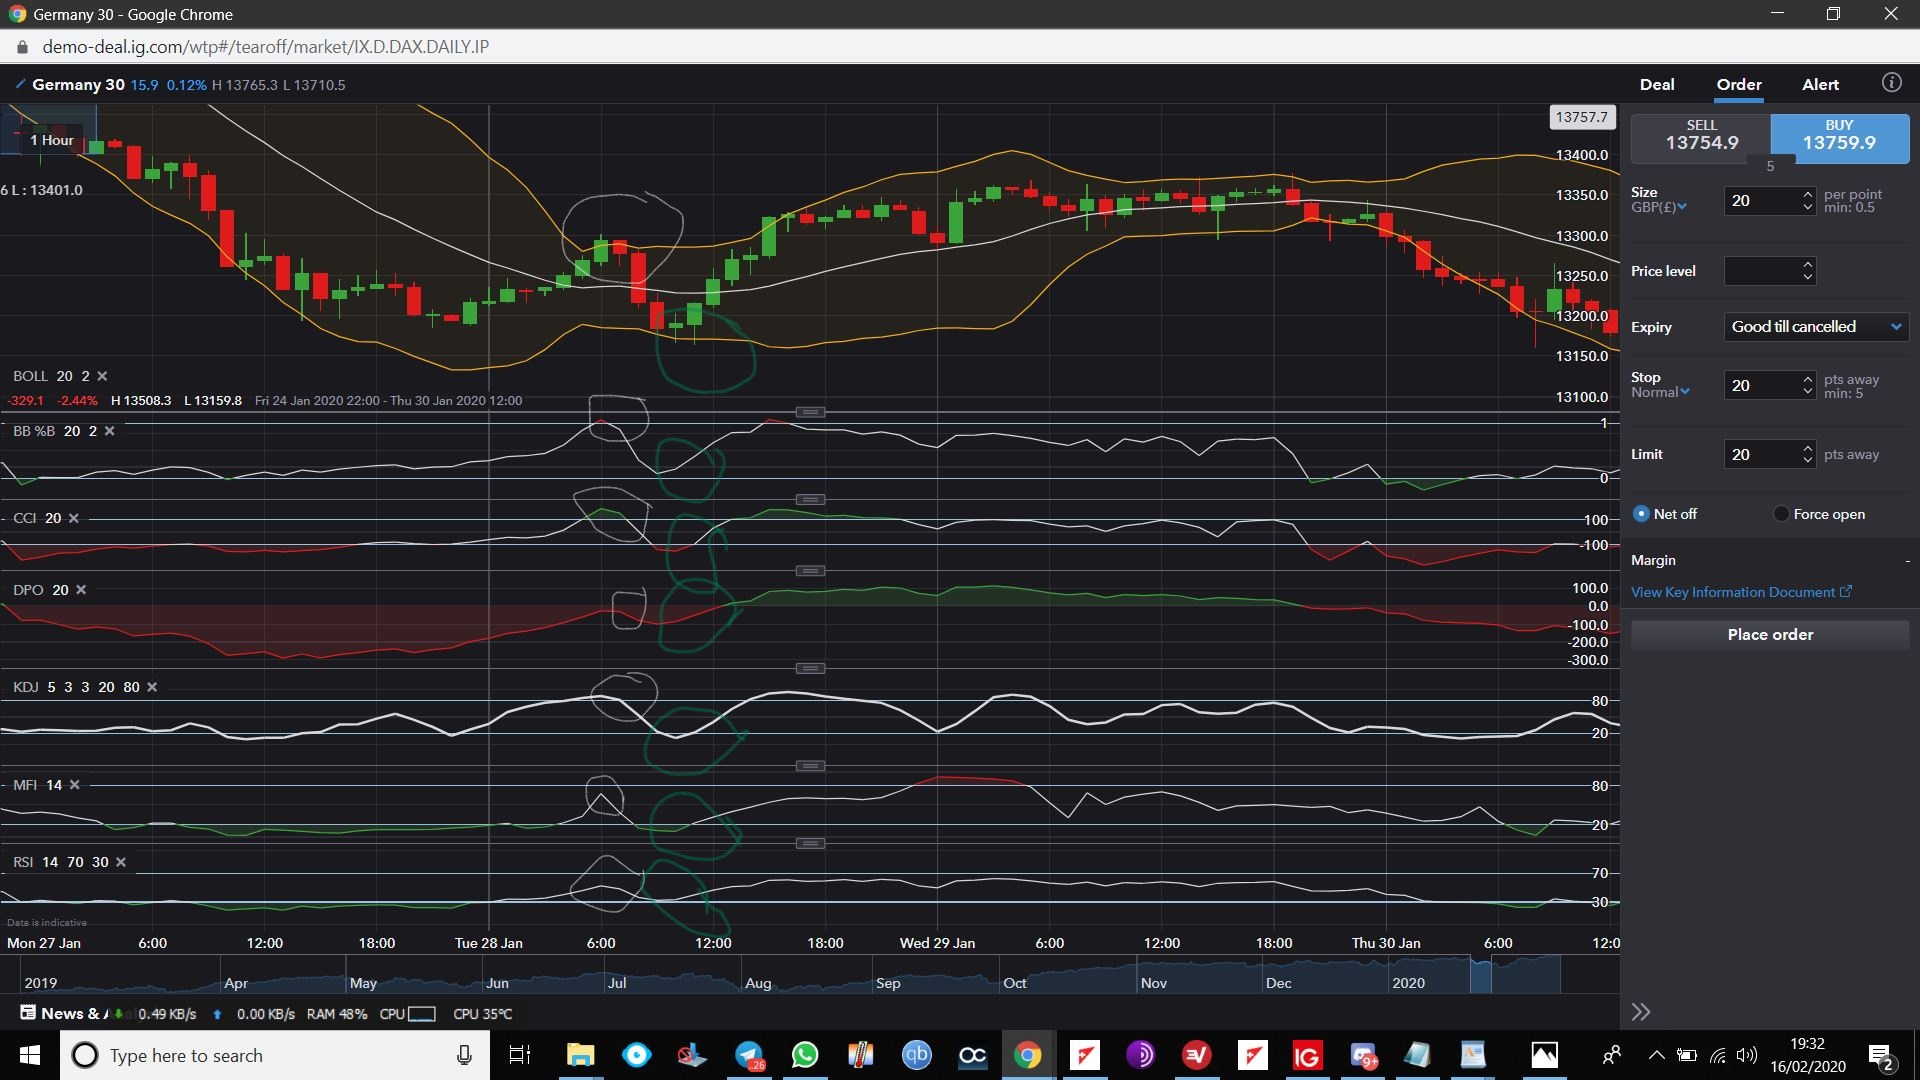
If you see the picture, on the candle sticks i have 3 bollinger band lines. Once the candle stick crosses the upper line of the Bollinger band the ea will then start(WONT PLACE A TRADE) to see if a sell is possible. On the picture you will also see many indicators with circles, highlighted on them. Once ALL the indicators have a downward direction, ONLY THEN WOULD A SELL(SHORT) trade be made. There will be an option whether to wait till bar closure or to immediately place the trade. Take profit will be from tp1 to tp10. If for eg
dax 30 price= 13500
tp1=10 points (13510)
tp2=20 points (13520)
tp3=30 points (13530)
tp4=60 points (13560)
The ea will not close the trade if the trade goes from tp1 to tp2 and so on. If however after tp2 the trade is unable to go to tp3 and goes back to tp2 ONLY THEN WOULD A TRADE BE CLOSED.
Just for clarification one point would mean this, dax 30 price 13500, then a one point increase would mean 13501.
For the buy entry, the candle stick will cross the lower line of the bollinger band, then the ea will start getting ready that a buy order is about to happen( AGAIN IT WONT MAKE THE BUY ORDER). It will wait for all the indicators to point in an upward direction. ONCE ALL THE INDICATORS POINT IN AN UPWARD DIRECTION, only then it will place a trade.
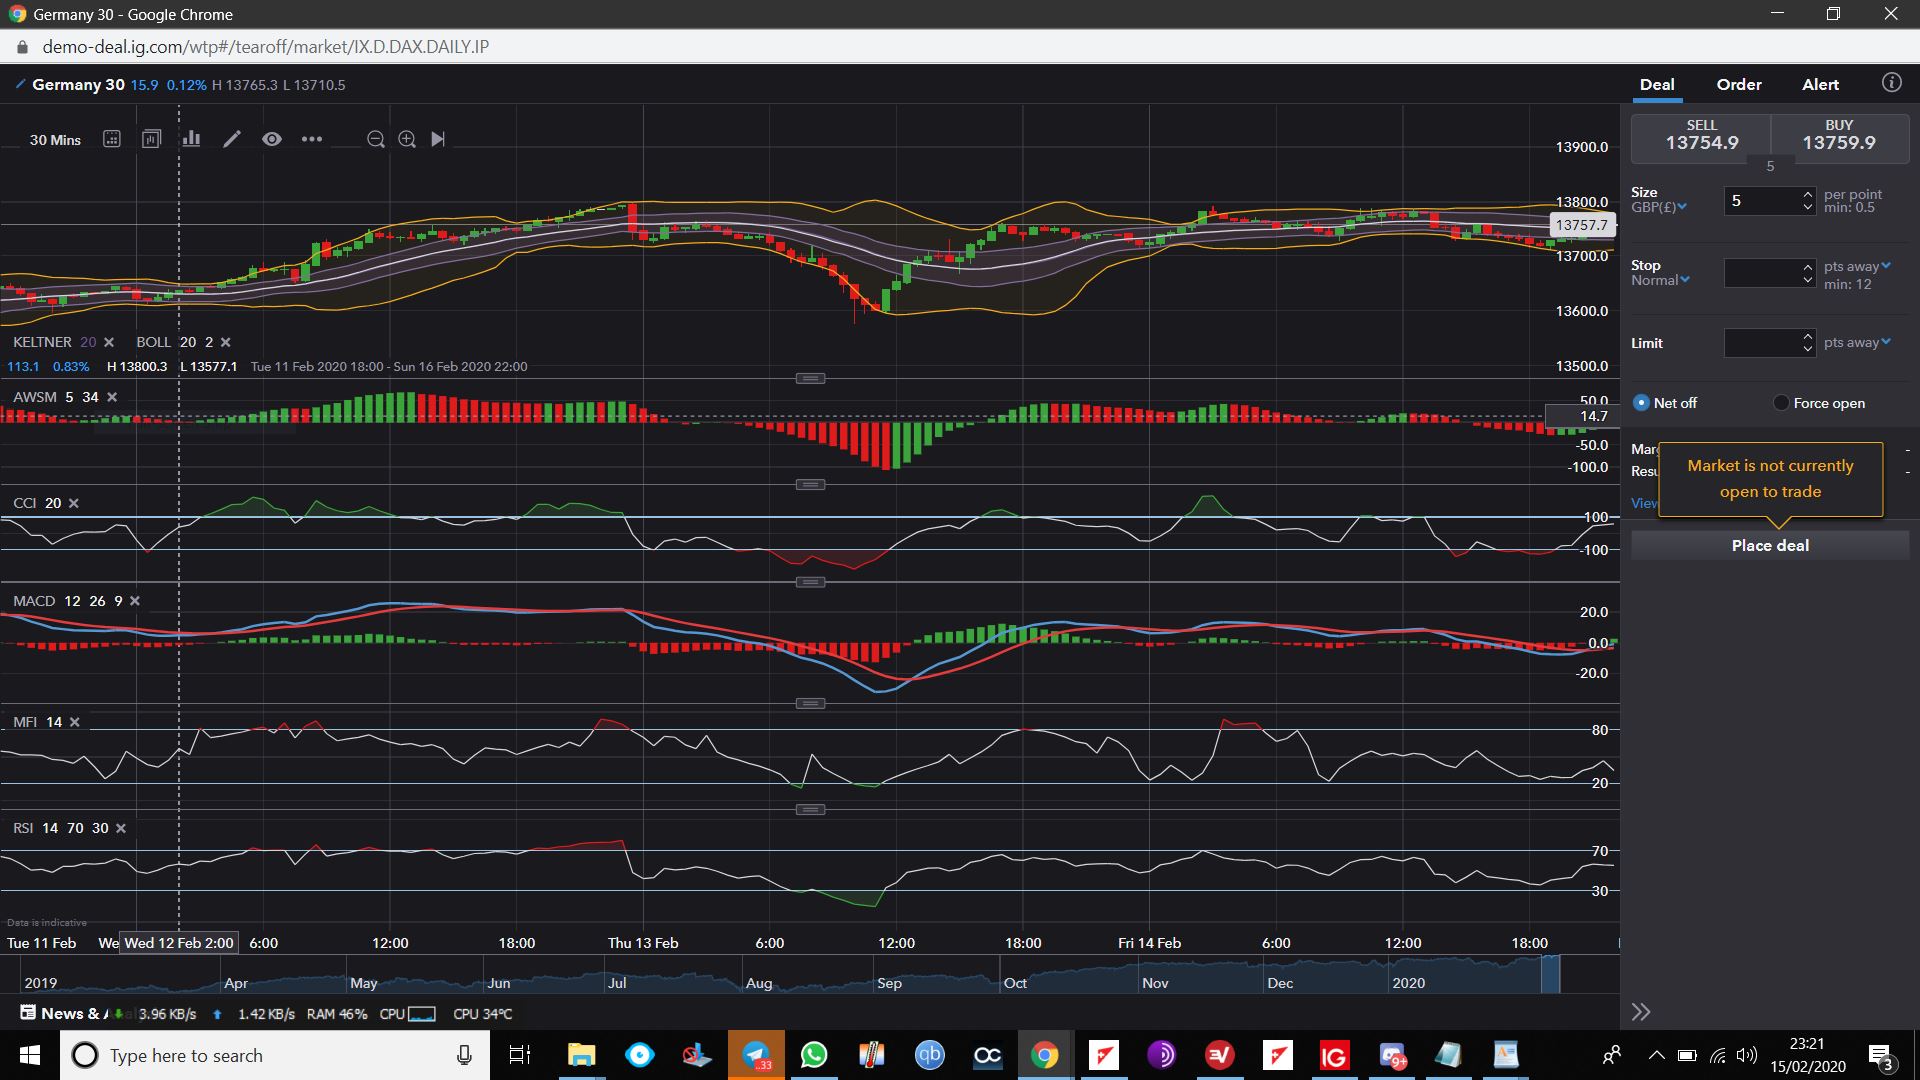
The above needs to demonstrated by the ea in the strategy testing mode. Also once a trade is made, i want the ea to point on the candle exactly where it placed a trade with a horizontal line. Also on the same chart on which i attach the ea, on the bottom of the chart i also want all the indicators to be there just to check if its working the way i want it to work. That is all the indicators if point in an upward direction or a downward direction for placement of a trade.
vol size= 1 pound per point, 5 pound per point, x pounds per point
stop loss= points
place trade= immediately or at bar closure
take profit 1 till take profit 10= in points
tp1, tp2,tp3....tp10
bb(bollinger band)(period, standard deviation)=
bb%b(bollinger %b)(period, standard deviation)=
cci(commodity channel index)(period)=
dpo(detrended price oscillator)(period)=
kdj(kdj indicator)(only the %k line is used hence only the %k period)=
mfi(money flow index)(mfi period)=
rsi(relative strength index)(rsi period)=
for the above indicators there will be true/false along with the various options for indicators, eg like for rsi 70, 40
If any other questions do let me know
p.s: Also once the candle crosses the upper line of the Bb, it will be on the lookout for a sell trade and it will remain on the potential sell mode and wait for all the indicators to point in a downward direction. If however if all the indicators dont point in a downward direction, and the candle stick then crosses the lower line, it will then do a potential buy trade. IT WILL THEN LOOK FOR ALL THE INDICATORS to point in an upward direction. If i have selected immediate trade instead of waiting till bar closure, then again it will place the trade immediately instead of waiting till bar closure.