|
no
esperienza
|
9
prodotti
|
0
versioni demo
|
|
7
lavori
|
0
segnali
|
0
iscritti
|
Dear ladies and gentlemen, members of the stock market, Greetings.
My name is Sergey Krasny, and I have been involved in trading and programming for more than ten years.
My path in studying this field started in 2011, and I realized my first custom project in 2013.
Since then, I have completed hundreds of projects for clients from all over the world.
My experience in writing trading software is varied and successful.
I am familiar with different aspects of trading such as Fibonacci, Gan, Elliott methods, as well as different types of robots, strategies and indicators.
Have had projects with all the built-in indicators in mt4 and mt5 as well as hundreds of other custom indicators.
My skills range from developing panels on charts to writing complex algorithms to manage trades.
I have created both fully automated robots and trading assistants, for trading in semi-automatic mode for partial manual control.
In addition, I specialize in developing custom strategies and computational algorithms that optimize the trader's performance.
In particularly complex projects, I had to apply innovative solutions that had no analogues on the market.
For example, in one of the projects for self-training of the robot, I developed a methodology for analyzing chart history and searching for patterns on the chart using the zigzag indicator.
This technique allowed to identify standard chart patterns, such as "butterfly" or "two tops", and based on their frequency of occurrence the robot made a decision whether to open a trade or not.
This project was realized before the advent of modern neural networks.
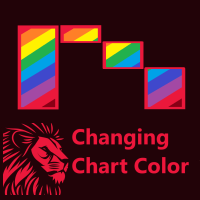
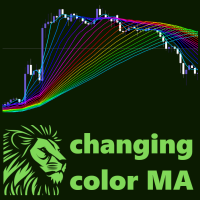
A in another project For a more pleasant look for clients, an algorithm was developed to smoothly change the color of the indicator line, candlesticks on the chart and buttons of the panels according to the rainbow principle, which created a pleasant and professional look of the product. I have not seen these functions in any product in the MQL Market.
These are only a small part of the solutions I have adopted, which helped me to realize my projects professionally.
My skills and experience will help you simplify your trading process, making it more efficient and profitable.
I am ready to help you automate your trading process and free your time for more important tasks.
Trust my experience and I will help you achieve your goals in the market.
Best wishes,
Sergey Krasny
My name is Sergey Krasny, and I have been involved in trading and programming for more than ten years.
My path in studying this field started in 2011, and I realized my first custom project in 2013.
Since then, I have completed hundreds of projects for clients from all over the world.
My experience in writing trading software is varied and successful.
I am familiar with different aspects of trading such as Fibonacci, Gan, Elliott methods, as well as different types of robots, strategies and indicators.
Have had projects with all the built-in indicators in mt4 and mt5 as well as hundreds of other custom indicators.
My skills range from developing panels on charts to writing complex algorithms to manage trades.
I have created both fully automated robots and trading assistants, for trading in semi-automatic mode for partial manual control.
In addition, I specialize in developing custom strategies and computational algorithms that optimize the trader's performance.
In particularly complex projects, I had to apply innovative solutions that had no analogues on the market.
For example, in one of the projects for self-training of the robot, I developed a methodology for analyzing chart history and searching for patterns on the chart using the zigzag indicator.
This technique allowed to identify standard chart patterns, such as "butterfly" or "two tops", and based on their frequency of occurrence the robot made a decision whether to open a trade or not.
This project was realized before the advent of modern neural networks.
A in another project For a more pleasant look for clients, an algorithm was developed to smoothly change the color of the indicator line, candlesticks on the chart and buttons of the panels according to the rainbow principle, which created a pleasant and professional look of the product. I have not seen these functions in any product in the MQL Market.
These are only a small part of the solutions I have adopted, which helped me to realize my projects professionally.
My skills and experience will help you simplify your trading process, making it more efficient and profitable.
I am ready to help you automate your trading process and free your time for more important tasks.
Trust my experience and I will help you achieve your goals in the market.
Best wishes,
Sergey Krasny