• Panoramica
  • Recensioni
  • Commenti
  • Novità

UR Vortex MT5

UR Vortex MT5
The Probabilistic UR Vortex Formula: An Accurate System for Predictive Market Analysis using Volatility and Standard Deviation Calculations.

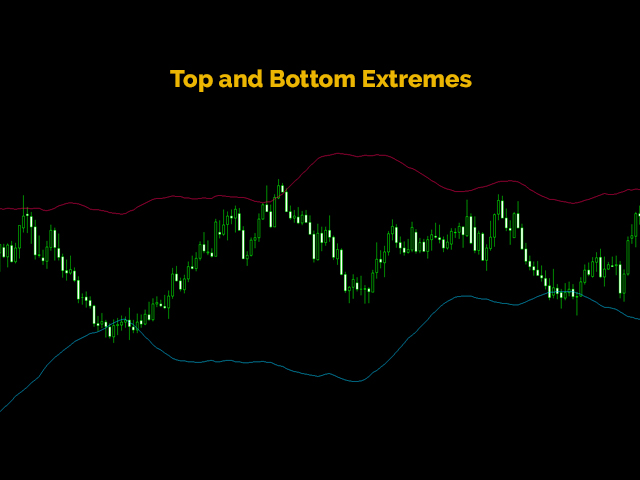
The UR Vortex MT5 indicator is a technical analysis tool that uses volatility and standard deviation calculations to predict potential tops and bottoms in a market. It measures the strength of a trend by calculating the distance between the current price and a moving average, and then standardizing this distance by dividing it by the average true range (ATR) of the market. The result is a normalized value that represents the volatility of the market.

Advantages of using UR Vortex MT5 :

  1. Visually easy to understand and use
  2. Highly Accurate <<<
  3. No settings
  4. Adjusted to every kind of asset
  5. Perfect addition to any strategy <<<

There is a special telegram chat on which you can stay up-to-date with the tools updates and also send request if you feel there is something missing!


Why UR 
Vortex MT5 
?

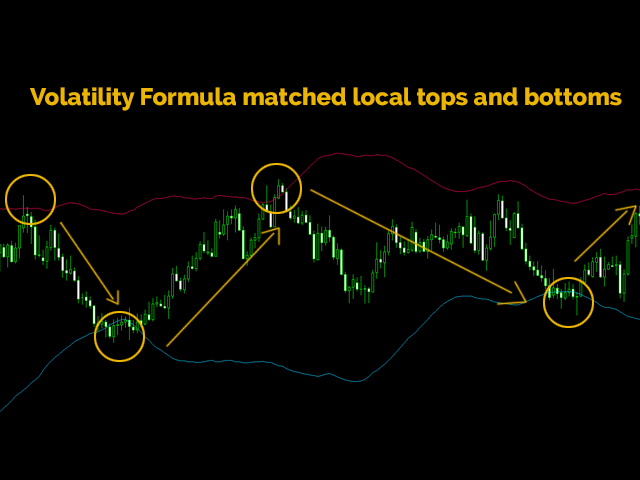
The UR Vortex Formula has been developed based on years of experience and price action observation. It is a proven to work tool used by many professional traders. This formula, combining the power of volatility and standard deviation calculations with advanced probability analysis, provides traders with an accurate and reliable tool for predicting market tops and bottoms. Say goodbye to guesswork and missed opportunities, and take control of your financial future with the UR Vortex system.

How to use UR Vortex MT5 ?

  • Track the price action until it gets exhausted (crosses any line). At first show of weakness - a potential reversal may surge starting a new trend.
  • Highly suggested using multi-timeframe setups for better accuracy of entry


DISPLAY

  • Two sided Lines: Show levels of volatility exhaustion - predicted with the probabilistic formula based on Volatility and Price Action

WWW -> https://urtradingcoder.carrd.co

Twitter -> https://twitter.com/URTradingCoder

Facebook -> https://www.facebook.com/profile.php?id=61559349091899

YouTube -> https://www.youtube.com/channel/UCihthoKQYrhj91jkUO8B1kg

MQL Store -> https://www.mql5.com/en/users/youreacoder/seller


Prodotti consigliati
Renko Plus
Eadvisors Software Inc.
With Renko Plus you can use the features in the Indicator functionality, just add it to the Metatrader5 chart.             The Renko chart is a type of chart, developed by the Japanese, that is constructed using price movement rather than standardized prices and time intervals like most charts. It is believed to be named after the Japanese word for bricks, "renga", as the graphic looks like a series of bricks.             A new brick is created when the price moves a specified p
Introduction to Smart Renko The main characteristics of Renko Charting concern price movement. To give you some idea on its working principle, Renko chart is constructed by placing a brick over or below when the price make the movement beyond a predefined range, called brick height. Therefore, naturally one can see clear price movement with less noise than other charting type. Renko charting can provide much clearer trend direction and it helps to identify important support and resistance level
Gino Renko
Stephane, Andr Valette
1 (1)
Another renko-based indicator. It returns different usable values ​​for an EA, and is directly displayed on the main chart. Its setting is very simple: The size of the renko The number of bars taken into account The falling color The color on the rise Returned values: Buffer 0 : Value of the middle Buffer 1 : Value of the Top Buffer 2 : Value of the Bottom Buffer 3 : Direction of renko (0.0 for top ; 1.0 for bottom) Buffer 4 : Ratio of the renko, for example, if it is twice, 3 times, ro more of
This is an advanced indicator used with success rate.Unlock the secrets of trading Boom and Crash spikes with our powerful MT5 indicator! This spike detection tool provides accurate buy and sell signals, trade alerts, and High success rate entries. Perfect for scalping, day trading, and swing trading. Get the best Boom and Crash strategy with our Deriv Boom and Crash spike indicator. Indicator does not redraw or repaint. Recommendation · Use a Virtual Private Server (VPS) for 24/7 alerts on
Live Renko
Jefferson Judge Metha
Perfectly designed for traders who value clarity, precision, and ease of use, this cutting-edge Renko chart indicator provides everything you need to enhance your trading strategy. Unlike traditional generators that create offline charts, this indicator delivers real-time Renko charts directly on your live trading platform. The Live Renko Indicator also works seamlessly on Synthetic Indices such as Volatility 75, Step Index, Boom and Crash.
Market Imbalance MT5
Scott Edward Merritt
What Is Market Imbalance? Market Imbalance, also known as "IPA" or Improper Price Action, is when price moves so quick in one direction with no orders on the other side of the market to mitigate the price movement. We all know Big Banks, or "Smart Money", can move the market by placing huge orders which in turn can move price significantly. They can do this because Big Banks are the  top 10 Forex traders in the world . But unfortunately, the Big Banks cannot leave these orders in drawdown and mu
All about time and price by ICT. This indicator provides a comprehensive view of ICT killzones, Silver Bullet times, and ICT Macros, enhancing your trading experience.  In those time windows price either seeks liquidity or imbalances and you often find the most energetic price moves and turning points. Features: Automatic Adaptation: The ICT killzones intelligently adapt to the specific chart you are using. For Forex charts, it follows the ICT Forex times: In EST timezone: Session: Asia: 20h00-0
Your Pointer is no ordinary Forex channel. This corridor is built on the basis of the analysis of several candles, starting from the last one, as a result of which the extremes of the studied interval are determined. They are the ones who create the channel lines. Like all channels, it has a middle line as well as a high and low line. This channel is worth watching for its unusual behavior. The use of the Your Pointer indicator allows the trader to react in time to the price going beyond the bo
VI Vortex
Fernando Lahude Ritter
4.67 (3)
Description : Enhance Your Trading Strategy with the Advanced Vortex Indicator for MT5! Discover the power of the Vortex Indicator (VI), a robust technical analysis tool now available for MetaTrader 5. This custom-built indicator is designed to help traders identify trends and reversals, offering a critical edge in the dynamic Forex market. Key Features: Dynamic Trend Identification : With the VI's unique calculations of VI+ (positive) and VI- (negative) lines, you can easily spot trend strength
FREE
Based on the trading model/strategy/system of gold double-position hedging and arbitrage launched by Goodtrade Brokers, problems encountered in daily operations: 1. Account B immediately places an order immediately following account A. 2: After account A places an order, account B will automatically copy the stop loss and take profit. 3: Account A closes the position of Account B and closes the position at the same time. 4: When account B closes the position, account A also closes the position.
Advanced 4xZeovo MT5 Indicator (MetaTrader 5)   Product Description  4xZeovo is a powerful trading indicator system monitoring 24/7 financial markets. Metatrader5 tool designed to find the best buying/selling opportunities and notifies the user.    Making life easy for traders in helping with the two most difficult decisions with the use of advanced innovate trading indicators aiming to encourage users to hold the winning positions and take profit at the best times.    Equipped with a unique tra
This indicator uses a mathematical calculation algorithm . This algorithm calculates the remainder between the updated model and the actual values and produces the possible progress of the graph on the graph. It is not a super prophet in trading, but it is very good for the trader when entering the market and to analyze it before entering. Applicable for all currencies. Данный индикатор использует алгоритм математических вычислений . Данный алгоритм вычисляет остаток между обновленной моделью и
Smooth Patterns
Roman Vashchilin
Trading patterns on Forex is considered to be the highest level of trading, since it usually requires years of mastering various patterns (shapes and candle combinations) and the ways they affect the price. Patterns are different combinations of Japanese candles on a chart, shapes of classical technical analysis, as well as any regularities of the market behavior repeating many times under the same conditions. After the patterns appear on a chart, the price starts behaving in a certain way allow
Auto Channel Trader
Ross Adam Langlands Nelson
The Auto Channel Trader creates a channel by plotting a line along the high points and low points of the chart, the EA then makes long trades near the bottom of the channel and short trades near the top of the channel. The channel is created by finding high points for the top line and low points for the bottom line, these points are shown with arrows. A line of best fit is then plotted through these points and extended until the end of the chart.  The length of the channel is determined by the M
Renko Chart
Marcin Konieczny
3.63 (8)
This indicator allows to display Renko charts in the indicator window. Renko charts show only price movements that are bigger than the specified box size. It helps to eliminate noise and allows to focus on main trends. Time is not a factor here. Only price movements are taken into account. That's why Renko chart is not synchronized with the main chart it is attached to. Indicator works in two modes: CLOSE - only close prices are taken into account while building the chart HIGH_LOW - only high/
FREE
Bands are a form of technical analysis that traders use to plot trend lines that are two standard deviations away from the simple moving average price of a security. The goal is to help a trader know when to enter or exit a position by identifying when an asset has been overbought or oversold. This indicator will show upper and lover bands. You can change input parameters nPeriod and  nMethod to calculate those bands for each timeframe. Aqua clouds represent up or down trends.
Trend Direction ADX indicator Trend Direction ADX is part of a serie of indicators used to characterize market conditions. Almost any strategy only work under certain market conditions. Therefore it is important to be able to characterize market conditions at any time: trend direction, trend strength, volatility, etc.. Trend Direction ADX is an indicator to be used to characterize trend direction: trending up trending down ranging Trend Direction ADX is based on ADX standard indicator.
PipFinite Strength Meter MT5
Karlo Wilson Vendiola
5 (1)
How To Determine If The Market is Strong Or Weak? Strength Meter uses an Adaptive Algorithm That Detect Price Action Strength In 4 Important Levels! This powerful filter gives you the ability to determine setups with the best probability. Features Universal compatibility to different trading systems Advance analysis categorized in 4 levels Level 1 (Weak) - Indicates us to WAIT. This will help avoid false moves Weak Bullish - Early signs bullish pressure Weak Bearish - Early signs bearish pre
KT Renko Live Charts MT5
KEENBASE SOFTWARE SOLUTIONS
KT Renko Live Chart utility creates the Renko charts on MT5 that can be further used for speculation or live trading. The Renko chart created by this utility supports most of the custom indicators and automated Expert Advisors. Fully compatible with our Renko Patterns indicator and Renko Patterns EA . Features A simple and straightforward Renko utility that provides the Renko chart on MT5 without any complicated settings. It supports most of the custom indicators and Expert Advisors for 100%
KT ROC Divergence MT5
KEENBASE SOFTWARE SOLUTIONS
KT ROC divergence shows the regular and hidden divergences build between the price and Rate of change oscillator. Rate of change (ROC) is a pure momentum oscillator that calculates the change of percentage in price from one period to another. It compares the current price with the price "n" periods ago. ROC = [(Close - Close n periods ago) / (Close n periods ago)] * 100 There is an interesting phenomenon associated with ROC oscillator. In ROC territory there is no upward limit, but there is a do
Gekko MACD Plus
Rodrigo Galeote
3 (3)
Type: Oscillator This is Gekko's Cutomized Moving Average Convergence/Divergence (MACD), a customized version of the famous MACD indicator. Use the regular MACD and take advantage of several entry signals calculations and different ways of being alerted whenever there is potential entry point. Inputs Fast MA Period: Period for the MACD's Fast Moving Average (default 12); Slow MA Period: Period for the MACD's Slow Moving Average (default 26); Signal Average Offset Period: Period for the Signal
The indicator is designed to work on any trading platform. The program is based on proprietary algorithms and W.D.Ganna's mathematics, allowing you to calculate target levels of price movement based on three points with the highest degree of certainty. It is a great tool for stock trading. The indicator has three buttons: NEW - call up a triangle for calculation. DEL - delete the selected triangle. DELS - completely remove all constructions. The probability of achieving the goals is more than 80
This indicator shows a candle combination based on dodge, dodge and pin bar. The logic of the pattern is to stand on the side of strength, after uncertainty. The indicator is universal and is useful for trading binary options, forex, ETFs, cryptocurrency, stocks. The indicator supports timeframes from M5 to MN, including non-standard TF presented in MT5. (М5,М6,М10,M12, M15, M20, M30, H1, H2, H3, H4, H6, H8, H12, D1, W1, MN). The ability to enable and disable TF is implemented. Sound alerts and
Golden Spikes Detector
Batsirayi L Marango
2.67 (3)
Golden Spikes Detector This indicator is based on an advanced strategy primarily for trading spikes on Boom and Crash Indices. Complex algorithms were implemented to detect high probability entries only. It alerts on potential Buy and Sell entries. To trade spikes on the Deriv or Binary broker, only take Buy Boom and Sell Cash alerts. It was optimised to be loaded on 5-minute timeframe although multiple timeframe analysis is done in the background. Features ·             Desktop pop up and sound
PZ Cup and Handle MT5
PZ TRADING SLU
4 (1)
Increase trade accuracy with the time-tested cup and handle patterns The Cup and Handle pattern is a technical price formation that resembles a cup and handle, where the cup is in the shape of a "U" and the handle has a slight downward drift. The right-hand side of the pattern -the handle- is smaller than the left-hand side -cup-, and retraces no more than 50% from the top. It can be both a continuation and a reversal pattern.  [ Installation Guide | Update Guide | Troubleshooting | FAQ | All P
Double HMA MTF for MT5
Pavel Zamoshnikov
3.67 (3)
This is an advanced multi-timeframe version of the popular Hull Moving Average (HMA) Features Two lines of the Hull indicator of different timeframes on the same chart. The HMA line of the higher timeframe defines the trend, and the HMA line of the current timeframe defines the short-term price movements. A graphical panel with HMA indicator data from all timeframes at the same time . If the HMA switched its direction on any timeframe, the panel displays a question or exclamation mark with a tex
Vortex MT5
KEENBASE SOFTWARE SOLUTIONS
The Vortex Indicator was first presented by Douglas Siepman and Etienne Botes in January 2010 edition of Technical Analysis of Stocks & Commodities. Despite its based on a complex implosion phenomenon, the vortex is quite simple to interpret. A bullish signal is generated when +VI line cross above the -VI line and vice versa. The indicator is mostly used as a confirmation for trend trading strategies. The Vortex was inspired by the work of Viktor Schauberger, who studied the flow of water in tur
A machine translation from the English product description was used. We apologize for possible imprecisions. È stata utilizzata una traduzione automatica dalla descrizione del prodotto in inglese. Ci scusiamo per eventuali imprecisioni. Un sistema di visualizzazione per i modelli di azione dei prezzi dei candelieri preferiti. Una volta collegato, l'indicatore segnerà automaticamente i modelli successivi sul grafico: Pinocchio bar  - un bar piccolo corpo con un lungo "naso", molto noto motivo inv
True Oversold Overbought MT5
Innovicient Limited
5 (1)
The True Oversold Overbought indicator provides you with ability to swiftly check whether the asset is oversold or overbought.  Other than complementing your trading with True Oversold Overbought, you can use the indicator as your only trading system. It works with all forex instruments and will save you the headache of estimating when the market is due for a reversal or retracement.  When the "Super Charge" feature is enabled, the areas where the price is in oversold/overbought status are ampli
Cumulative Vol Bands
Thalles Nascimento De Carvalho
CVB Cumulative Volume Bands: Potenzia le tue operazioni con il volume accumulato! CVB Cumulative Volume Bands è un indicatore avanzato progettato per i trader che cercano segnali precisi basati sul volume accumulato. Utilizzando bande di volume accumulato, questo indicatore offre letture chiare delle pressioni di acquisto e vendita nel mercato, aiutando a identificare inversioni e forti movimenti dei prezzi. Caratteristiche principali: Analisi del Volume Accumulato : Rileva i punt
Gli utenti di questo prodotto hanno anche acquistato
TPSpro RFI Levels MT5
Roman Podpora
4.73 (11)
ISTRUZIONI       RUS   -   INGLESE       Si   consiglia di utilizzare con un indicatore       -       TPSpro   TENDENZA PRO -   Versione MT4         Un elemento chiave nel trading sono le zone o i livelli da cui vengono prese le decisioni di acquisto o vendita di uno strumento di trading. Nonostante i tentativi dei principali attori di nascondere la loro presenza sul mercato, lasciano inevitabilmente delle tracce. Il nostro compito era imparare a identificare queste tracce e interpretarle corre
TPSproTREND PrO MT5
Roman Podpora
4.89 (9)
TPSpro TREND PRO   è un indicatore di tendenza che analizza automaticamente il mercato, fornisce informazioni sulla tendenza e sui rispettivi cambiamenti e fornisce segnali per entrare nelle operazioni senza ridisegnare. L'indicatore utilizza ciascuna candela e la analizza separatamente. Si riferisce a vari shock al rialzo o al ribasso. Punto di ingresso preciso per il trading di valute, criptovalute, metalli, azioni e indici! Versione MT5                   Descrizione completa dell'indicatore
Innanzitutto è importante sottolineare che questo sistema di trading è un indicatore Non-Repainting, Non-Redrawing e Non-Lagging, il che lo rende ideale sia per il trading manuale che per quello automatico. Corso online, manuale e download di preset. Il "Sistema di Trading Smart Trend MT5" è una soluzione completa pensata sia per i trader principianti che per quelli esperti. Combina oltre 10 indicatori premium e offre più di 7 robuste strategie di trading, rendendolo una scelta versatile per div
Atomic Analyst MT5
Issam Kassas
4.42 (19)
Innanzitutto, vale la pena sottolineare che questo indicatore di trading non è repaint, non è ridisegno e non presenta ritardi, il che lo rende ideale sia per il trading manuale che per quello automatico. Manuale utente: impostazioni, input e strategia. L'Analista Atomico è un indicatore di azione del prezzo PA che utilizza la forza e il momentum del prezzo per trovare un miglior vantaggio sul mercato. Dotato di filtri avanzati che aiutano a rimuovere rumori e segnali falsi, e aumentare il pote
Quantum Trend Sniper
Bogdan Ion Puscasu
4.8 (49)
Presentazione       Quantum Trend Sniper Indicator   , l'innovativo indicatore MQL5 che sta trasformando il modo in cui identifichi e scambi le inversioni di tendenza! Sviluppato da un team di trader esperti con un'esperienza di trading di oltre 13 anni,       Indicatore Quantum Trend Sniper       è progettato per spingere il tuo viaggio di trading verso nuove vette con il suo modo innovativo di identificare le inversioni di tendenza con una precisione estremamente elevata. *** Acquista Quant
TrendMaestro5
Stefano Frisetti
nota: questo indicatore e' per METATRADER5, se vuoi la versione per  METATRADER4 questo e' il link:   https://www.mql5.com/it/market/product/108106 TRENDMAESTRO ver 2.4 TRENDMAESTRO   riconosce un nuovo TREND sul nascere, non sbaglia mai. La sicurezza di identificare un nuovo TREND non ha prezzo. DESCRIZIONE TRENDMAESTRO identifica un nuovo TREND sul nascere, questo indicatore prende in esame la volatilita' i volumi ed il momentum per identificare il momento in cui c'e' un'esplosione di uno
Questo cruscotto mostra gli ultimi   pattern armonici   disponibili per i simboli selezionati, in modo da risparmiare tempo ed essere più efficienti /   versione MT4 . Indicatore gratuito:   Basic Harmonic Pattern Colonne dell'indicatore Symbol :   vengono visualizzati i simboli selezionati Trend:   rialzista o ribassista Pattern:   tipo di pattern (gartley, butterfly, bat, crab, shark, cypher o ABCD) Entry:   prezzo di ingresso SL:   prezzo di stop loss TP1:   1 prezzo di take profit TP
FX Power MT5 NG
Daniel Stein
5 (5)
Ricevi il tuo aggiornamento quotidiano sul mercato con dettagli e schermate tramite il nostro Morning Briefing qui su mql5 e su Telegram ! FX Power MT5 NG è la nuova generazione del nostro popolare misuratore di forza delle valute, FX Power. Cosa offre questo misuratore di forza di nuova generazione? Tutto ciò che avete amato dell'FX Power originale IN PIÙ Analisi della forza di ORO/XAU Risultati di calcolo ancora più precisi Periodi di analisi configurabili individualmente Limite di calcolo pe
Blahtech Supply Demand MT5
Blahtech Limited
4.54 (13)
Was: $299  Now: $99   Supply Demand uses previous price action to identify potential imbalances between buyers and sellers. The key is to identify the better odds zones, not just the untouched ones. Blahtech Supply Demand indicator delivers functionality previously unavailable on any trading platform. This 4-in-1 indicator not only highlights the higher probability zones using a multi-criteria strength engine, but also combines it with multi-timeframe trend analysis, previously confirmed swings
Matrix Arrow Indicator MT5
Juvenille Emperor Limited
5 (12)
Matrix Arrow Indicator MT5   è un trend unico 10 in 1 che segue un indicatore multi-timeframe al   100% non ridipinto   che può essere utilizzato su tutti i simboli/strumenti:   forex ,   materie prime ,   criptovalute ,   indici ,   azioni .  Matrix Arrow Indicator MT5  determinerà la tendenza attuale nelle sue fasi iniziali, raccogliendo informazioni e dati da un massimo di 10 indicatori standard, che sono: Indice di movimento direzionale medio (ADX) Indice del canale delle materie prime (CCI
Top indicator for MT5   providing accurate signals to enter a trade without repainting! It can be applied to any financial assets:   forex, cryptocurrencies, metals, stocks, indices .  Watch  the video  (6:22) with an example of processing only one signal that paid off the indicator! MT4 version is here It will provide pretty accurate trading signals and tell you when it's best to open a trade and close it. Most traders improve their trading results during the first trading week with the help of
FxaccurateLS
Shiv Raj Kumawat
WHY IS OUR FXACCCURATE LS MT5 THE PROFITABLE ? PROTECT YOUR CAPITAL WITH RISK MANAGEMENT Gives entry, stop and target levels from time to time. It finds Trading opportunities by analyzing what the price is doing during established trends. POWERFUL INDICATOR FOR A RELIABLE STRATEGIES We have made these indicators with a lot of years of hard work. It is made at a very advanced level. Established trends provide dozens of trading opportunities, but most trend indicators completely ignore them!
AT Forex Indicator MT5
Marzena Maria Szmit
5 (4)
The AT Forex Indicator MT5 is a sophisticated trading tool designed to provide traders with a comprehensive analysis of multiple currency pairs. This powerful indicator simplifies the complex nature of the forex market, making it accessible for both novice and experienced traders. AT Forex Indicator uses advanced algorithms to detect trends, patterns and is an essential tool for traders aiming to enhance their forex trading performance. With its robust features, ease of use, and reliable signal
Advanced Supply Demand MT5
Bernhard Schweigert
4.5 (14)
La migliore soluzione per qualsiasi principiante o trader esperto! Questo indicatore è uno strumento di trading unico, di alta qualità e conveniente perché abbiamo incorporato una serie di funzionalità proprietarie e una nuova formula. Con questo aggiornamento, sarai in grado di mostrare fusi orari doppi. Non solo potrai mostrare una TF più alta, ma anche entrambe, la TF del grafico, PIÙ la TF più alta: SHOWING NESTED ZONES. Tutti i trader di domanda di offerta lo adoreranno. :) Informazioni imp
TPA True Price Action indicator reveals the true price action of the market makers through 100% non-repainting signals strictly at the close of a candle! TPA shows entries and re-entries, every time the bulls are definitely stronger than the bears and vice versa. Not to confuse with red/green candles. The shift of power gets confirmed at the earliest stage and is ONE exit strategy of several. There are available now two free parts of the TPA User Guide for our customers. The first "The Basics"
XQ Indicator MetaTrader 5
Marzena Maria Szmit
3 (2)
Step into the realm of Forex trading with confidence and precision using XQ, a cutting-edge Forex indicator designed to elevate your trading game to unprecedented heights. Whether you're a seasoned trader or just stepping into the world of currency exchange, XQ Forex Indicator empowers you with the insights and signals needed to make informed trading decisions. The signal conditions are a combination of three indicators, and XQ Forex Indicator only display  medium and long-term trends . The ind
PZ Swing Trading MT5
PZ TRADING SLU
5 (4)
Protect against whipsaws: revolutionize your swing trading approach Special Offer: Purchase now to receive free bonuses worth $135! (Read more for details) Swing Trading is the first indicator designed to detect swings in the direction of the trend and possible reversal swings. It uses the baseline swing trading approach, widely described in trading literature. The indicator studies several price and time vectors to track the aggregate trend direction and detects situations in which the market i
Trade smarter, not harder: Empower your trading with Harmonacci Patterns Special Offer: Purchase now to receive free bonuses worth $165! (Read more for details) This is arguably the most complete harmonic price formation auto-recognition indicator you can find for the MetaTrader Platform. It detects 19 different patterns, takes fibonacci projections as seriously as you do, displays the Potential Reversal Zone (PRZ) and finds suitable stop-loss and take-profit levels. [ Installation Guide | Up
FX Volume MT5
Daniel Stein
4.93 (14)
Ricevi il tuo aggiornamento quotidiano sul mercato con dettagli e schermate tramite il nostro Morning Briefing qui su mql5 e su Telegram ! FX Volume è il PRIMO e UNICO indicatore di volume che fornisce una visione REALE del sentiment del mercato dal punto di vista del broker. Fornisce informazioni straordinarie su come gli operatori di mercato istituzionali, come i broker, sono posizionati sul mercato Forex, molto più velocemente dei rapporti COT. Vedere queste informazioni direttamente sul vo
Noize Absorption Index - is the manual trading system that measures the difference of pressure between bears forces and bulls forces. Green line - is a noize free index that showing curent situation. Zero value of index shows totally choppy/flat market.Values above zero level shows how powerfull bullish wave is and values below zero measures bearish forces.Up arrow appears on bearish market when it's ready to reverse, dn arrow appears on weak bullish market, as a result of reverse expectation.
PZ Support Resistance MT5
PZ TRADING SLU
4.17 (6)
Unlock key market insights with automated support and resistance lines Special Offer: Purchase now to receive free bonuses worth $75! (Read more for details) Tired of plotting support and resistance lines? This is a multi-timeframe indicator that detects and plots supports and resistance lines in the chart with the same precision as a human eye would. As price levels are tested over time and its importance increases, the lines become thicker and darker, making price leves easy to glance and ev
Gold Trend 5
Sergei Linskii
5 (1)
Gold Trend - è un buon indicatore tecnico azionario. L'algoritmo dell'indicatore analizza il movimento del prezzo di un asset e riflette la volatilità e le potenziali zone di ingresso. I migliori segnali dell'indicatore: - Per VENDERE = istogramma rosso + puntatore SHORT rosso + freccia di segnale gialla nella stessa direzione. - Per l'ACQUISTO = istogramma blu + puntatore LONG blu + freccia di segnale acquatica nella stessa direzione. Vantaggi dell'indicatore: 1. L'indicatore produ
Questo cruscotto scopre e visualizza le zone di   domanda   e   offerta   sul grafico, sia in modalità scalping che a lungo termine, a seconda della vostra strategia di trading per i simboli selezionati. Inoltre, la modalità scanner del cruscotto vi aiuta a controllare tutti i simboli desiderati in un colpo d'occhio e a non perdere nessuna posizione adatta /   versione MT4 Indicatore gratuito:   Basic Supply Demand Caratteristiche Consente di visualizzare le opportunità di trading su pi
The Price Action Finder Multi indicator is an indicator of entry points that searches for and displays Price Action system patterns on dozens of trading instruments and on all standard time frames: (m1, m5, m15, m30, H1, H4, D1, Wk, Mn). The indicator places the found patterns in a table at the bottom of the screen. By clicking on the pattern names in the table, you can move to the chart where this pattern is located. Manual (Be sure to read before purchasing) | Version for MT4 Advantages 1. Pa
MTF ATR dell'oro: questo è un indicatore tecnico di titoli azionari. L'algoritmo dell'indicatore ATR (Average True Range) analizza il movimento del prezzo dell'asset e riflette la volatilità disegnando i livelli corrispondenti in percentuali specificate (%) del prezzo di apertura del periodo di tempo specificato (D1). Gli indicatori (rosso e/o blu D1 H4) della direzione del movimento del prezzo del simbolo e i segnali delle frecce sono aiuti aggiuntivi ed essenziali per un trading intraday como
Automated Trendlines MT5
Georgios Kalomoiropoulos
Le linee di tendenza sono lo strumento più essenziale di analisi tecnica nel forex trading. Sfortunatamente, la maggior parte dei trader non li disegna correttamente. L'indicatore automatizzato delle linee di tendenza è uno strumento professionale per i trader seri che ti aiuta a visualizzare il movimento di tendenza dei mercati. Esistono due tipi di linee di tendenza, linee di tendenza rialziste e linee di tendenza ribassiste. Nella tendenza rialzista, la linea di tendenza Forex viene t
Was: $249  Now: $99   Market Profile defines a number of day types that can help the trader to determine market behaviour. A key feature is the Value Area, representing the range of price action where 70% of trading took place. Understanding the Value Area can give traders valuable insight into market direction and establish the higher odds trade. It is an excellent addition to any system you may be using. Inspired by Jim Dalton’s book “Mind Over Markets”, this indicator is designed to suit the
Order Block Hunter MT5
Noha Mohamed Fathy Younes Badr
5 (1)
Order block hunter indicator is the best indicator for  hunt the order blocks that area where there has been a large concentration of limit orders waiting to be executed Order blocks are identified on a chart by observing previous price action and looking for areas where the price experienced significant movement or sudden changes in direction .This indicator does that for you by using very complicated codes and helps you to take the best areas To buy and sell because it make marks at the best a
MetaForecast M5
Vahidreza Heidar Gholami
5 (2)
MetaForecast predice e visualizza il futuro di qualsiasi mercato basandosi sull'armonia dei dati dei prezzi. Sebbene il mercato non sia sempre prevedibile, se esiste un modello nei prezzi, MetaForecast può prevedere il futuro con la massima precisione possibile. Rispetto ad altri prodotti simili, MetaForecast può generare risultati più accurati analizzando le tendenze di mercato. Parametri di input Past size (Dimensione passata) Specifica il numero di barre che MetaForecast utilizza per creare
Golden Spikes Premium
Kwaku Bondzie Ghartey
Golden Spikes Detector Acknowledgement and Dedications:  The name of this indicator was Inspired by an Original; Mr Grant Koopman; a Knowledgeable and experienced Synthetics trader. I dedicate this indicator to Mr Grant.  Overview: The Golden Spikes Premium is a groundbreaking trading indicator meticulously crafted for the Boom and Crash indices on the Deriv market. Tailored to meet the needs of discerning traders, this powerful tool operates exclusively on the one-minute timeframe, providin
Altri dall’autore
UR Control Panel
Krzysztof Jan Debski
5 (2)
Pannello di controllo dell'UR   UR Control Panel è uno strumento che voglio condividere con te GRATUITAMENTE. È un pannello interattivo che mi ha aiutato nel mio trading e ha potenziato la mia scansione del mercato ogni giorno. Spero che soddisfi anche le tue esigenze! Come utilizzare il Pannello di controllo UR? È un doppio pannello mobile e ridimensionabile di cui: - Uno di questi mostra la forza della valuta nel periodo di tempo specificato - L'altro consente alle opzioni di spostarsi
FREE
UR Basket
Krzysztof Jan Debski
Cestino UR   Il meglio che puoi fare è proteggere i tuoi ordini dal trasformarsi in perdite. Ora puoi rilassarti e lasciare che UR Basket se ne occupi. Vantaggi dell'utilizzo di UR Basket: Tutti i parametri sono modificabili dinamicamente nel pannello grafico del grafico - NON è necessario riavviare l'EA per modificare i parametri o richiamare le impostazioni utilizzate! Puoi monitorare i tuoi ordini tramite:   - Numero magico   - Commento EA   - Entrambi i precedenti   - Tutte le tue ope
UR DivergenceSpotter
Krzysztof Jan Debski
UR Divergence Spotter   UR DivergenceSpotter è il risultato di molti anni di esperienza e talvolta i modi più semplici sono i migliori. C'è una buona correlazione tra alcuni indicatori, ma quando non corrispondono - il prezzo cerca di "aggiustarsi" - ed è in quel momento che riceviamo un segnale con UR DivergenceSpotter. Vantaggi dell'utilizzo di UR Divergence Spotter: Nessun parametro Non ridipingere dopo che la candela è stata creata Segnala quando il segnale non è più valido (il che si
UR VolumeTrend
Krzysztof Jan Debski
UR VolumeTrend   UR VolumeTrend è l'indicatore di volume più chiaro che mostra la tendenza in corso in termini di volume. Funziona perfettamente con altri indicatori proprio come UR TrendExhaustion per segnalare massimi e minimi locali. Limitato a soli 2 parametri: più alti sono i valori, più lunghe saranno le tendenze che mostrerà. Gli estremi del gradiente mostrano possibili esaurimenti di volume per catturare una potenziale inversione. Due righe: l'andamento del volume e la media. Il mig
UR TrendExhaustion
Krzysztof Jan Debski
UR Trend Esaurimento   UR TrendExhaustion è la soluzione migliore per i trader che non vogliono avere a che fare con i valori dei parametri né con altre configurazioni: è facile e visivamente comprensibile per tutti. Vantaggi dell'utilizzo di UR TrendExhaustion: Nessun parametro Hai 3 linee che descrivono al meglio cosa sta succedendo sul grafico: Trend Exhaustion Line, Whale Money Line e Retail Money Line. L'interfaccia mostra l'esaurimento di entrambe le linee su entrambi gli estremi (a
UR HighsAndLows
Krzysztof Jan Debski
UR Massimi e minimi   UR Highs&Lows esegue un'analisi approfondita del movimento del prezzo e della sua volatilità e crea un canale all'interno del quale il prezzo si muove. Quel canale ora si muove come un oscillatore ed è ricoperto dalla deviazione del prezzo per segnalare potenziali esaurimenti e possibili inversioni. Vantaggi dell'utilizzo di UR Highs&Lows: Nessun parametro Hai 3 linee che descrivono il movimento del prezzo: la linea bianca che è una media del prezzo e le linee blu ch
UR Momenter
Krzysztof Jan Debski
UR Momento   UR Momenter calcola perfettamente il momentum del prezzo in correlazione all'esaurimento del movimento del prezzo rappresentato come oscillatore. Pertanto questo ci dà segnali molto precoci di potenziali inversioni o ritracciamenti. Questa formula è stata scoperta nel 2018 dopo lo scoppio della bolla di mercato. Vantaggi dell'utilizzo di UR Momenter: Nessun parametro Hai 2 linee che descrivono il movimento del prezzo - Linea bianca che è il Momentum del prezzo in correlazione
UR FrontEndBackEnd
Krzysztof Jan Debski
UR FrontEndBackEnd   UR FrontEndBackEnd è la mia formula preferita per trovare i livelli più accurati di supporto e resistenza. Li ho anche suddivisi in diverse categorie (linee tratteggiate, linee continue e aree) per evidenziare quanto sono forti. Tutto è memorizzato in buffer in modo che siano facilmente accessibili e implementabili all'interno di altri strumenti. Aggiunta: potrebbe essere necessario adattare lo strumento all'asset su cui è applicato: gli asset differiscono in termini di
UR Gamma
Krzysztof Jan Debski
UR Gamma (alimentato da calcoli simili trovati nei sistemi di Machine Learning) UR Gamma è uno strumento di analisi finanziaria all'avanguardia che offre una versione nuova e migliorata del classico indicatore WaveTrend. Incorporando tecniche avanzate di elaborazione del segnale digitale, UR Gamma risolve alcuni dei limiti degli algoritmi WaveTrend tradizionali e fornisce un approccio più accurato, robusto e dinamico per identificare e misurare le tendenze nell'azione dei prezzi. Vantaggi d
UR Bands
Krzysztof Jan Debski
Bande UR (con una formula utilizzata nei sistemi di Machine Learning) UR Bands è un indicatore derivato attraverso una formula che incorpora la volatilità del mercato è simile in linea di principio a quelli utilizzati nei sistemi di apprendimento automatico. Questa rappresentazione matematica delle condizioni di mercato offre un'analisi precisa delle tendenze e delle dinamiche dei prezzi, tenendo conto della volatilità intrinseca dei mercati finanziari. Incorporando la volatilità come variabi
UR Vortex
Krzysztof Jan Debski
UR Vortex The Probabilistic UR Vortex Formula: An Accurate System for Predictive Market Analysis using Volatility and Standard Deviation Calculations. The   UR Vortex   indicator is a technical analysis tool that uses volatility and standard deviation calculations to predict potential tops and bottoms in a market. It measures the strength of a trend by calculating the distance between the current price and a moving average, and then standardizing this distance by dividing it by the average true
UR PulseScalp
Krzysztof Jan Debski
UR PulseScalp  Un indicatore di trading calibrato per gli scalper che cercano il massimo vantaggio nei mercati frenetici UR PulseScalp è una soluzione di trading all'avanguardia per gli scalper che cercano il massimo vantaggio nei mercati frenetici. Questo indicatore innovativo si basa su una formula scientificamente calibrata che combina la potenza di Volatilità, MoneyFlow e Relative Strength per creare un segnale altamente accurato e affidabile. Vantaggi dell'utilizzo di UR PulseScalp :
UR TradeManager
Krzysztof Jan Debski
UR_TradeManager per MetaTrader 4 Massimizza il tuo potenziale di trading con UR_TradeManager, lo strumento definitivo per migliorare il trading, progettato specificamente per la piattaforma MetaTrader 4. Realizzato con precisione e funzionalità in mente, questo strumento completo è essenziale per i trader che mirano a elevare le loro capacità di analisi di mercato, esecuzione e gestione. Caratteristiche Principali: Dashboard di Trading Visiva : Gestisci i tuoi scambi direttamente da un cruscotto
UR Basket MT5
Krzysztof Jan Debski
Cestino UR   Il meglio che puoi fare è proteggere i tuoi ordini dal trasformarsi in perdite. Ora puoi rilassarti e lasciare che UR Basket se ne occupi. Vantaggi dell'utilizzo di UR Basket: Tutti i parametri sono modificabili dinamicamente nel pannello grafico del grafico - NON è necessario riavviare l'EA per modificare i parametri o richiamare le impostazioni utilizzate! Puoi monitorare i tuoi ordini tramite:   - Numero magico   - Commento EA   - Entrambi i precedenti   - Tutte le tue ope
UR Divergence Spotter   UR DivergenceSpotter è il risultato di molti anni di esperienza e talvolta i modi più semplici sono i migliori. C'è una buona correlazione tra alcuni indicatori, ma quando non corrispondono - il prezzo cerca di "aggiustarsi" - ed è in quel momento che riceviamo un segnale con UR DivergenceSpotter. Vantaggi dell'utilizzo di UR Divergence Spotter: Nessun parametro Non ridipingere dopo che la candela è stata creata Segnala quando il segnale non è più valido (il che si
UR VolumeTrend MT5
Krzysztof Jan Debski
UR VolumeTrend   UR VolumeTrend è l'indicatore di volume più chiaro che mostra la tendenza in corso in termini di volume. Funziona perfettamente con altri indicatori proprio come UR TrendExhaustion per segnalare massimi e minimi locali. Limitato a soli 2 parametri: più alti sono i valori, più lunghe saranno le tendenze che mostrerà. Gli estremi del gradiente mostrano possibili esaurimenti di volume per catturare una potenziale inversione. Due righe: l'andamento del volume e la media. Il mig
UR Trend Esaurimento   UR TrendExhaustion è la soluzione migliore per i trader che non vogliono avere a che fare con i valori dei parametri né con altre configurazioni: è facile e visivamente comprensibile per tutti. Vantaggi dell'utilizzo di UR TrendExhaustion: Nessun parametro Hai 3 linee che descrivono al meglio cosa sta succedendo sul grafico: Trend Exhaustion Line, Whale Money Line e Retail Money Line. L'interfaccia mostra l'esaurimento di entrambe le linee su entrambi gli estremi (a
UR HighsAndLows MT5
Krzysztof Jan Debski
UR Massimi e minimi   UR Highs&Lows esegue un'analisi approfondita del movimento del prezzo e della sua volatilità e crea un canale all'interno del quale il prezzo si muove. Quel canale ora si muove come un oscillatore ed è ricoperto dalla deviazione del prezzo per segnalare potenziali esaurimenti e possibili inversioni. Vantaggi dell'utilizzo di UR Highs&Lows: Nessun parametro Hai 3 linee che descrivono il movimento del prezzo: la linea bianca che è una media del prezzo e le linee blu ch
UR Momenter MT5
Krzysztof Jan Debski
UR Momento   UR Momenter calcola perfettamente il momentum del prezzo in correlazione all'esaurimento del movimento del prezzo rappresentato come oscillatore. Pertanto questo ci dà segnali molto precoci di potenziali inversioni o ritracciamenti. Questa formula è stata scoperta nel 2018 dopo lo scoppio della bolla di mercato. Vantaggi dell'utilizzo di UR Momenter: Nessun parametro Hai 2 linee che descrivono il movimento del prezzo - Linea bianca che è il Momentum del prezzo in correlazione
UR FrontEndBackEnd   UR FrontEndBackEnd è la mia formula preferita per trovare i livelli più accurati di supporto e resistenza. Li ho anche suddivisi in diverse categorie (linee tratteggiate, linee continue e aree) per evidenziare quanto sono forti. Tutto è memorizzato in buffer in modo che siano facilmente accessibili e implementabili all'interno di altri strumenti. Aggiunta: potrebbe essere necessario adattare lo strumento all'asset su cui è applicato: gli asset differiscono in termini di
UR Gamma MT5
Krzysztof Jan Debski
UR Gamma (alimentato da calcoli simili trovati nei sistemi di Machine Learning) UR Gamma è uno strumento di analisi finanziaria all'avanguardia che offre una versione nuova e migliorata del classico indicatore WaveTrend. Incorporando tecniche avanzate di elaborazione del segnale digitale, UR Gamma risolve alcuni dei limiti degli algoritmi WaveTrend tradizionali e fornisce un approccio più accurato, robusto e dinamico per identificare e misurare le tendenze nell'azione dei prezzi. Vantaggi d
UR Bands MT5
Krzysztof Jan Debski
Bande UR (con una formula utilizzata nei sistemi di Machine Learning) UR Bands è un indicatore derivato attraverso una formula che incorpora la volatilità del mercato è simile in linea di principio a quelli utilizzati nei sistemi di apprendimento automatico. Questa rappresentazione matematica delle condizioni di mercato offre un'analisi precisa delle tendenze e delle dinamiche dei prezzi, tenendo conto della volatilità intrinseca dei mercati finanziari. Incorporando la volatilità come variabi
UR PulseScalp MT5
Krzysztof Jan Debski
UR PulseScalp MT5 Un indicatore di trading calibrato per gli scalper che cercano il massimo vantaggio nei mercati frenetici UR PulseScalp MT5 è una soluzione di trading all'avanguardia per gli scalper che cercano il massimo vantaggio nei mercati frenetici. Questo indicatore innovativo si basa su una formula scientificamente calibrata che combina la potenza di Volatilità, MoneyFlow e Relative Strength per creare un segnale altamente accurato e affidabile. Vantaggi dell'utilizzo di UR PulseSc
UR TradeManager MT5
Krzysztof Jan Debski
UR_TradeManager per MetaTrader 5 Massimizza il tuo potenziale di trading con UR_TradeManager, lo strumento definitivo per migliorare il trading, progettato specificamente per la piattaforma MetaTrader 4. Realizzato con precisione e funzionalità in mente, questo strumento completo è essenziale per i trader che mirano a elevare le loro capacità di analisi di mercato, esecuzione e gestione. Caratteristiche Principali: Dashboard di Trading Visiva : Gestisci i tuoi scambi direttamente da un cruscotto
Filtro:
Nessuna recensione
Rispondi alla recensione
Versione 1.10 2024.05.21
Readjusted calculations, boosted indicator's performance. Works with Strategy tester.