UR TrendExhaustion MT5
- Indicatori
- Krzysztof Jan Debski
- Versione: 4.10
- Aggiornato: 17 maggio 2024
- Attivazioni: 5
UR Trend Esaurimento
UR TrendExhaustion è la soluzione migliore per i trader che non vogliono avere a che fare con i valori dei parametri né con altre configurazioni: è facile e visivamente comprensibile per tutti.
Vantaggi dell'utilizzo di UR TrendExhaustion:
Nessun parametro
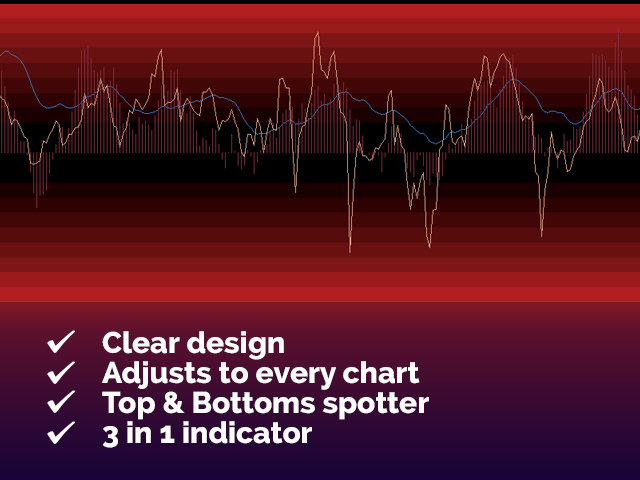
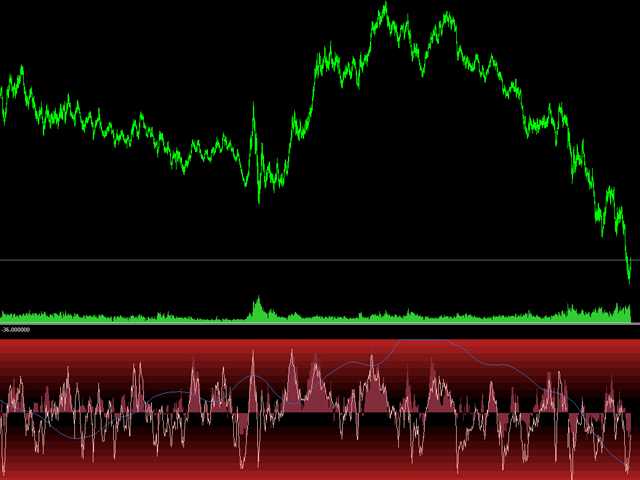
Hai 3 linee che descrivono al meglio cosa sta succedendo sul grafico: Trend Exhaustion Line, Whale Money Line e Retail Money Line.
L'interfaccia mostra l'esaurimento di entrambe le linee su entrambi gli estremi (aree rosse)
Il miglior vantaggio: facile e adattato a tutte le risorse.
C'è una speciale chat di Telegram su cui puoi rimanere aggiornato sugli aggiornamenti degli strumenti e anche inviare richieste se ritieni che manchi qualcosa!
Perché UR TrendExhaustion?
Ho codificato molti tipi di indicatori durante la mia carriera e sono arrivato a un punto in cui ho raccolto tutte le mie conoscenze per codificare questo strumento semplice ma migliore (imo) per fare trading senza la necessità di altri strumenti sul grafico. Facile da capire, facile da configurare. La strategia è fatta in modo tale che sarà davvero difficile per i Market Maker fare trading contro di essa - scacco matto MM!
Qualsiasi strumento aggiuntivo che usi con UR TrendExhaustion si aggiungerà al tuo trading, ma l'ho usato da solo con ottimi risultati. Buona fortuna!
Come usare UR TrendExhaustion?
C'è un video su YT che mostra come utilizzare il pannello grafico, ma vedi anche la descrizione qui sotto per avere più familiarità con esso:
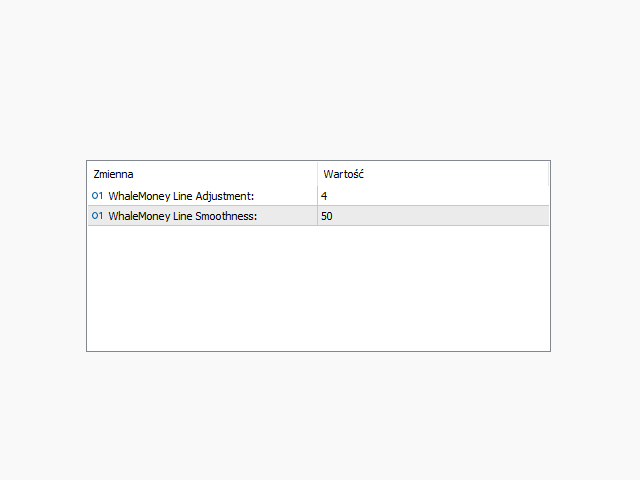
IMPOSTAZIONI
Nessuno
SCHERMO
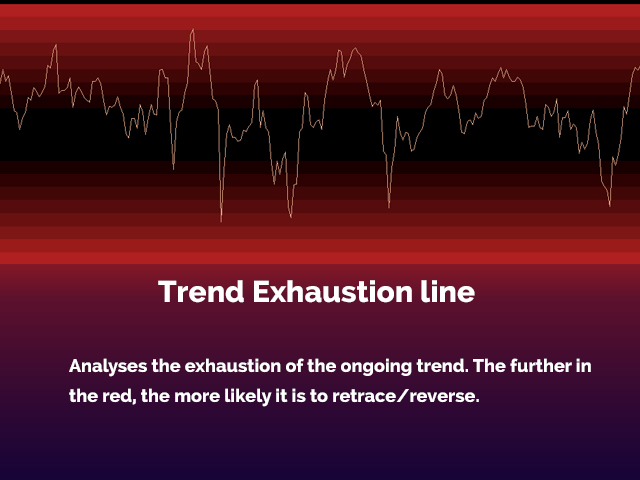
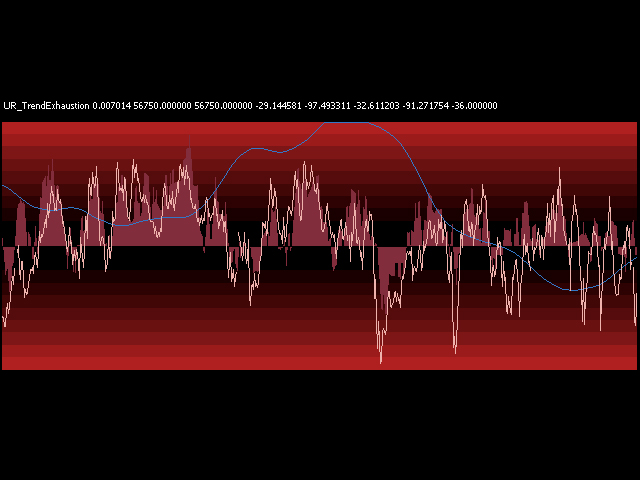
Linea principale di esaurimento del trend: mostra l'esaurimento del trend. Più sul rosso, maggiore è la possibilità di inversione.
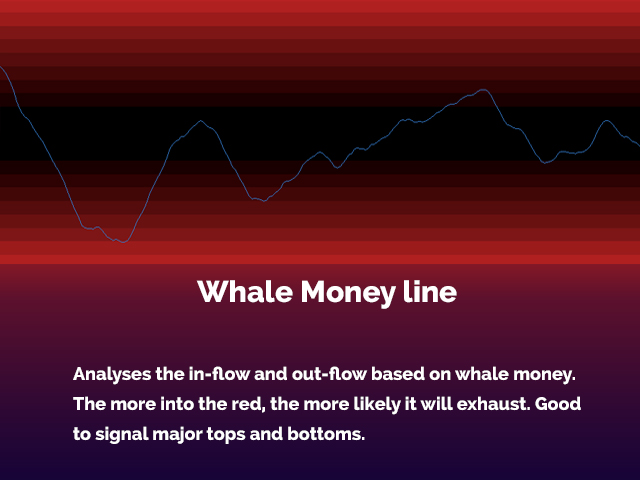
Whale Money Line (blu): mostra l'afflusso di denaro Whale - Più è alto, più è probabile che le balene si fermino.
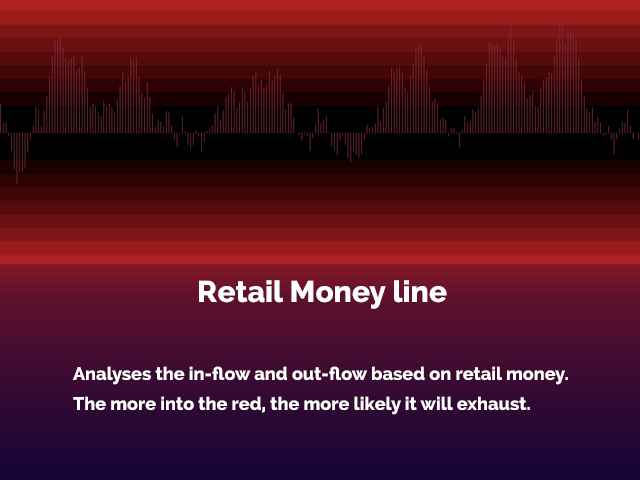
Istogramma del denaro al dettaglio: mostra l'afflusso di denaro al dettaglio: più è alto, più la vendita al dettaglio diventa secca.
AGGIUNTA
Tutti i miei strumenti funzionano meglio una volta assemblati. Ciò significa che la precisione dei punti di ingresso è decisamente migliore se utilizzata con UR DivergenceSpotter, UR VolumeTrend o/e UR HighsAndLows.