Box Weis Wave
- Indicatori
- Thalles Nascimento De Carvalho
- Versione: 2.0
- Attivazioni: 5
Eleva la tua analisi con Weis Wave Box! 📊🚀
Se stai cercando precisione e chiarezza nel tuo trading, Weis Wave Box è lo strumento che fa per te. Questo indicatore avanzato offre un'analisi visiva dettagliata delle onde di volume e dei punti di swing, aiutandoti a comprendere meglio la relazione tra sforzo e risultati nel mercato.
Caratteristiche principali di Weis Wave Box:
📈 Onde di Volume Personalizzabili: Regola le onde di volume in tick per adattarle alle tue strategie di trading.
🔍 Storico Regolabile: Concentrati su periodi di tempo specifici per un'analisi più precisa e pertinente.
🔄 Tick vs. Volume Reale: Differenzia chiaramente tra tick e volume reale per ottenere una visione più completa del mercato.
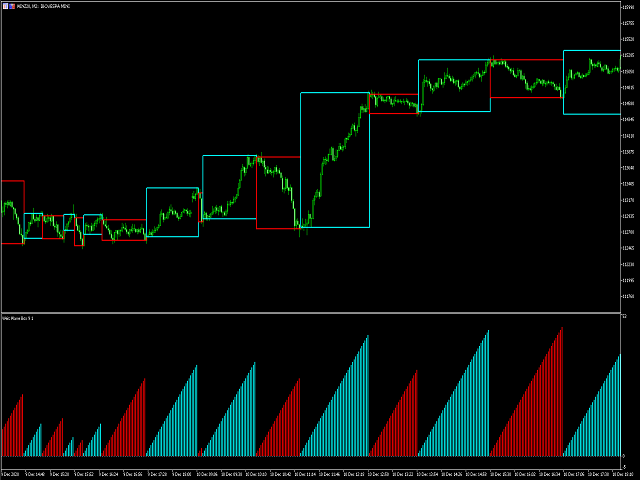
📊 Visualizzazione delle Scatole Superiori: Vedi chiaramente dove il volume (energia) era maggiore e dove il prezzo ha avuto meno spostamento. Questa visualizzazione aiuta a identificare la relazione tra sforzo e risultati, evidenziando le forze dominanti e segnalando potenziali spostamenti futuri dei prezzi.
⚙️ Forme di Swing Personalizzabili: Utilizza cinque diverse forme di swing, come totalVol, length, width, barDVol e lengthDVol, per adattare l'analisi alle tue esigenze.
Benefici di Weis Wave Box:
- Chiarezza nell'Analisi: Comprendi la relazione tra sforzo e risultati, identifica quale lato sta prevalendo e come ciò potrebbe influenzare i futuri movimenti dei prezzi.
- Interfaccia Intuitiva: Navigazione semplice e utilizzo efficace dell'indicatore.
- Opportunità di Trading: Massimizza le tue strategie e i tuoi risultati con un'analisi precisa.
L'indicatore Swing Point Volume può essere acquistato tramite questo link:
👉 Acquista lo Swing Point Volume Qui
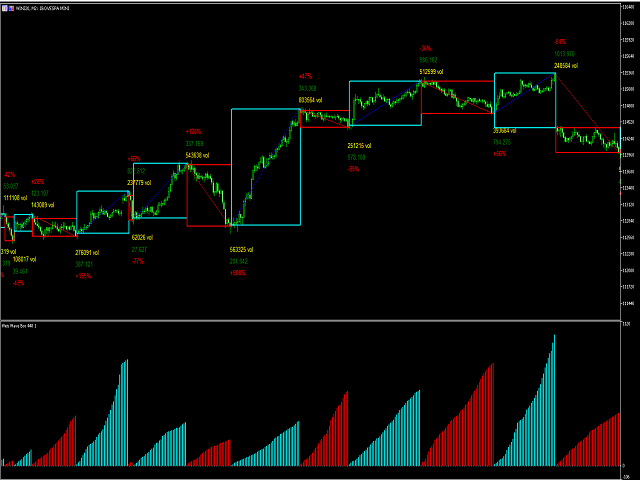


A Very good product.The Box format is very nice.The developer has said there are 5 options to print text near the boxes.The description pictures also show the Wave Distance printed next to the Boxes.However,I am not able to see any text printed near the boxes and I have tried all the options.Maybe something was missed in the update.I have sent a note to the developer and I am hoping that he would fix it soon to restore the full functionality as described.