• Panoramica
  • Recensioni (4)
  • Commenti (6)
  • Novità

PZ Absolute Gains

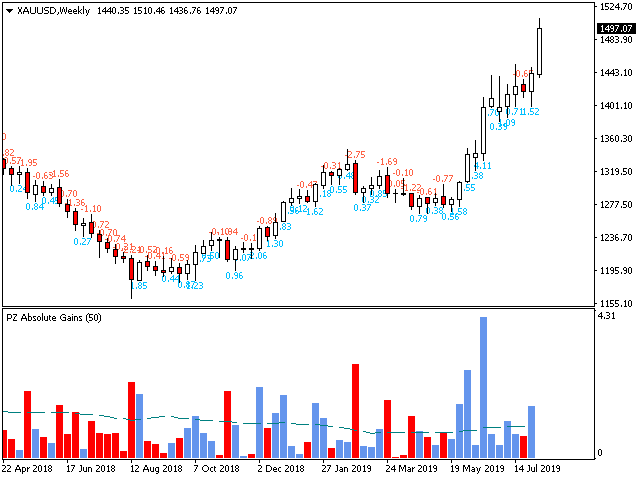
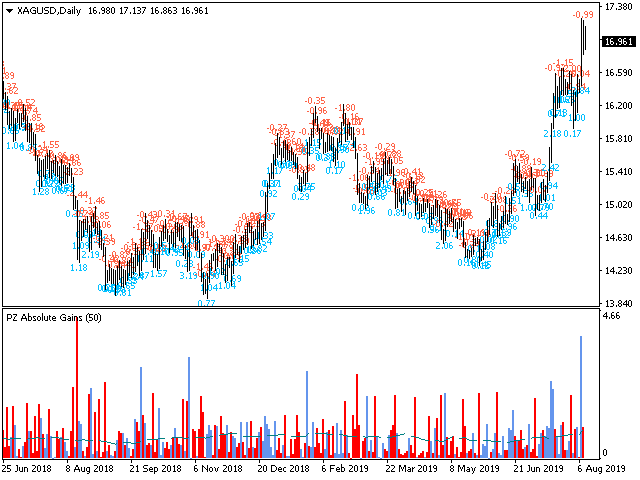
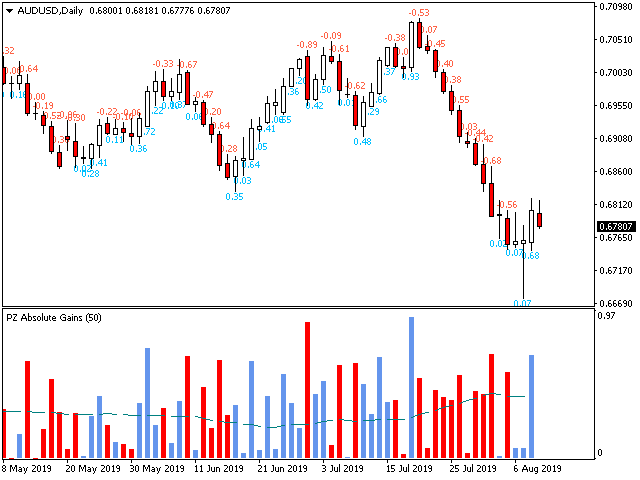
This indicator calculates how much has an instrument won or lost in percentage terms on each bar displayed in the chart.

[ Installation Guide | Update Guide | Troubleshooting | FAQ | All Products ]

  • Identify market patterns
  • Find decisive price movements
  • Be suspicious about overbought/oversold situations

It is an extremely easy to use indicator...

  • The blue histogram represents winning bars
  • The red histogram represents losing bars
  • The gray line represents the average win/loss per bar
  • Labels are plotted on each bar displaying the % win/loss for the bar

...with straightforward trading implications, depending your trading approach.

  • You can buy after an oversold bar takes place
  • You can short after an overbought bar takes place
  • You can buy after a decisive winning bar
  • You can short after a decisive losing bar


Input Parameters

  • Max History Bars: Number of bars to evaluate when the indicator is loaded
  • MA Period: Averaging period to calculate the average price movement in the oscillator

Author

Arturo López Pérez, private investor and speculator, software engineer and founder of Point Zero Trading Solutions.

Prodotti consigliati
The indicator allows you to trade binary options. The recommended time frame is М1 and the expiration time is 1,2,3 minutes. The indicator suitable for auto and manual trading. A possible signal is specified as a arrows above/under a candle. You should wait until the candle closes! Arrows are not re-painted Trade sessions: TOKYO section (Half-end) Currency pairs: USD/JPY Working time frame: M1 Expiration time: 1,2,3 minutes. The indicator also shows good results when using the martingale strateg
FREE
VR Cub
Vladimir Pastushak
VR Cub è un indicatore per ottenere punti di ingresso di alta qualità. L'indicatore è stato sviluppato per facilitare i calcoli matematici e semplificare la ricerca dei punti di ingresso in una posizione. La strategia di trading per la quale è stato scritto l'indicatore ha dimostrato la sua efficacia per molti anni. La semplicità della strategia di trading è il suo grande vantaggio, che consente anche ai trader alle prime armi di commerciare con successo con essa. VR Cub calcola i punti di apert
Daily Candle Predictor è un indicatore che prevede il prezzo di chiusura di una candela. L'indicatore è destinato principalmente all'uso sui grafici D1. Questo indicatore è adatto sia per il trading forex tradizionale che per il trading di opzioni binarie. L'indicatore può essere utilizzato come sistema di trading autonomo o può fungere da aggiunta al sistema di trading esistente. Questo indicatore analizza la candela corrente, calcolando alcuni fattori di forza all'interno del corpo della cande
Koala Fibo Base Time
Ashkan Hazegh Nikrou
3 (1)
Welcome to Koala Fibo Base Time Welcome to Koala Fibo Time Zone Welcome to Koala Fibo Time Extention Welcome to Missed Tool For Meta Trade! Simple Introduction : Fibonacci Time Zones are vertical lines based on the Fibonacci Sequence. These lines extend along the X axis (date axis) as a mechanism to forecast reversals based on elapsed time. A major low or high is often chosen as the starting point. Distances start relatively small and grow as the Fibonacci Sequence extends. Chartists can exten
FREE
Noize Absorption Index MT4
Ekaterina Saltykova
5 (1)
Noize Absorption Index - is the manual trading system that measures the difference of pressure between bears forces and bulls forces. Green line - is a noize free index that showing curent situation. Zero value of index shows totally choppy/flat market.Values above zero level shows how powerfull bullish wave is and values below zero measures bearish forces.Up arrow appears on bearish market when it's ready to reverse, dn arrow appears on weak bullish market, as a result of reverse expectation. S
This is the FXTraderariel-TakeProfit - Stop Loss Indicator . It provides you 3 potential Take Profits and 1 Stop Loss. These potential targets are computed based on several methods . The indicator can be used on every time frame, but we advise to use it on H1, H4 and D1. Especially if you are a novice trader. Pro Traders can also you use it for scalping in smaller time frames (M1, M5 and M15). This indicator is not a complete trading system. It doesn't provide you a Signal nor can predict the m
Fibonacci retracements can be used to draw support lines, identify resistance levels, place stop-loss orders and set target prices. The Advanced Automatic Fibonacci retracements draws automatically all the levels. You have a lot of options to choose. For exemple you can use the tracements of another time frame (MTF) in the current chart, you can also choose between the closest level or less close to draw the retracements. You can also add 2 levels of your choice. You can add levels extensions o
Trend Catcher with Alert
Issam Kassas
4.71 (51)
Il Catturatore di Tendenza: La Strategia del Catturatore di Tendenza con Indicatore di Allarme è uno strumento versatile di analisi tecnica che aiuta i trader a identificare le tendenze di mercato e i potenziali punti di ingresso e uscita. Presenta una Strategia dinamica del Catturatore di Tendenza, adattandosi alle condizioni di mercato per una chiara rappresentazione visiva della direzione della tendenza. I trader possono personalizzare i parametri in base alle loro preferenze e tolleranza
FREE
PZ Fibonacci
PZ TRADING SLU
Are you tired of plotting fibonacci retracements or extensions manually? This indicator displays fibonacci retracements or extensions automatically, calculated from two different price points, without human intervention or manual object anchoring.  [ Installation Guide | Update Guide | Troubleshooting | FAQ | All Products ] Easy to use Manual anchoring is not needed Perfect for price confluence studies The indicator evaluates if retracements or extensions are needed Once drawn, you can manually
Strong Retracement Points Pro demo edition! SRP (Strong Retracement/Reversal Points) is a powerful and unique support and resistance indicator. It displays the closest important levels which we expect the price retracement/reversal! If all level are broken from one side, it recalculates and draws new support and resistance levels, so the levels might be valid for several days depending on the market! If you are still hesitating to start using this wonderful tool, you can check this link to see h
Automatic redrawing of Trend Supports and resistances levels and Possible Wedge pattern formation to indicate price breaking of Rising Wedge (signal SELL) or price breaking of falling Wedge (signal BUY) Very simple and smart indicator  ALERTS AND MOBILE NOTIFICATIONS availavle !!! you can edit the calculation bars of the bars count for formation of the trend lines and the initial shift from current price  Smaller values for bars /shift inputs when using Higher Time frames (D1-H4) and the reverse
YK-Fibo Pivot Indicator: Trade Smarter with Fibonacci Pivot Points The YK-Fibo Pivot Indicator is a powerful technical analysis tool that combines the precision of Fibonacci retracements with the insights of Pivot Points. Whether you're a novice or seasoned trader, this indicator empowers you to spot profitable opportunities in the market with ease. Why Choose YK-Fibo Pivot? Pinpoint Support & Resistance: By calculating Fibonacci levels based on the previous day's high, low, and close prices, y
Fibonacci retracement and extension line drawing tool Fibonacci retracement and extended line drawing tool for MT4 platform is suitable for traders who use  golden section trading Advantages: There is no extra line, no too long line, and it is easy to observe and find trading opportunities Trial version: https://www.mql5.com/zh/market/product/35884 Main functions: 1. Multiple groups of Fibonacci turns can be drawn directly, and the relationship between important turning points
Cosmic Diviner X Planet
Olena Kondratenko
4 (2)
This unique multi-currency strategy simultaneously determines the strength of trends and market entry points, visualizing this using histograms on the chart. The indicator is optimally adapted for trading on the timeframes М5, М15, М30, Н1. For the convenience of users, the indicator renders the entry point (in the form of an arrow), recommended take profit levels (TP1, TP2 with text labels) and the recommended Stop Loss level. The take profit levels (TP1, TP2) are automatically calculated for
Blahtech Market Profile
Blahtech Limited
4.56 (16)
Was: $249  Now: $99   Market Profile defines a number of day types that can help the trader to determine market behaviour. A key feature is the Value Area, representing the range of price action where 70% of trading took place. Understanding the Value Area can give traders valuable insight into market direction and establish the higher odds trade. It is an excellent addition to any system you may be using. Blahtech Limited presents their Market Profile indicator for the MetaTrader community. Ins
Fibonacci SR Indicator
Martin Eshleman
3 (2)
Fibonacci SR Indicator This indicator creates support and resistance lines. This indicator is based on Fibonacci Retracement and Extension levels. It will consider many combinations of the Fibonacci levels and draw support/resistance lines based on these. This indicator uses tops and bottoms drawn by the ZigZag indicator in its calculations. The ZigZag can also be drawn on the chart, if necessary. The indicator considers many combinations of past reversal points and Fibonacci ratio levels, and
FREE
Super Reversal Pattern
Parfait Mujinga Ndalika
Super Reversal Pattern Indicator Unlock the power of advanced pattern recognition with our Super Reversal Pattern Indicator. Designed for traders seeking precision and reliability, this indicator identifies one of the most effective reversal patterns in technical analysis, offering a significant edge in your trading strategy. Key Features: Non-Repainting Accuracy: Enjoy the confidence of non-repainting technology. Once a Super Reversal Pattern is detected, it remains static, providing consis
The Penta-O is a 6-point retracement harmonacci pattern which usually precedes big market movements. Penta-O patterns can expand and repaint quite a bit. To make things easier this indicator implements a twist: it waits for a donchian breakout in the right direction before signaling the trade. The end result is an otherwise repainting indicator with a very reliable trading signal. The donchian breakout period is entered as an input. [ Installation Guide | Update Guide | Troubleshooting | FAQ | A
Free automatic Fibonacci is an indicator that automatically plots a Fibonacci retracement based on the number of bars you select on the BarsToScan setting in the indicator. The Fibonacci is automatically updated in real time as new highest and lowest values appears amongst the selected bars. You can select which level values to be displayed in the indicator settings. You can also select the color of the levels thus enabling the trader to be able to attach the indicator several times with differe
FREE
Volume by Price MT4
Brian Collard
4.64 (11)
The Volume by Price Indicator for MetaTrader 4 features Volume Profile and Market Profile TPO (Time Price Opportunity). Volume and TPO histogram bar and line charts. Volume Footprint charts. TPO letter and block marker collapsed and split structure charts. Static, dynamic and flexible range segmentation and compositing methods with relative and absolute visualizations. Session hours filtering and segment concatenation with Market Watch and custom user specifications. Graphical layering, positio
DMS Fibo
Diogo Mitsunaga Dos Santos
Fibonacci retracements are trend lines drawn between two significant points, usually between absolute lows and absolute highs, plotted on a chart. Intersecting horizontal lines are placed at the Fibonacci levels. Fibonacci retracements are useful tools that help traders identify support and resistance levels. With the information gathered, they can place orders, identify stop-loss levels, and set price targets. Although useful, traders often use other indicators to make more accurate assessments
This is a new strategy for SUPPLY DEMAND areas It is based on a calculation using the tick volume to detect the big price action in market for both bear /bull actions this smart volume action candles are used to determine the supply and demand areas prices in between main supply and demand lines indicate sideway market  up arrows will be shown when prices moves above the main supply and the secondary supply lines Down arrows will be shown when prices moves below the main demand and the secondary
Master Scalping M1 è un indicatore innovativo che utilizza un algoritmo per determinare il trend in modo rapido e preciso. L'indicatore calcola il tempo di apertura e chiusura delle posizioni, gli algoritmi dell'indicatore consentono di trovare i momenti ideali per entrare in un trade (acquistare o vendere un asset), il che aumenta il successo delle transazioni per la maggior parte dei trader. Vantaggi dell'indicatore: Facile da usare, non sovraccarica il grafico con informazioni inutili. Può es
Trend Ray
Andriy Sydoruk
The indicator shows the potential trend direction by cyclical-wave dependence. Thus, all the rays of the intersection will be optimal rays, in the direction of which the price is expected to move, taking into account the indicator period. Rays can be used as a direction for potential market movement. But we must not forget that the approach must be comprehensive, the indicator signals require additional information to enter the market.
Il nostro indicatore Basic Support and Resistance è la soluzione necessaria per aumentare l'analisi tecnica.Questo indicatore consente di proiettare i livelli di supporto e resistenza sul grafico/ MT5 gratuita Funzionalità Integrazione dei livelli di Fibonacci: Con la possibilità di visualizzare i livelli di Fibonacci insieme a livelli di supporto e resistenza, il nostro indicatore ti dà una visione ancora più profonda del comportamento del mercato e delle possibili aree di inversione. Ott
TWO PAIRS SQUARE HEDGE METER INDICATOR Try this brilliant 2 pairs square indicator It draws a square wave of the relation between your two inputs symbols when square wave indicates -1 then it is very great opportunity to SELL pair1 and BUY Pair2 when square wave indicates +1 then it is very great opportunity to BUY pair1 and SELL Pair2 the inputs are : 2 pairs of symbols         then index value : i use 20 for M30 charts ( you can try other values : 40/50 for M15 , : 30 for M30 , : 10 for H1 ,
Title : Market Bias Indicator - Oscillator-Based Trading Tool Introduction : Discover the potential of the "Market Bias Indicator," a revolutionary oscillator-based trading tool designed for precise market analysis. If you're in search of a robust alternative to traditional bias indicators, your quest ends here. Market Bias Indicator offers unparalleled accuracy in identifying market sentiment and is your gateway to confident trading decisions. Recommended Trading Pairs : Market Bias Indicator i
Infinity Trend Pro
Yaroslav Varankin
1 (1)
This is a trend indicator without redrawing Developed instead of the binary options strategy (by the color of the Martingale candlestick) Also works well in forex trading When to open trades (binary options) A signal will appear in the place with a candle signaling the current candle It is recommended to open a deal for one candle of the current timeframe M1 and M5 When a blue dot appears, open a deal up When a red dot appears, open a trade down. How to open trades on Forex. When a signal is rec
For sure, this indicator has become very popular amongst traders. Through coding this indicator will give you the most accurate levels possible for your trading analysis. We have also added in the ability for you to receive alerts when the price breaks above or below a Support or Resistance lines! HOW TO USE The red rectangles represent your resistance/supply zone. The green rectangles represent your support/demand zone.  BONUS FEATURES We coded this indicator with the ability to switch between
Indicator developed with precision algorithm that seeks moments of strong trend in the markets. Reconciled with an algorithm that seeks high volume moments in the market. I recommend using timeframes M15 to H1. I also recommend an optimization to your liking for your best currency pairs. Any questions, do not hesitate to ask. Buy EA based on this indicator CLICKING HERE This is an excellent trigger indicator for your trading system. If you already operate a trend and want an indicator to show y
Gli utenti di questo prodotto hanno anche acquistato
Gann Made Easy
Oleg Rodin
4.85 (82)
Gann Made Easy è un sistema di trading Forex professionale e facile da usare che si basa sui migliori principi del trading utilizzando la teoria di mr. WD Gann. L'indicatore fornisce segnali ACQUISTA e VENDI accurati, inclusi i livelli di Stop Loss e Take Profit. Puoi fare trading anche in movimento utilizzando le notifiche PUSH. Vi prego di contattarmi dopo l'acquisto! Condividerò i miei consigli di trading con te e fantastici indicatori bonus gratuitamente! Probabilmente hai già sentito parlar
- Real price is 80$ - 40% Discount ( It is 49$ now ) Contact me for instruction, add group and any questions! Related Product:  Bitcoin Expert Introduction The breakout and retest strategy is traded support and resistance levels. it involves price breaking through a previous level.  The break and retest strategy is designed to help traders do two main things, the first is to avoid false breakouts. Many false breakouts start with a candlestick that breaks out of a level but ends with an immediat
Atomic Analyst
Issam Kassas
5 (2)
Innanzitutto, vale la pena sottolineare che questo indicatore di trading non è repaint, non è ridisegno e non presenta ritardi, il che lo rende ideale sia per il trading manuale che per quello automatico. Manuale utente: impostazioni, input e strategia. L'Analista Atomico è un indicatore di azione del prezzo PA che utilizza la forza e il momentum del prezzo per trovare un miglior vantaggio sul mercato. Dotato di filtri avanzati che aiutano a rimuovere rumori e segnali falsi, e aumentare il pote
Enigmera
Ivan Stefanov
5 (3)
ENIGMERA: Il cuore del mercato https://www.enigmera.com Introduzione Questo indicatore e sistema di trading rappresenta un approccio straordinario ai mercati finanziari. ENIGMERA utilizza i cicli frattali per calcolare con precisione i livelli di supporto e resistenza. Mostra l'autentica fase di accumulazione e fornisce direzione e obiettivi.  Un sistema che funziona sia in un trend che in una correzione.  Come funziona? ENIGMERA è composto da tre linee: la linea di supporto/resistenza, la
Gold Stuff
Vasiliy Strukov
4.89 (239)
Gold Stuff è un indicatore di tendenza progettato specificamente per l'oro e può essere utilizzato anche su qualsiasi strumento finanziario. L'indicatore non ridisegna e non è in ritardo. Periodo consigliato H1. Su di esso l'indicatore funziona in modo completamente automatico Expert Advisor EA Gold Stuff. Lo trovi nel mio profilo. I risultati in tempo reale possono essere visualizzati qui.  Puoi ottenere una copia gratuita del nostro indicatore Strong Support e Trend Scanner, per favore scri
Trend Punch
Mohamed Hassan
4.95 (19)
This indicator is unstoppable when combined with our other indicator called  Support & Resistance . After purchase, send us a message and you will get it   for  FREE as a BONUS! Introducing Trend Punch , the revolutionary forex trend indicator that will transform the way you trade! Trend Punch is uniquely designed to provide precise buy and sell arrows during strong market trends, making your trading decisions clearer and more confident. Whether you're trading major currency pairs or exotic sym
Trend Screener
STE S.S.COMPANY
4.8 (87)
Indicatore di tendenza, soluzione unica rivoluzionaria per il trading di tendenze e il filtraggio con tutte le importanti funzionalità di tendenza integrate in un unico strumento! È un indicatore multi-timeframe e multi-valuta al 100% non ridipingibile che può essere utilizzato su tutti i simboli/strumenti: forex, materie prime, criptovalute, indici e azioni. OFFERTA A TEMPO LIMITATO: l'indicatore di screening di supporto e resistenza è disponibile a soli 50$ e a vita. (Prezzo originale 250$) (o
Scalper Inside PRO
Alexey Minkov
4.73 (56)
An exclusive indicator that utilizes an innovative algorithm to swiftly and accurately determine the market trend. The indicator automatically calculates opening, closing, and profit levels, providing detailed trading statistics. With these features, you can choose the most appropriate trading instrument for the current market conditions. Additionally, you can easily integrate your own arrow indicators into Scalper Inside Pro to quickly evaluate their statistics and profitability. Scalper Inside
TPSpro RFI Levels
Roman Podpora
4.82 (22)
ISTRUZIONI       RUS   -   INGLESE       Si   consiglia di utilizzare con un indicatore       -       TPSpro   TENDENZA PRO -   Versione MT4         Un elemento chiave nel trading sono le zone o i livelli da cui vengono prese le decisioni di acquisto o vendita di uno strumento di trading. Nonostante i tentativi dei principali attori di nascondere la loro presenza sul mercato, lasciano inevitabilmente delle tracce. Il nostro compito era imparare a identificare queste tracce e interpretarle corre
Dynamic Forex28 Navigator - Lo strumento di trading Forex di nuova generazione. ATTUALMENTE SCONTATO DEL 49%. Dynamic Forex28 Navigator è l'evoluzione dei nostri indicatori popolari di lunga data, che combinano la potenza di tre in uno: Advanced Currency Strength28 Indicator (695 recensioni) + Advanced Currency IMPULSE con ALERT (520 recensioni) + CS28 Combo Signals (Bonus). Dettagli sull'indicatore https://www.mql5.com/en/blogs/post/758844 Cosa offre l'indicatore di forza di nuova generazion
TPSproTREND PrO
Roman Podpora
4.79 (19)
TPSpro TREND PRO   è un indicatore di tendenza che analizza automaticamente il mercato, fornisce informazioni sulla tendenza e sui rispettivi cambiamenti e fornisce segnali per entrare nelle operazioni senza ridisegnare. L'indicatore utilizza ciascuna candela e la analizza separatamente. Si riferisce a vari shock al rialzo o al ribasso. Punto di ingresso preciso per il trading di valute, criptovalute, metalli, azioni e indici! Versione MT5                   Descrizione completa dell'indicatore
FX Power MT4 NG
Daniel Stein
5 (12)
Ricevi il tuo aggiornamento quotidiano sul mercato con dettagli e schermate tramite il nostro Morning Briefing qui su mql5 e su Telegram ! FX Power MT4 NG è la nuova generazione del nostro popolare misuratore di forza delle valute, FX Power. Cosa offre questo misuratore di forza di nuova generazione? Tutto ciò che avete amato dell'FX Power originale IN PIÙ Analisi della forza di ORO/XAU Risultati di calcolo ancora più precisi Periodi di analisi configurabili individualmente Limite di calcolo pe
Attualmente 20% di sconto! La soluzione migliore per ogni principiante o trader esperto! Questo software per cruscotti funziona su 28 coppie di valute. Si basa su 2 dei nostri indicatori principali (Advanced Currency Strength 28 e Advanced Currency Impulse). Offre un'ottima panoramica dell'intero mercato Forex. Mostra i valori di forza delle valute avanzate, la velocità di movimento delle valute e i segnali per 28 coppie Forex in tutti i (9) timeframe. Immaginate come migliorerà il vostro t
MetaBands M4
Vahidreza Heidar Gholami
5 (2)
MetaBands uses powerful and unique algorithms to draw channels and detect trends so that it can provide traders with potential points for entering and exiting trades. It’s a channel indicator plus a powerful trend indicator. It includes different types of channels which can be merged to create new channels simply by using the input parameters. MetaBands uses all types of alerts to notify users about market events. Features Supports most of the channel algorithms Powerful trend detection algorith
TrendMaestro
Stefano Frisetti
5 (3)
nota: questo indicatore e' per METATRADER4, se vuoi la versione per  METATRADER5 questo e' il link:  https://www.mql5.com/it/market/product/108123 TRENDMAESTRO ver 2.4 TRENDMAESTRO riconosce un nuovo TREND sul nascere, non sbaglia mai. La sicurezza di identificare un nuovo TREND non ha prezzo. DESCRIZIONE TRENDMAESTRO identifica un nuovo TREND sul nascere, questo indicatore prende in esame la volatilita' i volumi ed il momentum per identificare il momento in cui c'e' un'esplosione di uno 
Stratos Pali
Michela Russo
5 (1)
Stratos Pali Indicator   is a revolutionary tool designed to enhance your trading strategy by accurately identifying market trends. This sophisticated indicator uses a unique algorithm to generate a complete histogram, which records when the trend is Long or Short. When a trend reversal occurs, an arrow appears, indicating the new direction of the trend. Important Information Revealed Leave a review and contact me via mql5 message to receive My Top 5 set files for Stratos Pali at no cost! D
Innanzitutto, vale la pena sottolineare che questo Strumento di Trading è un Indicatore Non-Ridipingente, Non-Ridisegnante e Non-Laggante, il che lo rende ideale per il trading professionale. Corso online, manuale utente e demo. L'Indicatore Smart Price Action Concepts è uno strumento molto potente sia per i nuovi che per i trader esperti. Racchiude più di 20 utili indicatori in uno solo, combinando idee di trading avanzate come l'Analisi del Trader del Circolo Interno e le Strategie di Trading
Scalper Vault
Oleg Rodin
5 (27)
Scalper Vault è un sistema di scalping professionale che ti fornisce tutto il necessario per scalping di successo. Questo indicatore è un sistema di trading completo che può essere utilizzato dai trader di forex e opzioni binarie. L'intervallo di tempo consigliato è M5. Il sistema fornisce segnali di freccia accurati nella direzione della tendenza. Ti fornisce anche i segnali più alti e più bassi e i livelli di mercato di Gann. Gli indicatori forniscono tutti i tipi di avvisi, comprese le notifi
ATTUALMENTE SCONTATO DEL 31%! La soluzione migliore per ogni principiante o trader esperto! Questo indicatore è uno strumento di trading unico, di alta qualità e conveniente perché abbiamo incorporato una serie di caratteristiche proprietarie e una formula segreta. Con un solo grafico fornisce avvisi per tutte le 28 coppie di valute. Immaginate come migliorerà il vostro trading perché sarete in grado di individuare l'esatto punto di innesco di una nuova tendenza o opportunità di scalping!
Matrix Arrow Indicator MT4
Juvenille Emperor Limited
5 (3)
Matrix Arrow Indicator MT4 è un trend unico 10 in 1 che segue un indicatore multi-timeframe al 100% non ridipinto che può essere utilizzato su tutti i simboli/strumenti: forex, materie prime, criptovalute, indici, azioni.  Matrix Arrow Indicator MT4 determinerà la tendenza attuale nelle sue fasi iniziali, raccogliendo informazioni e dati da un massimo di 10 indicatori standard, che sono: Indice di movimento direzionale medio (ADX) Indice del canale delle materie prime (CCI) Candele classiche He
Ultimate Gold Advisor per MetaTrader 4 – Il Tuo Strumento di Trading All’Avanguardia per il Successo Garantito! L’ Ultimate Gold Advisor è molto più di un semplice indicatore: è il gioiello tecnologico che rivoluzionerà il tuo approccio al trading su MetaTrader 4. Progettato per soddisfare le esigenze dei trader più esigenti, questo indicatore all’avanguardia combina precisione chirurgica, analisi sofisticata e funzionalità potenti per offrirti un vantaggio competitivo imbattibile sui mercati. I
Currency Strength Wizard è un indicatore molto potente che ti fornisce una soluzione all-in-one per un trading di successo. L'indicatore calcola la potenza di questa o quella coppia forex utilizzando i dati di tutte le valute su più intervalli di tempo. Questi dati sono rappresentati in una forma di indice di valuta facile da usare e linee elettriche di valuta che puoi utilizzare per vedere il potere di questa o quella valuta. Tutto ciò di cui hai bisogno è collegare l'indicatore al grafico che
FX Volume
Daniel Stein
4.58 (33)
Ricevi il tuo aggiornamento quotidiano sul mercato con dettagli e schermate tramite il nostro Morning Briefing qui su mql5 e su Telegram ! FX Volume è il PRIMO e UNICO indicatore di volume che fornisce una visione REALE del sentiment del mercato dal punto di vista del broker. Fornisce informazioni straordinarie su come gli operatori di mercato istituzionali, come i broker, sono posizionati sul mercato Forex, molto più velocemente dei rapporti COT. Vedere queste informazioni direttamente sul vo
Entry Points Pro
Yury Orlov
4.62 (175)
Indicatore top per MT5 che fornisce segnali accurati per entrare in un trade senza riverniciare! Può essere applicato a qualsiasi attività finanziaria: forex, criptovalute, metalli, azioni, indici.  La versione MT5 è qui Fornirà segnali di trading piuttosto precisi e ti dirà quando è meglio aprire un trade e chiuderlo. Guarda il video (6:22) con un esempio di elaborazione di un solo segnale che ha ripagato l'indicatore! La maggior parte dei trader migliora i propri risultati di trading
Quantum Breakout Indicator PRO
Bogdan Ion Puscasu
4.96 (25)
Presentazione       Quantum Breakout PRO   , l'innovativo indicatore MQL5 che sta trasformando il modo in cui scambi le zone di breakout! Sviluppato da un team di trader esperti con un'esperienza di trading di oltre 13 anni,   Quantum Breakout PRO   è progettato per spingere il tuo viaggio di trading a nuovi livelli con la sua strategia innovativa e dinamica della zona di breakout. Quantum Breakout Indicator ti fornirà frecce di segnalazione sulle zone di breakout con 5 zone target di prof
ATTUALMENTE SCONTATO DEL 26% La soluzione migliore per ogni principiante o trader esperto! Questo indicatore è uno strumento di trading unico, di alta qualità e conveniente perché abbiamo incorporato una serie di caratteristiche proprietarie e una nuova formula. Con un solo grafico è possibile leggere la forza delle valute per 28 coppie Forex! Immaginate come migliorerà il vostro trading perché sarete in grado di individuare l'esatto punto di innesco di una nuova tendenza o di un'opportunit
Market Reversal Alerts
LEE SAMSON
4.19 (113)
Il profitto dalla struttura del mercato cambia quando il prezzo si inverte e si ritira. L'indicatore di avviso di inversione della struttura del mercato identifica quando una tendenza o un movimento di prezzo si sta avvicinando all'esaurimento e pronto a invertire. Ti avvisa dei cambiamenti nella struttura del mercato che in genere si verificano quando stanno per verificarsi un'inversione o un forte pullback. L'indicatore identifica inizialmente i breakout e lo slancio del prezzo, ogni volta
IX Power MT4
Daniel Stein
5 (5)
IX Power porta finalmente l'imbattibile precisione di FX Power ai simboli non-Forex. Determina con precisione l'intensità delle tendenze a breve, medio e lungo termine dei vostri indici preferiti, azioni, materie prime, ETF e persino criptovalute. Potete analizzare tutto ciò che il vostro terminale ha da offrire. Provatelo e sperimentate come il vostro tempismo migliori significativamente durante il trading. Caratteristiche principali di IX Power Risultati di calcolo precisi al 100% e n
PowerBall Signals è un indicatore di segnali ACQUISTA/VENDI basato sull'idea di utilizzare zone di supporto/resistenza. L'indicatore rileva speciali modelli di inversione basati su zone di supporto/resistenza e fornisce questi segnali sul grafico. L'idea principale dell'indicatore è utilizzare l'analisi MTF (Multi Time Frame) e fornire segnali basati sui livelli dell'intervallo di tempo corrente e successivo. Questo metodo consente di prevedere possibili inversioni di prezzo su qualsiasi mercato
Lascia un commento dopo l'acquisto per ricevere 4 indicatori di alta qualità come bonus. L'indicatore Chart Patterns All-in-One aiuta i trader a visualizzare vari modelli di grafici comunemente utilizzati nell'analisi tecnica. Questo indicatore supporta l'identificazione dei possibili comportamenti del mercato, ma non garantisce la redditività. Si consiglia di testare l'indicatore in modalità demo prima dell'acquisto. Offerta attuale : 50% di sconto sull'indicatore "Chart Patterns All in One". M
Altri dall’autore
PZ Swing Trading MT5
PZ TRADING SLU
5 (4)
Protect against whipsaws: revolutionize your swing trading approach Special Offer: Purchase now to receive free bonuses worth $135! (Read more for details) Swing Trading is the first indicator designed to detect swings in the direction of the trend and possible reversal swings. It uses the baseline swing trading approach, widely described in trading literature. The indicator studies several price and time vectors to track the aggregate trend direction and detects situations in which the market i
Trade smarter, not harder: Empower your trading with Harmonacci Patterns Special Offer: Purchase now to receive free bonuses worth $165! (Read more for details) This is arguably the most complete harmonic price formation auto-recognition indicator you can find for the MetaTrader Platform. It detects 19 different patterns, takes fibonacci projections as seriously as you do, displays the Potential Reversal Zone (PRZ) and finds suitable stop-loss and take-profit levels. [ Installation Guide | Up
PZ Support Resistance MT5
PZ TRADING SLU
4.17 (6)
Unlock key market insights with automated support and resistance lines Special Offer: Purchase now to receive free bonuses worth $75! (Read more for details) Tired of plotting support and resistance lines? This is a multi-timeframe indicator that detects and plots supports and resistance lines in the chart with the same precision as a human eye would. As price levels are tested over time and its importance increases, the lines become thicker and darker, making price leves easy to glance and ev
PZ Day Trading
PZ TRADING SLU
3.67 (3)
Effortless trading: non-repainting indicator for accurate price reversals Special Offer: Purchase now to receive free bonuses worth $90! (Read more for details) This indicator detects price reversals in a zig-zag fashion, using only price action analysis and a donchian channel. It has been specifically designed for short-term trading, without repainting or backpainting at all. It is a fantastic tool for shrewd traders aiming to increase the timing of their operations. [ Installation Guide | Upd
PZ Goldfinch Scalper EA
PZ TRADING SLU
1 (4)
This is the latest iteration of my famous scalper, Goldfinch EA, published for the first time almost a decade ago. It scalps the market on sudden volatility expansions that take place in short periods of time: it assumes and tries to capitalize of inertia in price movement after a sudden price acceleration. This new version has been simplified to allow the trader use the optimization feature of the tester easily to find the best trading parameters. [ Installation Guide | Update Guide | Troublesh
PZ Day Trading MT5
PZ TRADING SLU
2.83 (6)
Effortless trading: non-repainting indicator for accurate price reversals Special Offer: Purchase now to receive free bonuses worth $60! (Read more for details) This indicator detects price reversals in a zig-zag fashion, using only price action analysis and a donchian channel. It has been specifically designed for short-term trading, without repainting or backpainting at all. It is a fantastic tool for shrewd traders aiming to increase the timing of their operations. [ Installation Guide | Upd
Precision trading: leverage wolfe waves for accurate signals Special Offer: Purchase now to receive free bonuses worth $109! (Read more for details) Wolfe Waves are naturally occurring trading patterns present in all financial markets and represent a fight towards an equilibrium price. These patterns can develop over short and long-term time frames and are one of the most reliable predictive reversal patterns in existence, normally preceding strong and long price movements. [ Installation Guide
Identify over 30 candlestick patterns with precision Special Offer: Purchase now to receive free bonuses worth $60! (Read more for details) This indicator recognizes over 30 Japanese Candlestick Patterns and highlights them beautifully on the chart. It is simply one of those indicators price action traders can't live without.  [ Installation Guide | Update Guide | Troubleshooting | FAQ | All Products ] Boost your technical analysis overnight Detect japanese candlestick patterns easily Trade
PZ Trend Trading
PZ TRADING SLU
4.8 (5)
Capture every opportunity: your go-to indicator for profitable trend trading Special Offer: Purchase now to receive free bonuses worth $109! (Read more for details) Trend Trading is an indicator designed to profit as much as possible from trends taking place in the market, by timing pullbacks and breakouts. It finds trading opportunities by analyzing what the price is doing during established trends. [ Installation Guide | Update Guide | Troubleshooting | FAQ | All Products ] Trade financial
PZ Trend Trading MT5
PZ TRADING SLU
3.67 (3)
Capture every opportunity: your go-to indicator for profitable trend trading Special Offer: Purchase now to receive free bonuses worth $109! (Read more for details) Trend Trading is an indicator designed to profit as much as possible from trends taking place in the market, by timing pullbacks and breakouts. It finds trading opportunities by analyzing what the price is doing during established trends. [ Installation Guide | Update Guide | Troubleshooting | FAQ | All Products ] Trade financial
PZ Turtle Trading EA MT5
PZ TRADING SLU
2 (4)
This expert advisor implements the original Dennis and Eckhardt trading system, commonly known as The Turtle Trader. It trades exactly like the original turtles did, and can be used by experienced traders to capture trends in up or down markets. [ Installation Guide | Update Guide | Troubleshooting | FAQ | All Products ] Easy to use and supervise Fully configurable strategy settings Fully configurable trading settings Works for ECN/Non-ECN brokers and 2-3-4-5 digit symbols Works for CFDs and for
PZ Swing Trading
PZ TRADING SLU
5 (3)
Protect against whipsaws: revolutionize your swing trading approach Special Offer: Purchase now to receive free bonuses worth $135! (Read more for details) Swing Trading is the first indicator designed to detect swings in the direction of the trend and possible reversal swings. It uses the baseline swing trading approach, widely described in trading literature. The indicator studies several price and time vectors to track the aggregate trend direction and detects situations in which the market i
Do you like scalping? Th is indicator displays information about the latest price quotes received from the broker. [ Installation Guide | Update Guide | Troubleshooting | FAQ | All Products ] Identify tick trends easily A blue row means the price has increased A red row means the price has decreased Customizable colors and font sizes Display your desired amount of rows The indicator is non-repainting Parameters Rows: amount of rows with data to display in the chart Font size: font size of th
This expert advisor implements the original Dennis and Eckhardt trading system, commonly known as The Turtle Trader. It trades exactly like the original turtles did, and can be used by experienced traders to capture trends in up or down markets. [ Installation Guide | Update Guide | Troubleshooting | FAQ | All Products ] Easy to use and supervise Fully configurable strategy settings Fully configurable trading settings Works for ECN/Non-ECN brokers and 2-3-4-5 digit symbols Works for CFDs and for
PZ Support Resistance
PZ TRADING SLU
3.33 (3)
Unlock key market insights with automated support and resistance lines Special Offer: Purchase now to receive free bonuses worth $75! (Read more for details) Tired of plotting support and resistance lines? This is a multi-timeframe indicator that detects and plots supports and resistance lines in the chart with the same precision as a human eye would. As price levels are tested over time and its importance increases, the lines become thicker and darker, making price leves easy to glance and ev
PZ Wolfe Waves
PZ TRADING SLU
1 (1)
Precision trading: leverage wolfe waves for accurate signals Special Offer: Purchase now to receive free bonuses worth $109! (Read more for details) Wolfe Waves are naturally occurring trading patterns present in all financial markets and represent a fight towards an equilibrium price. These patterns can develop over short and long-term time frames and are one of the most reliable predictive reversal patterns in existence, normally preceding strong and long price movements. [ Installation Guide
Identify over 30 candlestick patterns with precision Special Offer: Purchase now to receive free bonuses worth $60! (Read more for details) This indicator recognizes over 30 Japanese Candlestick Patterns and highlights them beautifully on the chart. It is simply one of those indicators price action traders can't live without. [ Installation Guide | Update Guide | Troubleshooting | FAQ | All Products ] Boost your technical analysis overnight Detect japanese candlestick patterns easily Trade r
PZ Harmonacci Patterns
PZ TRADING SLU
3.17 (6)
Trade smarter, not harder: Empower your trading with Harmonacci Patterns Special Offer: Purchase now to receive free bonuses worth $165! (Read more for details) This is arguably the most complete harmonic price formation auto-recognition indicator you can find for the MetaTrader Platform. It detects 19 different patterns, takes fibonacci projections as seriously as you do, displays the Potential Reversal Zone (PRZ) and finds suitable stop-loss and take-profit levels. [ Installation Guide | Upda
This is a smooth and responsive accelerometer which reveals the market trend and strength. [ Installation Guide | Update Guide | Troubleshooting | FAQ | All Products ] Two moving averages indicate trend direction The histogram represents strength of the price movement It draws buy and sell zones as colored vertical lines Should be used as a confirmation indicator Customizable line widths and colors It implements alerts of all kinds This indicator is similar to MACD but aims to react faster t
PZ Turtle Trading
PZ TRADING SLU
5 (3)
The Turtle Trading Indicator implements the original Dennis Richards and Bill Eckhart trading system, commonly known as The Turtle Trader. This trend following system relies on breakouts of historical highs and lows to take and close trades: it is the complete opposite to the "buy low and sell high" approach. The main rule is "Trade an N-day breakout and take profits when an M-day high or low is breached (N must me above M)". [ Installation Guide | Update Guide | Troubleshooting | FAQ | All Prod
This indicator analyzes price action patterns and helps you to make positive equity decisions in the binary options market. [ Installation Guide | Update Guide | Troubleshooting | FAQ | All Products ] Easy to trade Trade both call and put options No crystal ball and no predictions The indicator is non-repainting The only strategy suitable for binary options is applying a mathematical approach, like professional gamblers do. It is based on the following principles: Every binary option represents
Transform your trading approach with reliable bullish and bearish patterns This indicator evaluates volatility and price directionality simultaneously, which finds the following events. Decisive and sudden price movements Large hammers/shooting stars patterns Strong breakouts backed by most market participants Indecisive but volatile market situations It is an extremely easy to use indicator... The blue histogram represents the bullish impulse The red histogram represents the bearish impulse The
This indicator evaluates the market sentiment using raw price action measurements, and it is an amazing trading confirmation. It can be used to take a trend-trade approach or a contrarian approach using reversal patterns. [ Installation Guide | Update Guide | Troubleshooting | FAQ | All Products ] Find early reversals Confirm short-term trades Detect indecision on the market Take contrarian trades near support and resistance levels Trade inside bars confirmed by overall direction of the market T
PZ ABCD Retracement
PZ TRADING SLU
4 (5)
Identify precise entry and exit points with AB=CD patterns This indicator finds AB=CD retracement patterns. The AB=CD Retracement pattern is a 4-point price structure where the initial price segment is partially retraced and followed by an equidistant move from the completion of the pullback, and is the basic foundation for all harmonic patterns. [ Installation Guide | Update Guide | Troubleshooting | FAQ | All Products ] Customizable pattern sizes Customizable AC and BD ratios Customizabl
PZ Supply Demand
PZ TRADING SLU
3 (2)
Stay ahead of the market: predict buying and selling pressure with ease This indicator analyzes past price action to anticipate buying and selling pressure in the market: it does so by looking back into the past and analyzing price peaks and valleys around the current price. It is a state-of-the-art confirmation indicator. [ Installation Guide | Update Guide | Troubleshooting | FAQ | All Products ] Predict buying and selling pressure in the market Avoid getting caught in buying selling frenzies
PZ Correlation
PZ TRADING SLU
5 (1)
In the world of finance, correlation is a statistical measure of how two securities move in relation to each other. Correlations are used in advanced portfolio management. This indicator measures how different securities move in relation to a reference one, thus making portfolio management easier.  [ Installation Guide | Update Guide | Troubleshooting | FAQ | All Products ] Avoid concurrent trades in highly correlated instruments Find trading opportunities among highly correlated instruments Cor
PZ Risk Management
PZ TRADING SLU
5 (1)
This indicator monitors the vital constants of your trading account to keep it healthy and away from excessive risks. It monitors all trades, absolute exposure, account floating point and leverage currently in use, using different color codes for your interpretation.  [ Installation Guide | Update Guide | Troubleshooting | FAQ | All Products ] Amazingly easy to understand The indicator is clean and simple It calculates exposure by pairs and currencies Keep your used leverage controlled at all ti
Tired of plotting trendlines? The PZ TrendLines indicator applies a mechanical approach to the construction of trend lines for you! [ Installation Guide | Update Guide | Troubleshooting | FAQ | All Products ] It can draw up to 18 trendlines Trendlines can be optionally based on fractals Each line represents a breakout level Each trendline can be broken or rejected Configurable amount of lines Configurable colors Author Arturo López Pérez, private investor and speculator, software engineer an
This indicator displays pivot points in the chart, including historical vales, and supports many calculation modes for Pivot Points and S/R levels. [ Installation Guide | Update Guide | Troubleshooting | FAQ | All Products ] It plots historical levels for backtesting purposes It allows you to select the reference timeframe It implements different Pivot Point calculation modes It implements different SR calculation modes It implements customizable colors and sizes Calculation Modes The indic
Filtro:
sandrosilva1
19
sandrosilva1 2021.07.13 21:53 
 

L'utente non ha lasciato alcun commento sulla valutazione.

ThaiTrader7
154
ThaiTrader7 2014.08.23 20:19 
 

L'utente non ha lasciato alcun commento sulla valutazione.

Ramil Minniakhmetov
225806
Ramil Minniakhmetov 2014.05.20 20:29 
 

L'utente non ha lasciato alcun commento sulla valutazione.

Vadim Strelkov
7710
Vadim Strelkov 2014.05.06 15:15 
 

L'utente non ha lasciato alcun commento sulla valutazione.

Rispondi alla recensione
Versione 3.0 2019.08.10
- Bug fixes and redrawing