• Panoramica
  • Recensioni
  • Commenti (2)
  • Novità

All inOne

Features

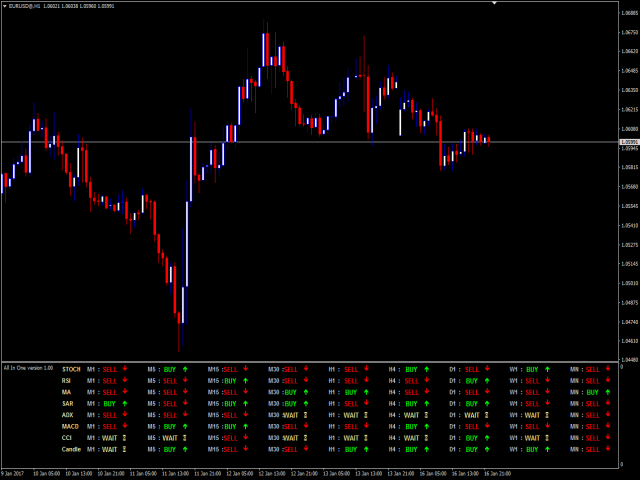
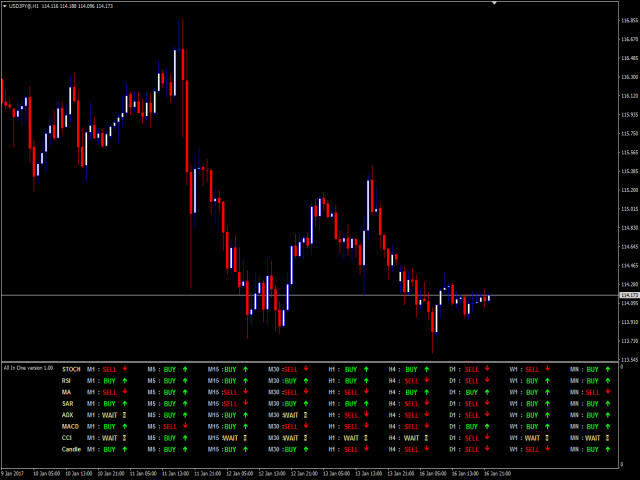
All in One indicator is a simple indicator. It makes you know about eight indicators in all timeframes at just one view in the same time.

  • Stochastic
  • RSI
  • Moving Average (MA)
  • Parabolic SAR
  • ADX
  • MACD
  • CCI
  • Last Candle (Candle)

in all timeframes (M1, M5, M15, M30, H1, H4, D1, MN) in the same time.
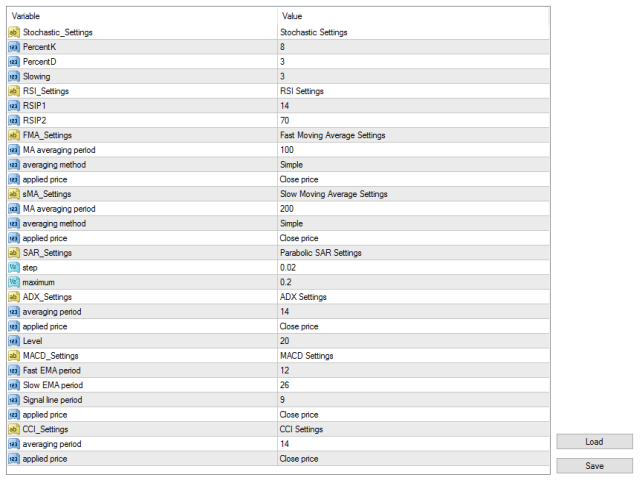

Parameters

Stochastic

  • PercentK: period of the %K line.
  • PercentD: period of the %D line.
  • Slowing: slowing value.

RSI

  • RSIP1: period 1
  • RSIP2: period 2

Fast Moving Average

  • MA averaging period: averaging period for calculation.
  • Averaging method: Moving Average method (Simple, Exponential, Smoothed, Linear Weighted).
  • Applied price: applied price (Close, Open, High, Low, Median, Typical, Weighted).

Slow Moving Average

  • MA averaging period: averaging period for calculation.
  • Averaging method: Moving Average method (Simple, Exponential, Smoothed, Linear Weighted).
  • Applied price: applied price (Close, Open, High, Low, Median, Typical, Weighted).

Parabolic SAR

  • Step: price increment step - acceleration factor.
  • Maximum: maximum step value.

ADX

  • Averaging period: averaging period for calculation.
  • Applied price: applied price (Close, Open, High, Low, Median, Typical, Weighted).

MACD

  • Fast EMA period: fast EMA averaging period.
  • Slow EMA period: slow EMA averaging period.
  • Signal line period: signal line averaging period.
  • Applied price: applied price (Close, Open, High, Low, Median, Typical, Weighted).

CCI

  • Averaging period: averaging period for calculation.
  • Applied price: applied price (Close, Open, High, Low, Median, Typical, Weighted).
Prodotti consigliati
Zig Zag reading structure
Maria Cristina Sabatini
'Zig Zag Percentage strenght'   This indicator is awesome. Why? It's able to show the percentage of the last leg, compared with the previous leg. In this way you have a better understanding of the forces in play in that moment.   In fact, for example, if you see that the up extensions are, in percentage, greater of the down legs, that means that there is more bullish pressure or maybe the market is starting to reverse from downtrend to uptrend.   Hope you will ind it useful !
Real Trend Lines
Harun Celik
5 (2)
Real Trend Lines is an indicator that calculates trends using a set of channels and using a set of algorithms. This indicator helps to find trend return points. It generally represents an oscillator. This trend tracking system helps the investor to understand small or large trends and determines the direction according to it. Trending features Up trend Rule 1 - yellow trend line should be below zero level. Rule 2 - the yellow trend line should be in the green and orange channel. Rule 3 - the t
In the age of speed, everyone wants to gets what he/she wants quickly. Trading is all about gaining money, and scalping is a way of doing it in a short time. The "Scorpion Scalper Pro" has been named on the scorpion because of its speed. The indicator serves to provide signals for the M15 timeframe. It also sends Alerts (window alert, email alert, push notification alert) whenever a buy/sell signal occurs, and the alerts are customizable (they can be turned ON or OFF). Indicator inputs : - Buy
CyberZingFx Trend Reversal
Afsal Meerankutty
4.18 (17)
Indicator captures the trend reversals with no-repaint Buy and Sell Arrow signals. CyberZingFx Trend Reversal Indicator - your go-to solution for accurate and reliable trend reversal signals. With its  advanced trading strategy , the indicator offers you Buy and Sell Arrow signals that do not repaint, making it a reliable tool for catching Swing Highs and Swing Lows in any market and any time frame. Indicator works on  any market  and  any time frames . __________________________________________
This indicator is designed for M1 time-frame and shows: Sum of ticks when the price goes up (color Green -The major component of a candlestick = the body). Sum of points when the price goes up (color Green -The extension lines at the top of the candle). Sum of points when the price goes down (color Red -The major component of a candlestick = the body). Sum of points when the price goes down (color Red -The extension lines at the lower end of the candle). Keep in mind that Sum of Points will be g
Night ghost
Dmitriy Kashevich
Night Ghost - Indicatore a freccia per opzioni binarie. Questo è un assistente affidabile per te in futuro! - Nessun ridisegno sul grafico -Funziona alla grande su tutte le coppie di valute! -Precisione dell'indicatore fino al 90% (soprattutto di notte) -Non c'è bisogno di impostare per molto tempo (impostato perfettamente per le opzioni binarie) - Segnali non in ritardo - La comparsa di un segnale sulla candela corrente -Perfetto per il periodo M1 (non più!) - Colore della
This indicator allows you to determine the likelihood that the price will reach one or another level. Its algorithm is quite simple and is based on the use of statistical data on the price levels of a particular currency pair. Thanks to the collected historical data, it is possible to determine the extent to which the price will change during the current bar. Despite its simplicity, this indicator can provide invaluable assistance in trading. So, with its help it is possible to determine TakePr
Con questo strumento di trading puoi scansionare 15 mercati contemporaneamente. Presentazione del nuovo indicatore di trading 2024: ️ Dashboard Stocastico multi valuta e multi time frame. Ci sono almeno due ragioni per cui ho creato questo strumento di trading: Innanzitutto, sono stanco di osservare solo un mercato. In secondo luogo, non voglio perdere il momento di ingresso in un altro mercato. Ecco perché voglio conoscere contemporaneamente altre condizioni di mercato. Per questo
Fibonacci retracement and extension line drawing tool Fibonacci retracement and extended line drawing tool for MT4 platform is suitable for traders who use  golden section trading Advantages: There is no extra line, no too long line, and it is easy to observe and find trading opportunities Trial version: https://www.mql5.com/zh/market/product/35884 Main functions: 1. Multiple groups of Fibonacci turns can be drawn directly, and the relationship between important turning points
Forex Gump Dot is a ready-made mechanical trading system for the +10 pips strategy. This strategy has been actively discussed and developed on the Internet for several years. The essence of this strategy is to open trade operations during the day and fix the minimum profit on each trade operation. That is, scalp. Our development team decided to adapt the indicators of the Forex Gump family and release a new product that will best match the scalping trading strategy. This product is Forex Gump Do
GeoWprPro
Georgij Komarov
WPR by Profile, or WPR for Professionals Geo_WprPro is one of the well-known currency profile indicators. It simultaneously displays two WPR indicators with different parameters in the matrix form on all timeframes of multiple currency pairs forming the currency profile . As follows from the description, " WPR is a leading indicator that often goes ahead of the price chart. The oscillator frequently reaches extreme values before the price reversal as if anticipating that event: it almost always
Market Profile
Artem Titarenko
5 (1)
The "Market Profile" indicator displays the profiles and volumes of periods – weekly, daily, session (8-hour), 4-hour, hour, summary. The VAH/VAL price area is automatically highlighted by a dotted line for each profile (except for the summary). The indicator includes chroma Delta, which colors the profile areas. The areas of prevailing Buys is colored in green, that of Sells - in red. The intensity histogram features blue/red respectively. In the filter mode, the indicator displays the volume a
Strong Retracement Points Pro demo edition! SRP (Strong Retracement/Reversal Points) is a powerful and unique support and resistance indicator. It displays the closest important levels which we expect the price retracement/reversal! If all level are broken from one side, it recalculates and draws new support and resistance levels, so the levels might be valid for several days depending on the market! If you are still hesitating to start using this wonderful tool, you can check this link to see h
Rhino NW
Sergei Shishaev
Нестандартный индикатор определения текущего тренда. Альтернативный подход к определению текущей рыночной тенденции. В основе лежит уникальный алгоритм. Не используются   скользящие средние , осцилляторы , супер-тренды и прочие стандартные индикаторы. Для таймфреймов:   от M15 до D1 . Для стилей торговли:  интрадэй, свинг, долгосрок . Может стать готовой торговой стратегией совместно с любым канальным индикатором. Например таким, как индикатор   "Snake" . Внимание! Это индикатор, а не советни
Dollar Mint Indicator
David Mwaniki Mbugua
Dollar mint indicator is a special workmanship with years of experience in forex.   Dollar mint ea is a fully non repaint indicator optimised with price action data such that once it gives you a signal t . The indicator   can be used to trade anything on the mt4 with much ease. Benefits ; Fully non repaint Use in any timeframe Use in all the available tradable assets on mt4 Best to use on h4. It generates fully analysed buy and sell signals based on trend and also filters out retracement
This indicator finds Three Drives patterns. The Three Drives pattern is a 6-point reversal pattern characterised by a series of higher highs or lower lows that complete at a 127% or 161.8% Fibonacci extension. It signals that the market is exhausted and a reversal can happen. [ Installation Guide | Update Guide | Troubleshooting | FAQ | All Products ] Customizable pattern sizes Customizable colors and sizes Customizable breakout periods Customizable 1-2-3 and 0-A-B ratios It implements visua
Delta AG
Yurij Kozhevnikov
The difference between the arithmetic and geometric means at the specified range. Since the greater is the difference between the values, the greater the resulting figure is, actually the indicator shows volatility fluctuations. The arithmetic mean of a certain number of values ​​is the sum of the values ​​divided by their number. The geometric mean is the root of the power of the number of values ​​extracted from the product of these values. If all values ​​are equal, the arithmetic mean and th
Discover the power of precision and efficiency in your trading with the " Super Auto Fibonacci " MT4 indicator. This cutting-edge tool is meticulously designed to enhance your technical analysis, providing you with invaluable insights to make informed trading decisions. Key Features: Automated Fibonacci Analysis: Say goodbye to the hassle of manual Fibonacci retracement and extension drawing. "Super Auto Fibonacci" instantly identifies and plots Fibonacci levels on your MT4 chart, saving you tim
FREE
Snake NW
Sergei Shishaev
5 (1)
Канальный индикатор "Snake" . Отлично показывает точки входа и выхода. Не перерисовывает! Хорошо подойдет для стратегий с сетками (усреднения), стратегий с пирамидами (стратегий добора), обычной торговли по тренду, торговли на коррекции. Для любых типов инструментов:   валюты, нефть, металлы, криптовалюты. Для любых таймфреймов:   от M1 до D1 . Для любых стилей торговли:   скальпинг, интрадэй, свинг, долгосрок . Используйте в сочетании с трендовым индикатором, чтобы исключить риски вх
Daily Candle Predictor è un indicatore che prevede il prezzo di chiusura di una candela. L'indicatore è destinato principalmente all'uso sui grafici D1. Questo indicatore è adatto sia per il trading forex tradizionale che per il trading di opzioni binarie. L'indicatore può essere utilizzato come sistema di trading autonomo o può fungere da aggiunta al sistema di trading esistente. Questo indicatore analizza la candela corrente, calcolando alcuni fattori di forza all'interno del corpo della cande
TrendCompass is a powerful indicator for trading in the currency and cryptocurrency markets on the MetaTrader 4 platform. This innovative tool is designed to simplify analysis and decision-making in trading. The indicator combines various technical indicators and algorithms to provide accurate and timely trading signals. Key Features: Multilevel Strategy: TrendCompass is based on a comprehensive strategy that includes analyzing major trends, support and resistance levels, and various technical
MoveWave
Andriy Sydoruk
MoveWave - Moving waves are very handy indicators for determining pivot levels. Most Forex traders make decisions based on technical analysis. This type of analysis determines patterns and trends in the market. With the help of complex mathematical equations that are combined and made out in the form of this indicator, the trader will be able to more accurately determine the price reversal levels. Wave theory mathematically represents various behavioral models of the market. It is used as the ba
Calc Trend
Tatiana Savkevych
Calc Trend is a Forex trend indicator based on the familiar RSI, but there is one "but"! We display RSI indicator signals on a price function chart using a mathematical approach. As you know, the overbought and oversold zones that the standard RSI fixes are often broken by the price and the price goes the other way. This makes the standard indicator inapplicable for real work in its pure form. Also, for sure, each user has noticed that at any part of the history, it is possible to change the
Crosskalp1
Mikhail Bilan
Добрый День уважаемые трейдеры!  Вашему вниманию индикатор созданный и работающий на базе трендовика ADX,  для торговли на смене направления движения который учитывает коррекцию и даёт возможность на ней заработать.  Применяю этот индикатор для скальпинга. Рекомендую таймфреймы от 15 ти минутного(М15) до часового (Н1) периодов.  Красный кружок сигнал на продажу- Sell) Зелёный кружок  сигнал на покупку Buy) Чем меньше ваш таймфрейм тем меньше пунктов вы зарабатываете.   Важно выставлять стопы! !В
The Velocity of price change   ( VP ) indicator shows the average rate of price change at those characteristic time intervals where this rate was approximately constant. The robust algorithm used in VP   to smooth out the price from its random jumps, ensures the reliability of the indicator reading, which does not react to simple price volatility and its insignificant movements.             The indicator allows you to track trends and the moments of their reversals , during which t
Real Magic Trend
Muhammed Emin Ugur
This   Real Magic Trend   indicator is designed for signal trading. This indicator generates trend signals. It uses many algorithms and indicators to generate this signal. It tries to generate signals from the points with the highest trend potential. This indicator is a complete trading product. This indicator does not need any additional indicators. The indicator is never repainted. The point at which the signal is given does not change.      Features and Recommendations Time Frame
Weis Wave Indicator
Dhabaleswar Prasad Jena
This indicator is based on the Weis wave principle of wave volume. Below are few features of the indicator It draws the wave on the chart while the accumulated volume per wave in a different window at the bottom of the chart You can configure the turning point move It displays the accumulated volume (in thousands, eg for 15000 volume it will show 15) at the end of each wave You can also configure to show number of candles in the wave along with the wave volume The indicator calculates the distin
Rira VWAP Bands
Vitor Palmeira Abbehusen
VWAP Bands gives you the regular Volume-Weighted Average Price and also the deviation bands. Use this indicator to see the possible amount of market movement, find support and resistance lines, find good spots for entry and exit,  and the most important feature is to find possible pivot points. This indicator has been mathematically improved by Rira team. The calculation begins at the start of each trading day
Royal Dutch Skunk
Sayan Vandenhout
ROYAL DUTCH SKUNK USES THE TREND WAVE INDICATOR AND IT CAN IDENTIFY THE BEGINNING AND THE END OF A NEW WAVE TREND MOVEMENT. AS AN OSCILLATOR, THE INDICATOR IDENTIFIES THE OVERBOUGHT AND OVERSOLD ZONES. IT WORKS GREAT TO CATCH THE SHORT TERM PRICE REVERSALS AND USES A MARTINGALE STRATEGY TO CLOSE ALL TRADES IN PROFIT. USE DEFAULT SETTINGS ON H1 OR HIGHER TIME FRAME ON ANY PAIR FOR MORE ACCURATE TRADES WHY THIS EA : Smart entries calculated by 6 great strategies The EA can be run on even a $20000
LordAutoTrendLine
Igor Pereira Calil
LordAutoTrendLine is an indicator for MetaTrader that was developed with the intention of analyzing up and down trend lines in the financial market. Trend lines are used to calculate together with a Fibonnaci for example, the high and low of a currency pair. In the example of the H4 images, we can see a line crossing 1790 high and 1784 low, an example, if going below 1784 will mean selling, and very certainly according to the line, it can reach 1790 first without any much effort, ie , purch
Gli utenti di questo prodotto hanno anche acquistato
Gann Made Easy
Oleg Rodin
4.85 (82)
Gann Made Easy è un sistema di trading Forex professionale e facile da usare che si basa sui migliori principi del trading utilizzando la teoria di mr. WD Gann. L'indicatore fornisce segnali ACQUISTA e VENDI accurati, inclusi i livelli di Stop Loss e Take Profit. Puoi fare trading anche in movimento utilizzando le notifiche PUSH. Vi prego di contattarmi dopo l'acquisto! Condividerò i miei consigli di trading con te e fantastici indicatori bonus gratuitamente! Probabilmente hai già sentito parlar
Atomic Analyst
Issam Kassas
5 (2)
Innanzitutto, vale la pena sottolineare che questo indicatore di trading non è repaint, non è ridisegno e non presenta ritardi, il che lo rende ideale sia per il trading manuale che per quello automatico. Manuale utente: impostazioni, input e strategia. L'Analista Atomico è un indicatore di azione del prezzo PA che utilizza la forza e il momentum del prezzo per trovare un miglior vantaggio sul mercato. Dotato di filtri avanzati che aiutano a rimuovere rumori e segnali falsi, e aumentare il pote
- Real price is 80$ - 40% Discount ( It is 49$ now ) Contact me for instruction, add group and any questions! Related Product:  Bitcoin Expert , Gold Expert Introduction The breakout and retest strategy is traded support and resistance levels. it involves price breaking through a previous level.  The break and retest strategy is designed to help traders do two main things, the first is to avoid false breakouts. Many false breakouts start with a candlestick that breaks out of a level but ends wi
Enigmera
Ivan Stefanov
5 (3)
ENIGMERA: Il cuore del mercato https://www.enigmera.com Introduzione Questo indicatore e sistema di trading rappresenta un approccio straordinario ai mercati finanziari. ENIGMERA utilizza i cicli frattali per calcolare con precisione i livelli di supporto e resistenza. Mostra l'autentica fase di accumulazione e fornisce direzione e obiettivi.  Un sistema che funziona sia in un trend che in una correzione.  Come funziona? ENIGMERA è composto da tre linee: la linea di supporto/resistenza, la
Scalper Inside PRO
Alexey Minkov
4.73 (56)
An exclusive indicator that utilizes an innovative algorithm to swiftly and accurately determine the market trend. The indicator automatically calculates opening, closing, and profit levels, providing detailed trading statistics. With these features, you can choose the most appropriate trading instrument for the current market conditions. Additionally, you can easily integrate your own arrow indicators into Scalper Inside Pro to quickly evaluate their statistics and profitability. Scalper Inside
Trend Screener
STE S.S.COMPANY
4.8 (87)
Indicatore di tendenza, soluzione unica rivoluzionaria per il trading di tendenze e il filtraggio con tutte le importanti funzionalità di tendenza integrate in un unico strumento! È un indicatore multi-timeframe e multi-valuta al 100% non ridipingibile che può essere utilizzato su tutti i simboli/strumenti: forex, materie prime, criptovalute, indici e azioni. OFFERTA A TEMPO LIMITATO: l'indicatore di screening di supporto e resistenza è disponibile a soli 50$ e a vita. (Prezzo originale 250$) (o
Trend Punch
Mohamed Hassan
4.95 (19)
*Weekend sale of $40 ONLY! This indicator is unstoppable when combined with our other indicator called  Support & Resistance . After purchase, send us a message and you will get it   for  FREE as a BONUS! Introducing Trend Punch , the revolutionary forex trend indicator that will transform the way you trade! Trend Punch is uniquely designed to provide precise buy and sell arrows during strong market trends, making your trading decisions clearer and more confident. Whether you're trading majo
Dynamic Forex28 Navigator - Lo strumento di trading Forex di nuova generazione. ATTUALMENTE SCONTATO DEL 49%. Dynamic Forex28 Navigator è l'evoluzione dei nostri indicatori popolari di lunga data, che combinano la potenza di tre in uno: Advanced Currency Strength28 Indicator (695 recensioni) + Advanced Currency IMPULSE con ALERT (520 recensioni) + CS28 Combo Signals (Bonus). Dettagli sull'indicatore https://www.mql5.com/en/blogs/post/758844 Cosa offre l'indicatore di forza di nuova generazion
TPSpro RFI Levels
Roman Podpora
4.82 (22)
ISTRUZIONI       RUS   -   INGLESE       Si   consiglia di utilizzare con un indicatore       -       TPSpro   TENDENZA PRO -   Versione MT4         Un elemento chiave nel trading sono le zone o i livelli da cui vengono prese le decisioni di acquisto o vendita di uno strumento di trading. Nonostante i tentativi dei principali attori di nascondere la loro presenza sul mercato, lasciano inevitabilmente delle tracce. Il nostro compito era imparare a identificare queste tracce e interpretarle corre
TPSproTREND PrO
Roman Podpora
4.79 (19)
TPSpro TREND PRO   è un indicatore di tendenza che analizza automaticamente il mercato, fornisce informazioni sulla tendenza e sui rispettivi cambiamenti e fornisce segnali per entrare nelle operazioni senza ridisegnare. L'indicatore utilizza ciascuna candela e la analizza separatamente. Si riferisce a vari shock al rialzo o al ribasso. Punto di ingresso preciso per il trading di valute, criptovalute, metalli, azioni e indici! Versione MT5                   Descrizione completa dell'indicatore
Attualmente 20% di sconto! La soluzione migliore per ogni principiante o trader esperto! Questo software per cruscotti funziona su 28 coppie di valute. Si basa su 2 dei nostri indicatori principali (Advanced Currency Strength 28 e Advanced Currency Impulse). Offre un'ottima panoramica dell'intero mercato Forex. Mostra i valori di forza delle valute avanzate, la velocità di movimento delle valute e i segnali per 28 coppie Forex in tutti i (9) timeframe. Immaginate come migliorerà il vostro t
FX Power MT4 NG
Daniel Stein
5 (13)
Ricevi il tuo aggiornamento quotidiano sul mercato con dettagli e schermate tramite il nostro Morning Briefing qui su mql5 e su Telegram ! FX Power MT4 NG è la nuova generazione del nostro popolare misuratore di forza delle valute, FX Power. Cosa offre questo misuratore di forza di nuova generazione? Tutto ciò che avete amato dell'FX Power originale IN PIÙ Analisi della forza di ORO/XAU Risultati di calcolo ancora più precisi Periodi di analisi configurabili individualmente Limite di calcolo pe
TrendMaestro
Stefano Frisetti
5 (3)
nota: questo indicatore e' per METATRADER4, se vuoi la versione per  METATRADER5 questo e' il link:  https://www.mql5.com/it/market/product/108123 TRENDMAESTRO ver 2.4 TRENDMAESTRO riconosce un nuovo TREND sul nascere, non sbaglia mai. La sicurezza di identificare un nuovo TREND non ha prezzo. DESCRIZIONE TRENDMAESTRO identifica un nuovo TREND sul nascere, questo indicatore prende in esame la volatilita' i volumi ed il momentum per identificare il momento in cui c'e' un'esplosione di uno 
Innanzitutto, vale la pena sottolineare che questo Strumento di Trading è un Indicatore Non-Ridipingente, Non-Ridisegnante e Non-Laggante, il che lo rende ideale per il trading professionale. Corso online, manuale utente e demo. L'Indicatore Smart Price Action Concepts è uno strumento molto potente sia per i nuovi che per i trader esperti. Racchiude più di 20 utili indicatori in uno solo, combinando idee di trading avanzate come l'Analisi del Trader del Circolo Interno e le Strategie di Trading
Stratos Pali
Michela Russo
5 (1)
Stratos Pali Indicator   is a revolutionary tool designed to enhance your trading strategy by accurately identifying market trends. This sophisticated indicator uses a unique algorithm to generate a complete histogram, which records when the trend is Long or Short. When a trend reversal occurs, an arrow appears, indicating the new direction of the trend. Important Information Revealed Leave a review and contact me via mql5 message to receive My Top 5 set files for Stratos Pali at no cost! D
ATTUALMENTE SCONTATO DEL 31%! La soluzione migliore per ogni principiante o trader esperto! Questo indicatore è uno strumento di trading unico, di alta qualità e conveniente perché abbiamo incorporato una serie di caratteristiche proprietarie e una formula segreta. Con un solo grafico fornisce avvisi per tutte le 28 coppie di valute. Immaginate come migliorerà il vostro trading perché sarete in grado di individuare l'esatto punto di innesco di una nuova tendenza o opportunità di scalping!
Ultimate Gold Advisor per MetaTrader 4 – Il Tuo Strumento di Trading All’Avanguardia per il Successo Garantito! L’ Ultimate Gold Advisor è molto più di un semplice indicatore: è il gioiello tecnologico che rivoluzionerà il tuo approccio al trading su MetaTrader 4. Progettato per soddisfare le esigenze dei trader più esigenti, questo indicatore all’avanguardia combina precisione chirurgica, analisi sofisticata e funzionalità potenti per offrirti un vantaggio competitivo imbattibile sui mercati. I
MetaBands M4
Vahidreza Heidar Gholami
5 (2)
MetaBands uses powerful and unique algorithms to draw channels and detect trends so that it can provide traders with potential points for entering and exiting trades. It’s a channel indicator plus a powerful trend indicator. It includes different types of channels which can be merged to create new channels simply by using the input parameters. MetaBands uses all types of alerts to notify users about market events. Features Supports most of the channel algorithms Powerful trend detection algorith
PowerBall Signals è un indicatore di segnali ACQUISTA/VENDI basato sull'idea di utilizzare zone di supporto/resistenza. L'indicatore rileva speciali modelli di inversione basati su zone di supporto/resistenza e fornisce questi segnali sul grafico. L'idea principale dell'indicatore è utilizzare l'analisi MTF (Multi Time Frame) e fornire segnali basati sui livelli dell'intervallo di tempo corrente e successivo. Questo metodo consente di prevedere possibili inversioni di prezzo su qualsiasi mercato
Currency Strength Wizard è un indicatore molto potente che ti fornisce una soluzione all-in-one per un trading di successo. L'indicatore calcola la potenza di questa o quella coppia forex utilizzando i dati di tutte le valute su più intervalli di tempo. Questi dati sono rappresentati in una forma di indice di valuta facile da usare e linee elettriche di valuta che puoi utilizzare per vedere il potere di questa o quella valuta. Tutto ciò di cui hai bisogno è collegare l'indicatore al grafico che
Quantum Breakout Indicator PRO
Bogdan Ion Puscasu
4.96 (25)
Presentazione       Quantum Breakout PRO   , l'innovativo indicatore MQL5 che sta trasformando il modo in cui scambi le zone di breakout! Sviluppato da un team di trader esperti con un'esperienza di trading di oltre 13 anni,   Quantum Breakout PRO   è progettato per spingere il tuo viaggio di trading a nuovi livelli con la sua strategia innovativa e dinamica della zona di breakout. Quantum Breakout Indicator ti fornirà frecce di segnalazione sulle zone di breakout con 5 zone target di prof
Entry Points Pro
Yury Orlov
4.62 (175)
Indicatore top per MT5 che fornisce segnali accurati per entrare in un trade senza riverniciare! Può essere applicato a qualsiasi attività finanziaria: forex, criptovalute, metalli, azioni, indici.  La versione MT5 è qui Fornirà segnali di trading piuttosto precisi e ti dirà quando è meglio aprire un trade e chiuderlo. Guarda il video (6:22) con un esempio di elaborazione di un solo segnale che ha ripagato l'indicatore! La maggior parte dei trader migliora i propri risultati di trading
Scalper Vault
Oleg Rodin
5 (27)
Scalper Vault è un sistema di scalping professionale che ti fornisce tutto il necessario per scalping di successo. Questo indicatore è un sistema di trading completo che può essere utilizzato dai trader di forex e opzioni binarie. L'intervallo di tempo consigliato è M5. Il sistema fornisce segnali di freccia accurati nella direzione della tendenza. Ti fornisce anche i segnali più alti e più bassi e i livelli di mercato di Gann. Gli indicatori forniscono tutti i tipi di avvisi, comprese le notifi
ATTUALMENTE SCONTATO DEL 26% La soluzione migliore per ogni principiante o trader esperto! Questo indicatore è uno strumento di trading unico, di alta qualità e conveniente perché abbiamo incorporato una serie di caratteristiche proprietarie e una nuova formula. Con un solo grafico è possibile leggere la forza delle valute per 28 coppie Forex! Immaginate come migliorerà il vostro trading perché sarete in grado di individuare l'esatto punto di innesco di una nuova tendenza o di un'opportunit
Matrix Arrow Indicator MT4
Juvenille Emperor Limited
5 (3)
Matrix Arrow Indicator MT4 è un trend unico 10 in 1 che segue un indicatore multi-timeframe al 100% non ridipinto che può essere utilizzato su tutti i simboli/strumenti: forex, materie prime, criptovalute, indici, azioni.  Matrix Arrow Indicator MT4 determinerà la tendenza attuale nelle sue fasi iniziali, raccogliendo informazioni e dati da un massimo di 10 indicatori standard, che sono: Indice di movimento direzionale medio (ADX) Indice del canale delle materie prime (CCI) Candele classiche He
FX Volume
Daniel Stein
4.58 (33)
Ricevi il tuo aggiornamento quotidiano sul mercato con dettagli e schermate tramite il nostro Morning Briefing qui su mql5 e su Telegram ! FX Volume è il PRIMO e UNICO indicatore di volume che fornisce una visione REALE del sentiment del mercato dal punto di vista del broker. Fornisce informazioni straordinarie su come gli operatori di mercato istituzionali, come i broker, sono posizionati sul mercato Forex, molto più velocemente dei rapporti COT. Vedere queste informazioni direttamente sul vo
Market Structure
Reza Aghajanpour
4.85 (26)
** All Symbols x All Timeframes scan just by pressing scanner button ** *** Contact me  to send you instruction and add you in "Market Structure group" for sharing or seeing experiences with other users. Introduction: Market structure is important for both new and professional traders since it can influence the liquidity and price action of a market (Breakout and Retest). It’s also one of the most commonly used techniques to understand trends, identify potential reversal points, and get a feel f
IX Power MT4
Daniel Stein
5 (5)
IX Power porta finalmente l'imbattibile precisione di FX Power ai simboli non-Forex. Determina con precisione l'intensità delle tendenze a breve, medio e lungo termine dei vostri indici preferiti, azioni, materie prime, ETF e persino criptovalute. Potete analizzare tutto ciò che il vostro terminale ha da offrire. Provatelo e sperimentate come il vostro tempismo migliori significativamente durante il trading. Caratteristiche principali di IX Power Risultati di calcolo precisi al 100% e n
Market Reversal Alerts
LEE SAMSON
4.19 (113)
Il profitto dalla struttura del mercato cambia quando il prezzo si inverte e si ritira. L'indicatore di avviso di inversione della struttura del mercato identifica quando una tendenza o un movimento di prezzo si sta avvicinando all'esaurimento e pronto a invertire. Ti avvisa dei cambiamenti nella struttura del mercato che in genere si verificano quando stanno per verificarsi un'inversione o un forte pullback. L'indicatore identifica inizialmente i breakout e lo slancio del prezzo, ogni volta
Lascia un commento dopo l'acquisto per ricevere 4 indicatori di alta qualità come bonus. L'indicatore Chart Patterns All-in-One aiuta i trader a visualizzare vari modelli di grafici comunemente utilizzati nell'analisi tecnica. Questo indicatore supporta l'identificazione dei possibili comportamenti del mercato, ma non garantisce la redditività. Si consiglia di testare l'indicatore in modalità demo prima dell'acquisto. Offerta attuale : 50% di sconto sull'indicatore "Chart Patterns All in One". M
Altri dall’autore
FiboRecDemo
Alfred Kamal
4 (1)
This indicator is Demo version of FiboRec and works only on EURUSD This indicator depends on Fibonacci lines but there are secret lines I used. By using FiboRec indicator you will be able to know a lot of important information in the market such as: Features You can avoid entry during market turbulence. You can enter orders in general trend only. You will know if the trend is strong or weak. Signal Types and Frame used You can use this indicator just on H1 frame. Enter buy order in case Cand
FREE
This is Demo version of PipsFactoryWeekly This indicator depends on High and Low price of Currency in last Week and then i made some secret equations to draw 10 lines. Features: You will know what exactly price you should enter the market . You will know when to be out of market. You will know you what should you do in market: Buy Sell Take profit and there are 3 levels to take your profit Support Resistance Risk to buy Risk to Sell Signal Types and Frame used: You can use this indicator jus
FREE
It is a demo version of Advanced Arrow indicator It works only on GBPJPY but the full version works on all currency pairs. Features Simply it gives you entry point ,SL line and 4 TP lines or less. Once SL-TP lines are shown with the arrow, they remains as they are until signal change. It is historical indicator. No Repaint. Indicator parameters Indicator Version : choose V5 or V6. TP 1 Line color : TP1 color. TP 2 Line color : TP2 color. TP 3 Line color : TP3 color. TP 4 Line color : TP4 co
FREE
This is a Demo version of PipsFactoryInd it is works only NZD/USD but full version is works on all currency pair. This indicator is a collection of three indicators, it is 3 in 1: PipsFactoryDaily Click Here PipsFactoryWeekly Click Here PipsFactoryMonthly Click Here This indicator depends on High and Low price of currency in the (Last day / Last week / Last Month) depends on user input, and then I made some secret equations to draw 10 lines. Features: You will know what exactly price you s
FREE
This is Demo Version of PipsFactoryMonthly This indicator depends on High and Low price of Currency in last Month and then i made some secret equations to draw 10 lines. Features You will know what exactly price you should enter the market. You will know when to be out of market. You will know you what should you do in market: Buy Sell Take profit and there are 3 levels to take your profit Support Resistance Risk to buy Risk to Sell Signal Types and Timeframe Used You can use this indicator
FREE
PipsFactoryDailyDemo
Alfred Kamal
4.5 (2)
This is Demo Version of PipsFactoryDaily This indicator depends on High and Low price of currency in the last day, and then I made some secret equations to draw 10 lines. Features You will know what exactly price you should enter the market. You will know when to be out of market. You will know what you should do in market: Buy Sell Take profit, and there are three levels to take your profit Support Resistance Risk to buy Risk to sell Signal Types and Timeframes Used You can use this indicat
FREE
Features It is a demo version of All inOne indicator It works only on EURUSD, but the full version works on all currency pairs. All in One indicator is a simple indicator, it makes you know about 8 indicators in all timeframes simultaneously at a single glance. Stochastic RSI Moving Average (MA) Parabolic SAR ADX MACD CCI Last Candle (Candle) In all timeframes (M1, M5, M15, M30, H1, H4, D1, MN) at the same time. Parameters Stochastic: PercentK : Period of the %K line. PercentD : Period of the
FREE
FiboRec
Alfred Kamal
This indicator depends on Fibonacci lines but there is a secret lines i used them, by using FiboRec indicator you will be able to know a lot of important information in the market such as: Features You can avoid entry during market turbulence. You can enter orders in general trend only. You will know if the trend is strong or weak. Signal Types and Frame used You can use this indicator just on H1 frame. Enter buy order in case Candle break out the square area and closed over it, at least 20
This indicator depends on High and Low price of Currency in last Week and then i made some secret equations to draw 10 lines. Features: You will know what exactly price you should enter the market . You will know when to be out of market. You will know you what should you do in market: Buy Sell Take profit and there are 3 levels to take your profit Support Resistance Risk to buy Risk to Sell Signal Types and Frame used: You can use this indicator just on H4 frame and you have to download the
This indicator depends on High and Low price of Currency in last Month and then i made some secret equations to draw 10 lines. Features You will know what exactly price you should enter the market . You will know when to be out of market. You will know you what should you do in market: Buy Sell Take profit and there are 3 levels to take your profit Support Resistance Risk to buy Risk to Sell Signal Types and Timeframe Used You can use this indicator just on H4 timeframe and you have to downl
PipsFactoryDaily
Alfred Kamal
5 (1)
This indicator depends on High and Low price of currency in the last day, and then I made some secret equations to draw 10 lines. Features You will know what exactly price you should enter the market. You will know when to be out of market. You will know what you should do in market: Buy Sell Take profit, and there are three levels to take your profit Support Resistance Risk to buy Risk to sell Signal Types and Timeframes Used You can use this indicator just on (M1, M5, M15, M30, H1) timefra
Description: This indicator is a collection of three indicators , it is 3 in 1: PipsFactoryDaily Click Here PipsFactoryWeekly Click Here PipsFactoryMonthly Click Here If you are interesting in all of them, you can save money - this collection indicator is cheaper. This indicator depends on High and Low price of currency in the (Last day / Last week / Last Month) depends on user input, and then I made some secret equations to draw 10 lines. Features: You will know what exactly price you sho
Advanced Arrow
Alfred Kamal
3.9 (39)
This indicator depends on some secrets equations to draw Signals with Stop loss and maximum 4 Take profits. There is a free EA depends on this indicator as a gift when you purchase/rent it. Features Simply it gives you entry point as Ready sign (Buy / Sell) and arrow (Buy / Sell) after candle closed, also SL line and 4 TP lines or less. Once SL-TP lines are shown with the arrow, they remains as they are until signal change. It is historical indicator. No Repaint. user manual for V5 please cli
All Pivot Points
Alfred Kamal
5 (1)
Pivot Points is used by traders to objectively determine potential support and resistance levels. Pivots can be extremely useful in Forex since many currency pairs usually fluctuate between these levels. Most of the time, price ranges between R1 and S1. Pivot points can be used by range, breakout, and trend traders. Range-bound Forex traders will enter a buy order near identified levels of support and a sell order when the pair nears resistance. But there are more one method to determine Pivot p
This indicator draws the Fibonacci -38.2, -17, 38.2, 61.8, 117, 138 levels for the last closed H1, H4, Daily, Weekly and Monthly candle. Features Automatic display of the most important Fibonacci levels. Parameters TimeFrame: Choose which timeframe you want Fibonacci levels to be based on. SetLabels: Visible/invisible Fibonacci level labels. Labels Position : Position of Fibonacci level labels (Right - Left - Middle). FontSize: Font size of Fibonacci level labels. c38: Color of level 3
It is the same of Advanced Arrow indicator but shows the signal of 8 currencies pairs at the same time on 5 Timeframes without any TPs line or SL. Features You will know when exactly you should enter the market. This indicator does not repaint it's signals. Signal Types and Timeframes Used You can use this indicator on any timeframes but i recommend you to use it on H1, H4 frames. The indicator gives you four signals (Ready to Buy "RBuy", Ready to Sell "RSell", Buy, Sell). When RBuy appear y
This indicator show you the begin of the Trend by drawing (Up/Down) arrow. It works using compatibility of current fame and the next 3 frames to make it more professional and more profitable. Features:- Simply it gives you entry point as arrow (Buy / Sell) after candle closed. You can use it on time frames ( M1 , M5 , M15 , M30 ) are more profitable. You can use it on any currencies pair. It is historical indicator. No Repaint. No additional indicator needed. Easy to use. Indicator parameters:
Filtro:
Nessuna recensione
Rispondi alla recensione
Versione 2.0 2021.12.02
recompile in the latest platform build