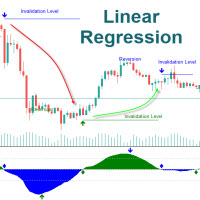
Linear Regression Oscillator FX MT4
- Indicatori
- Cao Minh Quang
- Versione: 1.0
- Attivazioni: 5
The Linear Regression Oscillator (LRO) is a technical indicator based on linear regression analysis, commonly used in financial markets to assess the momentum and direction of price trends. It measures the distance between the current price and the value predicted by a linear regression line, which is essentially the best-fit line over a specified period. Here’s a breakdown of how it works and its components:
Key Components of the Linear Regression Oscillator
-
Linear Regression Line (Best-Fit Line): This line represents the expected price movement over a certain period and is calculated using linear regression techniques. The slope of the line indicates the trend's direction: a positive slope suggests an uptrend, while a negative slope points to a downtrend.
-
Oscillator Values: The oscillator value is calculated by measuring the deviation between the current price and the linear regression line. This deviation is plotted as an oscillator value, typically oscillating around a zero line.
-
Zero Line: The zero line in an LRO plot acts as a baseline. When the oscillator value crosses above the zero line, it suggests bullish momentum, and a cross below suggests bearish momentum.
-
Settings and Periods: The period setting defines the number of bars or data points considered for calculating the linear regression line. Traders adjust this setting to suit short-term or long-term trading strategies, depending on their preferred analysis timeframe.
How Traders Use the Linear Regression Oscillator
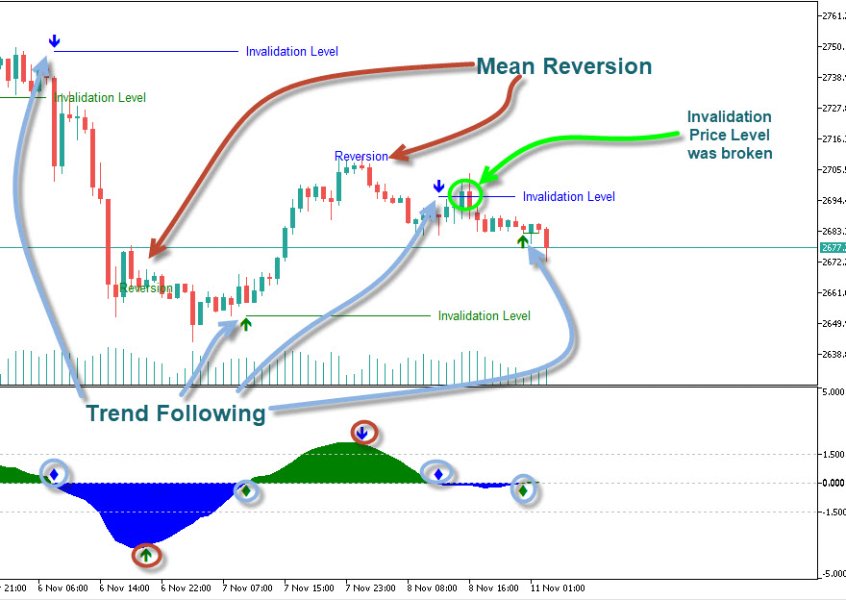
- Identifying Trends: The LRO helps traders see if the current price trend has momentum by showing the relative distance between price and its expected (regression) line.
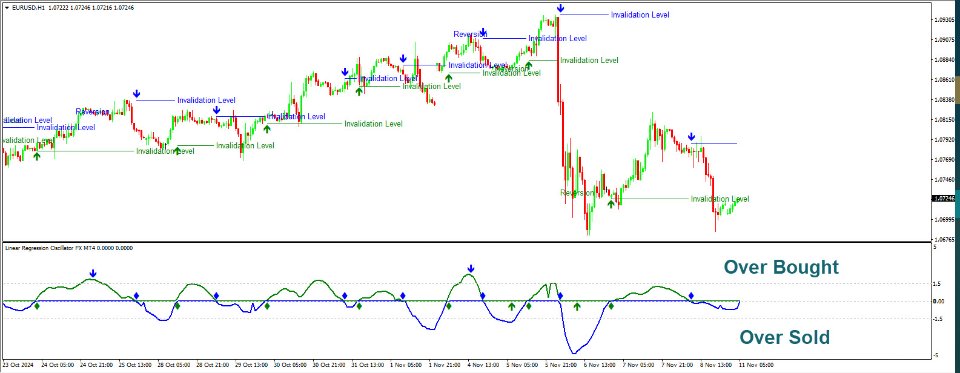
- Overbought/Oversold Levels: Extreme values in the oscillator can indicate overbought or oversold conditions, suggesting a potential reversal or a need to adjust positions.
- Divergence Signals: When price movements and the LRO indicator diverge, it can signal weakening momentum or a possible reversal.
Interpretation Tips
- Crossing the Zero Line: A cross above zero may indicate an emerging uptrend, while a cross below zero suggests a downtrend.
- Adjusting Periods: Shorter periods make the LRO more sensitive, capturing quick price movements but increasing noise. Longer periods smooth out fluctuations, suitable for identifying longer-term trends.
Usage Notes:
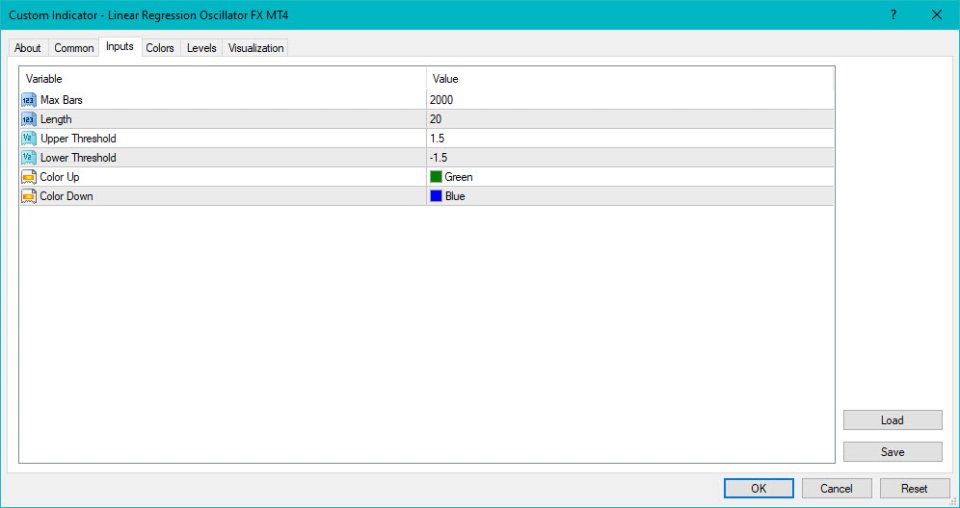
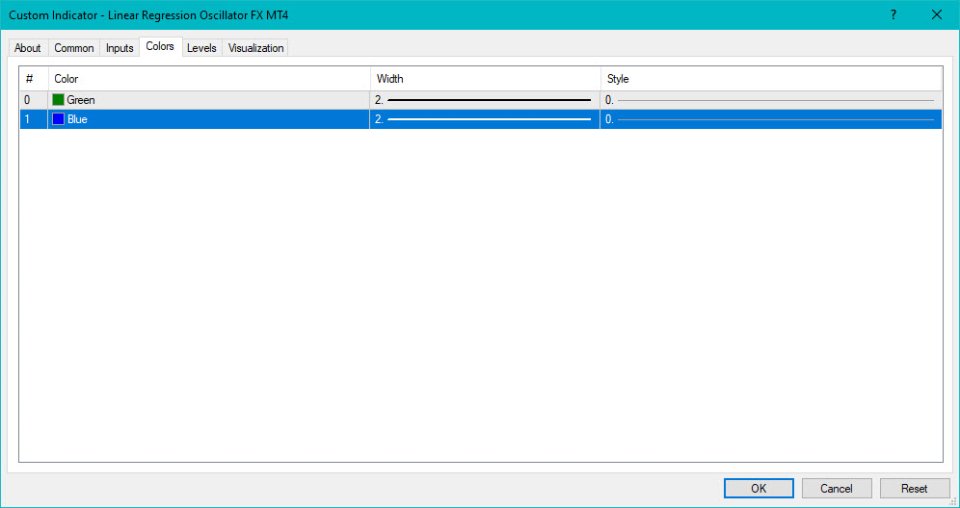
- Length: Determines the period over which the linear regression is calculated
- Upper/Lower Threshold: Define the upper and lower bounds for identifying overbought and oversold conditions. Values outside these thresholds suggest potential reversals.
The Linear Regression Oscillator is valued for combining statistical analysis with trend-following principles, making it a versatile tool for both momentum and trend traders. It’s particularly useful in trending markets where it helps identify trend continuations or reversals based on deviations from the regression trendline.
