• Panoramica
  • Recensioni
  • Commenti
  • Novità

SwingVolumePro

🎯 Panoramica

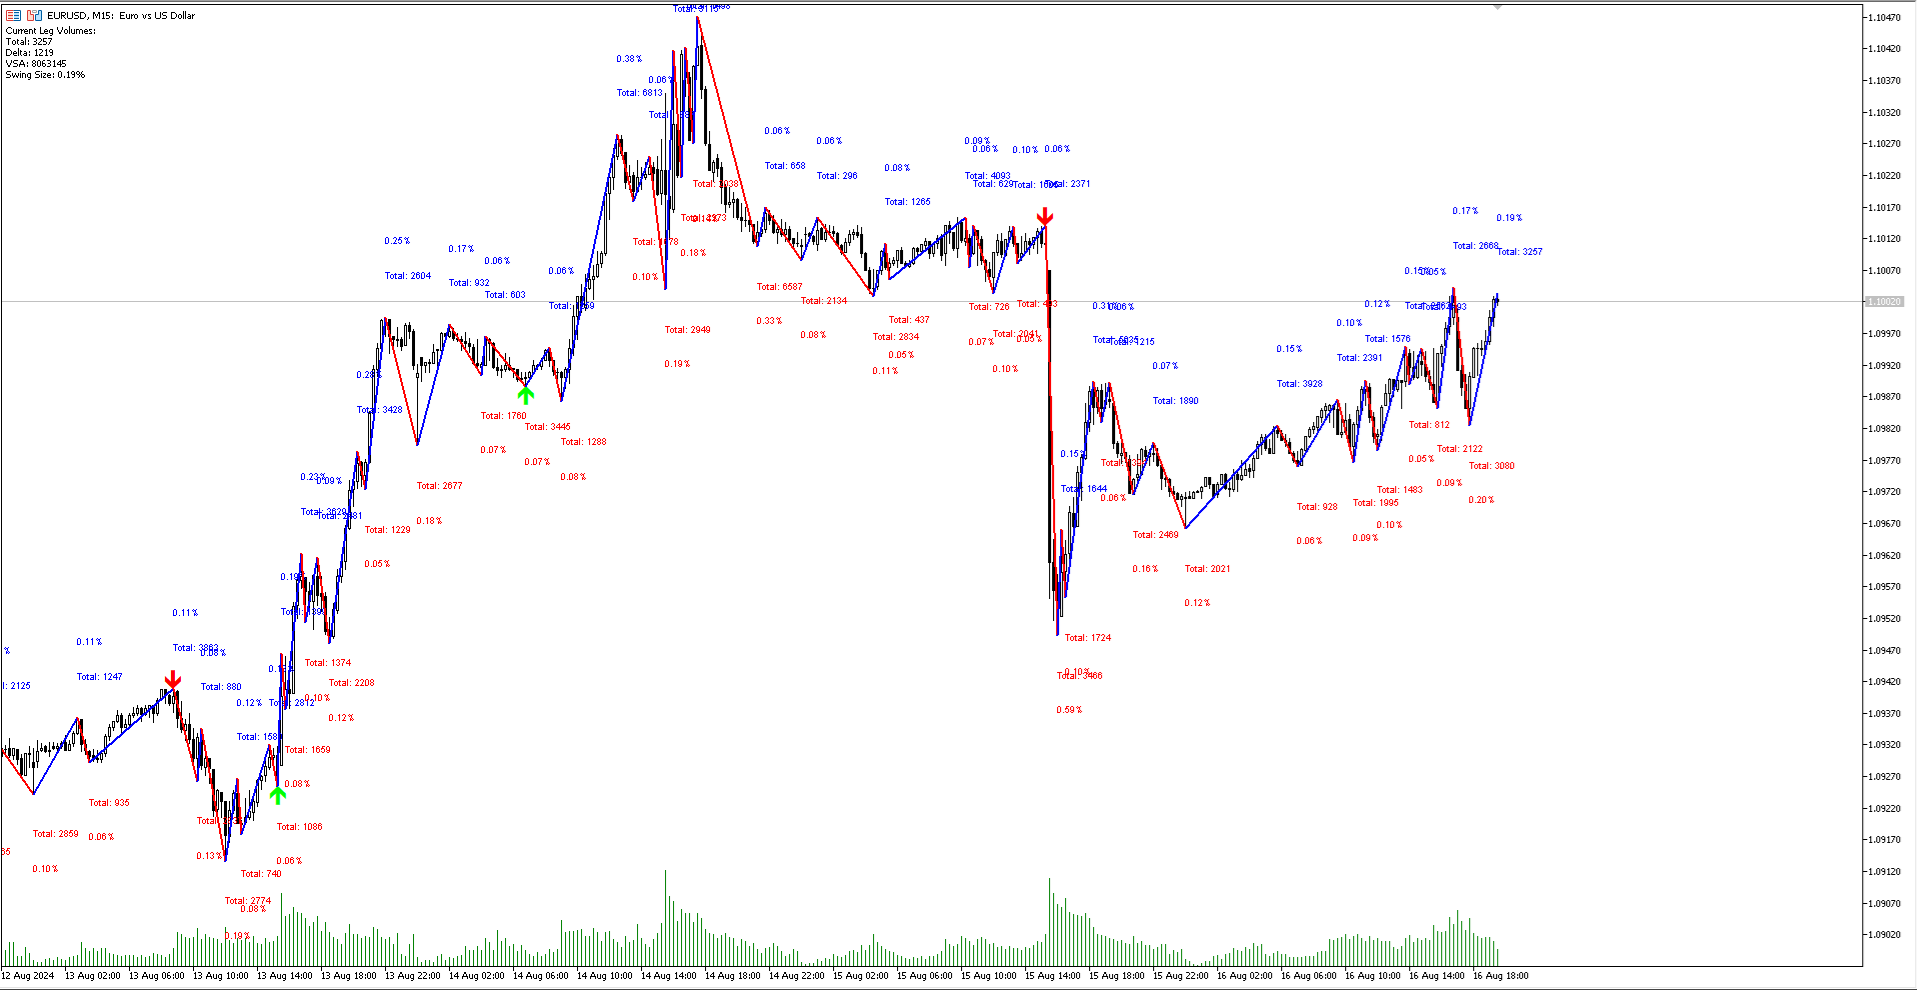
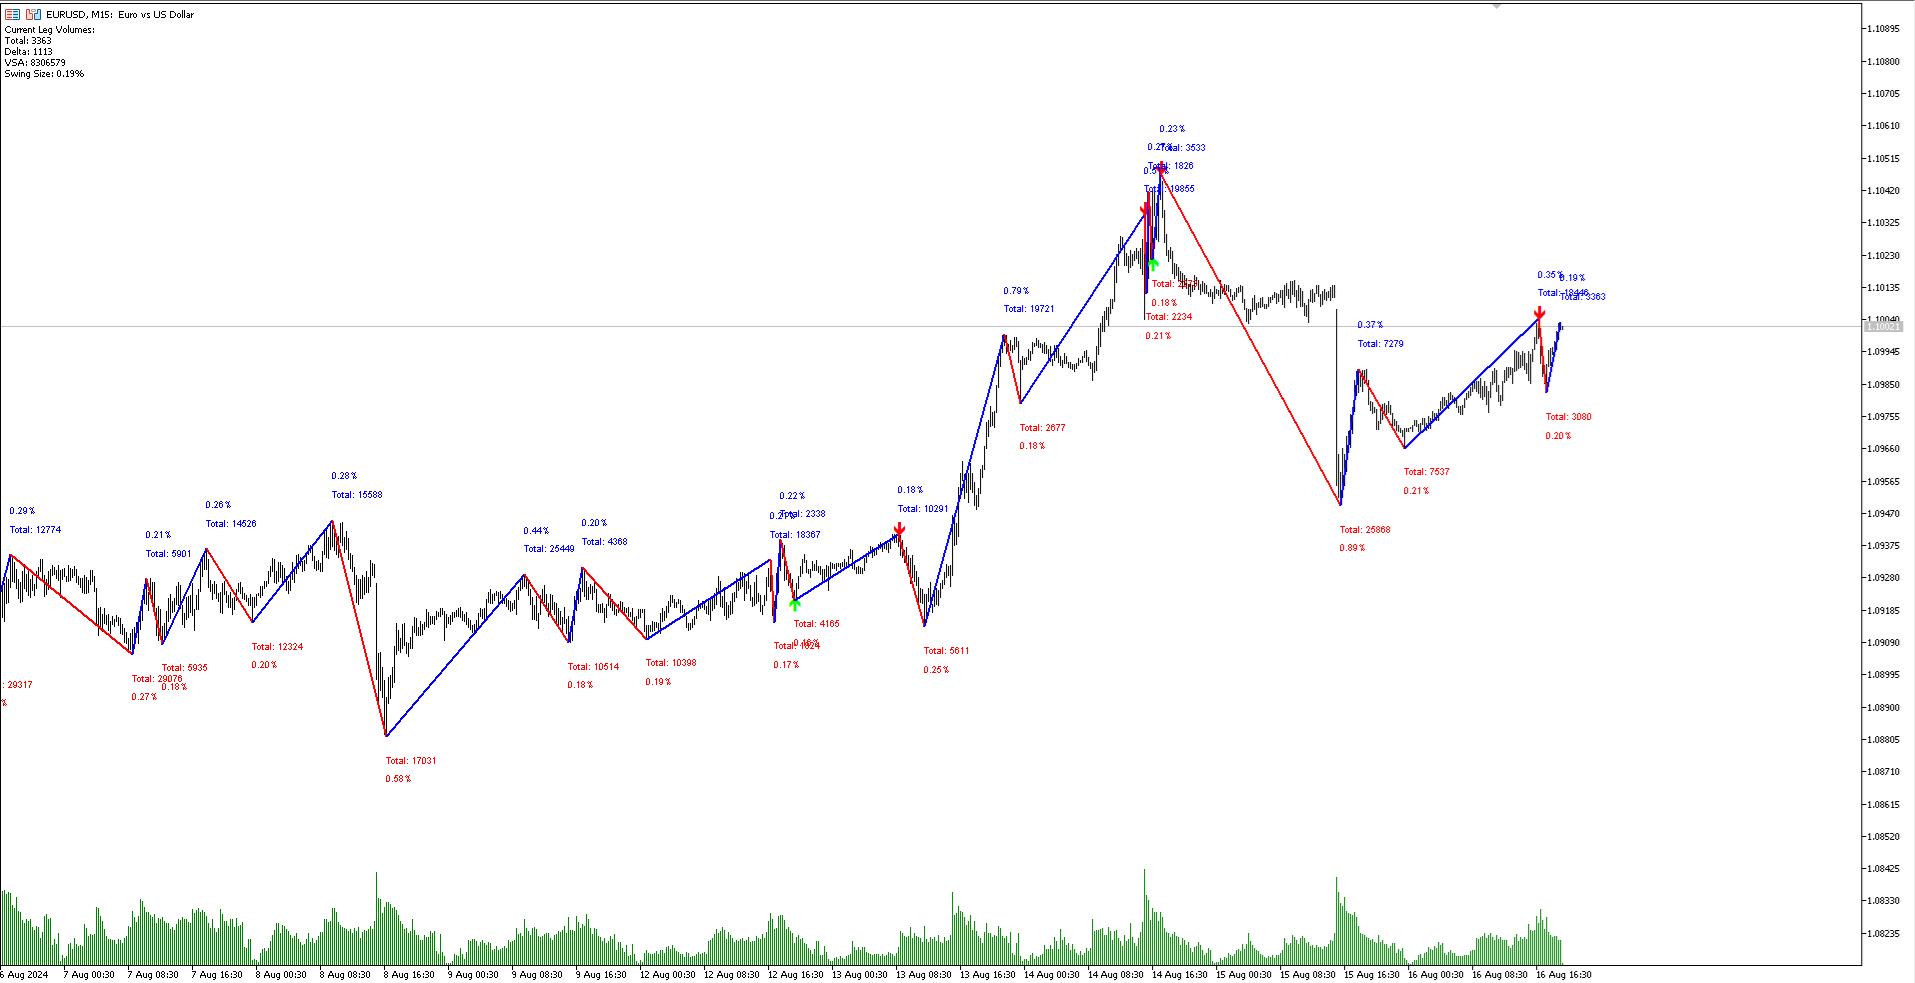
SwingVolumePro è un indicatore avanzato e versatile, progettato per essere utilizzato su una vasta gamma di strumenti finanziari e per supportare diversi stili di trading. Basato su un'analisi rigorosa di volume e prezzo, fornisce segnali chiari e precisi che consentono ai trader di tutti i livelli di prendere decisioni informate basate su dati di alta qualità.


SwingVolumePro.PDF


🔑 Caratteristiche principali

  • 🌍 Versatilità: SwingVolumePro può essere applicato a vari asset, tra cui azioni, forex, criptovalute e altro ancora. È adatto a diverse strategie di trading, dallo scalping alle posizioni a lungo termine.

  • 🎯 Segnali Precisi e Affidabili: SwingVolumePro si concentra sulla fornitura di segnali di alta precisione utilizzando tecniche sofisticate per identificare modelli di assorbimento dei prezzi e aggressioni del mercato. Questi segnali sono presentati in modo chiaro, facilitando una rapida e efficace decisione.

  • 📊 Analisi Avanzata di Volume e Prezzo: L'indicatore utilizza un'analisi dettagliata delle interazioni tra volume e prezzo per rilevare situazioni in cui c'è uno scostamento tra sforzo e risultato, indicando potenziali movimenti di mercato.

  • 🧩 Facilità di Interpretazione: Con un'interfaccia intuitiva e user-friendly, SwingVolumePro genera segnali che sono facili da comprendere anche per i trader meno esperti. L'uso di frecce per mostrare la relazione sforzo-risultato rende la lettura delle informazioni ancora più semplice.

🤖 Compatibilità con EA (Expert Advisors)

SwingVolumePro è progettato con supporto tecnico per la creazione di Expert Advisors (EA), facilitando l'automazione delle strategie di trading. Fornisce i seguenti buffer che possono essere utilizzati negli EA:

  1. Buffer 0: UpArrow (Freccia verso l'alto) 📈
  2. Buffer 1: DownArrow (Freccia verso il basso) 📉
  3. Buffer 2: UpLine (Linea verso l'alto) ⬆️
  4. Buffer 3: DownLine (Linea verso il basso) ⬇️
  5. Buffer 4: TotalVolume (Volume Totale) 🔄
  6. Buffer 5: DeltaVolume (Delta Volume) ➕➖
  7. Buffer 6: VSAVolume (Volume VSA) 📊

🔍 Funzionamento

  • ⏱️ Monitoraggio Continuo: SwingVolumePro esegue un'analisi dinamica in tempo reale del mercato, identificando modelli di volume e prezzo che possono indicare cambiamenti imminenti nel comportamento dell'asset.

  • 💡 Generazione di Segnali: Basato su un'analisi precisa dell'assorbimento dei prezzi e delle aggressioni del mercato, l'indicatore emette segnali facili da interpretare e applicabili a diverse strategie di trading.

  • 🧠 Analisi Contestuale: Oltre a generare segnali, SwingVolumePro offre anche approfondimenti sul contesto generale del mercato, aiutando il trader a comprendere meglio le condizioni in cui i segnali vengono generati e ottimizzare la decisione.

🏆 Vantaggi per il Trader

  • 🗝️ Chiarezza e Precisione: SwingVolumePro è progettato per semplificare l'analisi del mercato fornendo segnali diretti e facili da comprendere.

  • 🌐 Applicabilità Universale: Indipendentemente dall'asset che si sta negoziando, SwingVolumePro è uno strumento efficace che si adatta alle peculiarità dei diversi mercati.

  • 🔄 Supporto per Diverse Strategie: L'indicatore è abbastanza flessibile da essere integrato in diverse strategie di trading, sia a breve termine che a lungo termine.

🚀 Conclusione

SwingVolumePro è uno strumento indispensabile per i trader che cercano chiarezza, precisione ed efficienza nelle loro operazioni. Con la sua capacità di generare segnali tecnici di alta qualità, la compatibilità con la creazione di EA e l'analisi robusta di volume e prezzo, diventa un partner prezioso in diversi scenari di mercato. Prova SwingVolumePro e scopri come può migliorare le tue strategie di trading offrendo analisi approfondite e segnali affidabili.


Prodotti consigliati
Impulse fractals indicator - is counter-trend oriented complex market fractal pattern.  Market creates bull/bear impulse, trend starts, fractals on impulsed wave are an agressive pullback signals. Buy arrow is plotted when market is bearish and it's impulse showed up-side fractal, and sell arrow is plotted when market is bullish and it's impulse showed dn-side fractal. Main indicator's adjustable inputs : impulsePeriod - main period of impulse histogram  filterPeriod  - smoothes impulse accordi
- This is an implementation of OCC ==> open close cross - This indicator applies twelve different averaging methods to open and close prices separately to signal the trend switching. - All MA methods are set as input as well as period and different offsets applied to linear regression and ALMA averaging. - Buffers 16 and 17 can be used in EAs to detect trend direction. - You can message in private chat for further changes you need.
INDICATORE basato sull'INTELLIGENZA ARTIFICIALE che genera possibili ingressi call e put per opzioni binarie. l'indicatore lavora su 3 diverse strategie: 1) attraverso la lettura dei volumi, manda un segnale quando il prezzo dovrebbe invertire 2) attraverso la divergenza tra il prezzo ed il volume, manda un segnale quando il trend dovrebbe continuare od invertire 3) attraverso la convergenza tra il prezzo ed il volume, manda un segnale quando il trend dovrebbe continuare. l'indicatore lavora s
Deriv Boom sell
Yaovi Inoussa Atchou
Our BOOM SELL ALERT indicator is specifically engineered to   take candles on BOOM 1000 , BOOM 500 is tool is optimized for M1 (1-minute) timeframe, ensuring you receive timely and actionable insights.   The indicator is a combination of   many indicators. -        AO Oscillator -        Stochastic   HOW TO USE THIS INDICATOR To use well this indicator , it   need to use SCHAFF TREND RSX ( 5 MIN OR M5) IF SCHAFF trend RSX is GREEN and you have a signal then SELL when you have ENTRY and out with
Turpial Pullback
Arlos Elias Rivas Romero
Indicator Type Strategy (Pullback) for all Symbols and Periodicity, Preferably from 30M periodicity. Can be used for manual trading. Its workspace corresponds to channel of 3 bars of Bill Willians. Also relies on the indicator Rsi and Atr. BUY when: There is a Green Arrow STOPLOSS to buy, below the bottom line of the channel (red line)" SELL when: There is a Red Arrow. STOPLOSS to sell, above the upper line of the channel (blue line)
L'indicatore EYeQ è un potente strumento per offrire segnali di ingresso su STEP INDEX, VOLATILITY 10, 25,50,75 100, BOOM e CRUSH. È più efficace per catturare SPIKES su BOOM e CRUSH 300, 500 e 1000. L'indicatore EYeQ analizza i mercati su più tempi e trova i punti di ingresso più adatti in base alle tendenze. Devi solo attivare gli avvisi sul desktop in modo da poter essere avvisato quando i segnali vengono rilasciati. Consenti le notifiche push ad altri dispositivi portatili come telefoni
MarketMagnet
Kelly Adediran Raymond
Are you ready to take your trading journey to new heights? Look no further than MarketMagnet, this groundbreaking indicator designed to propel your trading success with excitement and accuracy. Powered by the convergence of Momentum and CCI (Commodity Channel Index), MarketMagnet equips traders with the ultimate tool to determine direction and entry prices for a wide range of recommended currency pairs and instruments. It is designed for traders seeking to scalp for a few pips on lower timeframe
The indicator determines a special pattern of Joe Dinapoli. It gives very high probability buy and sell signals. Indicator does not repaint. Indicator Usage Buy Signal ''B'' Entry : Market buy order at signal bar close Stop : Low of signal bar Take Profit : First swing high Sell Signal ''S'' Entry : Market sell order at signal bar close Stop : High of signal bar Take Profit : First swing low Indicator Parameters Fast EMA : External Parameter (should be kept as default) Slow EMA: External Param
To download MT4 version please click here . - This is the exact conversion from TradingView: "Linear Regression Candles" By "ugurvu". - The overall look of the indicator is like Heiken Ashi. - It can be used as a trend confirmation indicator to detect the right trend direction. - This indicator lets you read the buffers for Candles' OHLC. - This is a non-repaint and light processing load indicator - You can message in private chat for further changes you need. Thanks
VVWAP Bandas
Edipaulo Zanella
Daily VWAP, continues for a period of hours (eg, 10 hours of history), with color to indicate change of direction and bands to map good entry and exit points. The indicator was created to map the center of the market, and find good buying moments, trend analysis or market correction points are easily detected, allowing you to understand moments of exhaustion and buying and selling points Copyright (c) <year> <copyright holders> Permission is hereby granted, free of charge, to any person obtain
Three Candles Pattern
Edson Cavalca Junior
5 (1)
The patterns of 3 (three) Candles: Three White Soldiers; Three Black Crows; These are reversal patterns widely used by traders, as they have a high probability of showing the inversion of the current market movement. For example, if in a bullish trend there are three black crows, there is a high probability of reversing the current bullish movement. The Three White Soldiers have the following characteristics: There are 3 consecutive candles with a good body, that is, the difference between
Limitless MT5
Dmitriy Kashevich
Limitless MT5 is a universal indicator suitable for every beginner and experienced trader. works on all currency pairs, cryptocurrencies, raw stocks Limitless MT5 - already configured and does not require additional configuration And now the main thing Why Limitless MT5? 1 complete lack of redrawing 2 two years of testing by the best specialists in trading 3 the accuracy of correct signals exceeds 80% 4 performed well in trading during news releases Trading rules 1 buy signa
A useful scanner/dashboard that shows the RSI values for multiple symbols and Time-frames. It can be easily hidden/displayed with a simple click on the scanner man top left of the dashboard. You can input upper and lower RSI values and the colours can be set to show when above/below these values. The default values are 70 and 30. There are also input colours for when the RSI is above or below 50 (but not exceeding the upper/lower levels Symbols and time-frames are input separated by commas.
VWAP indicator for MT5
Renaud Herve Francois Candel
Moving VWAP Indicator Moving VWAP is an important indicator drawing the Volume-Weighted Average Price (VWAP). The VWAP is a reference used by institutional traders and acts as a level of support / resistance. If price is above VWAP then means market is bullish. If price is below VWAP then means market is bearish. It can be used to enter in the market with low risk (near VWAP) and also identify the correct direction of the market. The Moving VWAP is as simple as a Simple Moving Average.
The Plasma Trend indicator is a simple technical indication that is used to determine the current trend direction in the market. The Plasma Trend indicator is a powerful tool for determining the direction of the trend in the Forex market. It is based on both standard technical indicators and proprietary mathematical calculations, which provides a more accurate and reliable trend determination. Its implementation in the form of lines of two colors simplifies the visual determination of a change
Start Midas Fibo Bands
Ricardo Almeida Branco
Here we have the Start Midas Fibo Bands , I confess that it is an indicator that excited me enough to operate because I was able to find more defined rules. Well, the indicator has the functions of the other indicators of the Start line , which is a possibility to plot several Midas on the screen, you can move the anchor point using keyboard shortcuts and use the legend to differentiate one anchor from another. The rules that I have analyzed for my possible setup are recommended to the entry, st
This Indicator adding power to traditional zigzag indicator. With High-Low numbers in vision it will be easier to estimate change of trend by knowing the depth of each wave. Information including points, pips, percentage%, and #bars can be displayed based on configuration. All information is real-time update. This indicator is especially useful in sideway market to buy low sell high.
My PVSR
Ashok Kumar Singha
My PVSR   is based on All Type of Pivot Points. Use this Indicator to get proper Support / Resistance Zone and Trade accordingly.. Recommendation: Use this Indicator along with my another Indicator --->>> Dr. Trend   <<<--- Click Here ; To get the best output result feel free to contact me ; Best of Luck It can be used for: All Pairs: Forex, Cryptocurrencies, Metals, Stocks, Indices etc. All Timeframe All Brokers All type of Trading Style like Scalping, Swing, Intraday, Short-Term, Lon
Regent Street, rather than an expert or an indicator, is an all-in-one trading assistant easing your trading sessions by providing signals and notifications. It's an assistant rather than a robot - "an assisted steering rather than an autopilot", and now, it autoadjusts itself to any instrument, any timeframe & any circumstance. Note from the author: Regent Street's frontend is exactly the same as an other product Ermou Street , but the backend is different. Performances for each are very relati
Introduction to Fractal Pattern Scanner Fractal Indicator refers to the technical indicator that makes use of the fractal geometry found in the financial market. Fractal Pattern Scanner is the advanced Fractal Indicator that brings the latest trading technology after the extensive research and development work in the fractal geometry in the financial market. The most important feature in Fractal Pattern Scanner is the ability to measure the turning point probability as well as the trend probabil
Setup Double 7s
Luigi Nunes Labigalini
Entry and exit signals from the Double 7's Strategy by Larry Connors in his book "Short Term Trading Strategies That Work". Larry claims this strategy predicted the market's direction over 80% of the time since 1995. Picking up the gains and being exposed in the market less than 25% of the time. Good for swing trading on Daily charts of SPY, Nasdaq, China's FXI, Brazil's EWZ and the majority of the equity ETFs and World Indices. How does it work? The indicator activates the buy signal when
This product generates signals at closing bars thanks to channel scaling. It visualizes these signals with an arrow. The color of the arrow indicates the direction of the trade. The default settings are valid for the H1 period. You can backtest for each period and product. The code content of the indicator has been applied in accordance with price movements as much as possible. For this reason, it detects trend beginnings and ends well. Parameter descriptions: PER: Indicates the number of b
Rocket Trend
Andriy Sydoruk
The Rocket Trend indicator is trending. The indicator draws two-color points connected by lines along the chart. This is a trend indicator, it is an algorithmic indicator. It is easy to work and understand when a blue circle appears, you need to buy, when a red one appears, sell. The indicator is used for scalping and pipsing, and has proven itself well. Rocket Trend is available for analyzing the direction of the trend for a specific period of time. Ideal for novice traders learning the laws o
The rubdfx divergence indicator is a technical analysis tool that compares a security's price movement. It is used to identify potential changes in the price trend of a security. The indicator can be applied to any type of chart, including bar charts and candlestick charts. The algorithm is based on MACD, which has been modified to detect multiple positive and negative divergences. Settings  ___settings___ * fastEMA * slowEMA * signalSMA *Alerts:   True/False     #Indicator Usage B
【Super Scanner】Indicator Introduction : The color of the Super Scanner which is green and climbing up means that the price trend is going up.The color of the Super Scanner is red and going down means that the price trend is going down. It is very simple to use it to judge the market trend! What's even better is that the open parameters of the indicators allow investors to adjust. You can adjust【Super Scanner】according to your needs. Adjust it faster to be closer to short-term market fluctuati
L'indicatore Volatility Scanner Multi TF è uno strumento che aiuta i trader a identificare e analizzare la volatilità su tutti i Timeframe del grafico. In questo modo hai probabilità maggiori di trovare un ottimo trade. Cosa fa? Scansiona tutti i timeframe per trovare una contrazione di volatilità. Colora il pulsante di giallo se la trova. Ti basta fare click sul pulstante per cambiare Timeframe. Come usarlo? Basta metterlo sul grafico e clickare sui pulsanti gialli per trovare le contrazion
Santo Oscilator
Gustavo Goncalves
5 (1)
Oscilador bem próximo que o indicador SANTO mostrado pelo Bo Williams em sua metodologia PhiCube, para mim este indicador ainda é melhor que o próprio SANTO original. Ótimo para entender a força e tendência de movimentos e possíveis divergências. Preço fazendo topo e o SANTO não renovando máxima, tudo indica que teremos uma reversão ou no mínimo um drawback.
The indicator is the advanced form of the MetaTrader 4 standard Fibonacci tool. It is unique and very reasonable for serious Fibonacci traders. Key Features Drawing of Fibonacci retracement and expansion levels in a few seconds by using hotkeys. Auto adjusting of retracement levels once the market makes new highs/lows. Ability to edit/remove any retracement & expansion levels on chart. Auto snap to exact high and low of bars while plotting on chart. Getting very clear charts even though many ret
Mean Reversion Breakout MT5
Christopher Graham Parish
!! FLASH SALE !!   Over 80% off !!     For ONE week only. Now only $47 - normally $297! >>>      Ends on 30 June 2023 - Don't miss it! Buy and Sell Arrows when price breaks away from mean price. Sends Alerts – On MT5 To Your Phone To Your Email Does not repaint . Works on any Forex pair, any timeframe. 10 Activations allowed so you are free from limitations >> MT4 Version Here For spreads from a tiny 0.1 pips RAW/ECN Accounts,  click here . Check out my Waka Esque EA signal here: >>
Descriptions A point point is a technical analysis indicator, or calculations, used to determine the overall trend of market over different time frames. This indicator calculate the highest or lowest pivots among left x and right y bars and show the high/low level during that period.   From that, you could clearly see the top resistance & bottom support level and how market goes break out. Instructions pivotLeft - pivot left bar count pivotRight - pivot right bar count pivotHighColor - c
Gli utenti di questo prodotto hanno anche acquistato
TPSpro RFI Levels MT5
Roman Podpora
4.73 (11)
ISTRUZIONI       RUS   -   INGLESE       Si   consiglia di utilizzare con un indicatore       -       TPSpro   TENDENZA PRO -   Versione MT4         Un elemento chiave nel trading sono le zone o i livelli da cui vengono prese le decisioni di acquisto o vendita di uno strumento di trading. Nonostante i tentativi dei principali attori di nascondere la loro presenza sul mercato, lasciano inevitabilmente delle tracce. Il nostro compito era imparare a identificare queste tracce e interpretarle corre
Atomic Analyst MT5
Issam Kassas
4.42 (19)
Innanzitutto, vale la pena sottolineare che questo indicatore di trading non è repaint, non è ridisegno e non presenta ritardi, il che lo rende ideale sia per il trading manuale che per quello automatico. Manuale utente: impostazioni, input e strategia. L'Analista Atomico è un indicatore di azione del prezzo PA che utilizza la forza e il momentum del prezzo per trovare un miglior vantaggio sul mercato. Dotato di filtri avanzati che aiutano a rimuovere rumori e segnali falsi, e aumentare il pote
Innanzitutto è importante sottolineare che questo sistema di trading è un indicatore Non-Repainting, Non-Redrawing e Non-Lagging, il che lo rende ideale sia per il trading manuale che per quello automatico. Corso online, manuale e download di preset. Il "Sistema di Trading Smart Trend MT5" è una soluzione completa pensata sia per i trader principianti che per quelli esperti. Combina oltre 10 indicatori premium e offre più di 7 robuste strategie di trading, rendendolo una scelta versatile per div
AT Forex Indicator MT5
Marzena Maria Szmit
5 (4)
The AT Forex Indicator MT5 is a sophisticated trading tool designed to provide traders with a comprehensive analysis of multiple currency pairs. This powerful indicator simplifies the complex nature of the forex market, making it accessible for both novice and experienced traders. AT Forex Indicator uses advanced algorithms to detect trends, patterns and is an essential tool for traders aiming to enhance their forex trading performance. With its robust features, ease of use, and reliable signal
TrendMaestro5
Stefano Frisetti
nota: questo indicatore e' per METATRADER5, se vuoi la versione per  METATRADER4 questo e' il link:   https://www.mql5.com/it/market/product/108106 TRENDMAESTRO ver 2.4 TRENDMAESTRO   riconosce un nuovo TREND sul nascere, non sbaglia mai. La sicurezza di identificare un nuovo TREND non ha prezzo. DESCRIZIONE TRENDMAESTRO identifica un nuovo TREND sul nascere, questo indicatore prende in esame la volatilita' i volumi ed il momentum per identificare il momento in cui c'e' un'esplosione di uno
TPA True Price Action indicator reveals the true price action of the market makers through 100% non-repainting signals strictly at the close of a candle! TPA shows entries and re-entries, every time the bulls are definitely stronger than the bears and vice versa. Not to confuse with red/green candles. The shift of power gets confirmed at the earliest stage and is ONE exit strategy of several. There are available now two free parts of the TPA User Guide for our customers. The first "The Basics"
FxaccurateLS
Shiv Raj Kumawat
WHY IS OUR FXACCCURATE LS MT5 THE PROFITABLE ? PROTECT YOUR CAPITAL WITH RISK MANAGEMENT Gives entry, stop and target levels from time to time. It finds Trading opportunities by analyzing what the price is doing during established trends. POWERFUL INDICATOR FOR A RELIABLE STRATEGIES We have made these indicators with a lot of years of hard work. It is made at a very advanced level. Established trends provide dozens of trading opportunities, but most trend indicators completely ignore them!
Trade smarter, not harder: Empower your trading with Harmonacci Patterns Special Offer: Purchase now to receive free bonuses worth $165! (Read more for details) This is arguably the most complete harmonic price formation auto-recognition indicator you can find for the MetaTrader Platform. It detects 19 different patterns, takes fibonacci projections as seriously as you do, displays the Potential Reversal Zone (PRZ) and finds suitable stop-loss and take-profit levels. [ Installation Guide | Up
XQ Indicator MetaTrader 5
Marzena Maria Szmit
3 (2)
Step into the realm of Forex trading with confidence and precision using XQ, a cutting-edge Forex indicator designed to elevate your trading game to unprecedented heights. Whether you're a seasoned trader or just stepping into the world of currency exchange, XQ Forex Indicator empowers you with the insights and signals needed to make informed trading decisions. The signal conditions are a combination of three indicators, and XQ Forex Indicator only display  medium and long-term trends . The ind
Noize Absorption Index - is the manual trading system that measures the difference of pressure between bears forces and bulls forces. Green line - is a noize free index that showing curent situation. Zero value of index shows totally choppy/flat market.Values above zero level shows how powerfull bullish wave is and values below zero measures bearish forces.Up arrow appears on bearish market when it's ready to reverse, dn arrow appears on weak bullish market, as a result of reverse expectation.
MetaForecast M5
Vahidreza Heidar Gholami
5 (2)
MetaForecast predice e visualizza il futuro di qualsiasi mercato basandosi sull'armonia dei dati dei prezzi. Sebbene il mercato non sia sempre prevedibile, se esiste un modello nei prezzi, MetaForecast può prevedere il futuro con la massima precisione possibile. Rispetto ad altri prodotti simili, MetaForecast può generare risultati più accurati analizzando le tendenze di mercato. Parametri di input Past size (Dimensione passata) Specifica il numero di barre che MetaForecast utilizza per creare
Boom and Crash Trend Detector is a  Non-Repaint   MT5 trading system usually being sold for 50 0$ . Most people use this for Deriv but can be used to forex too. The boom and crash spike indicator is a spike detecting software, with Multiple features, these features include. Spike Alert ( from 10 to 100-second warning before spike) Continues spike Alert (for double or continuous spikes at a time) supports all Boom/crash Indices M6 time frame works best here . Bigger time frame trend pointer f
Ora $ 147 (aumentando a $ 499 dopo alcuni aggiornamenti) - account illimitati (PC o MAC) Manuale utente di RelicusRoad + Video di formazione + Accesso al gruppo Discord privato + Stato VIP UN NUOVO MODO DI GUARDARE IL MERCATO RelicusRoad è l'indicatore di trading più potente al mondo per forex, futures, criptovalute, azioni e indici, fornendo ai trader tutte le informazioni e gli strumenti di cui hanno bisogno per rimanere redditizi. Forniamo analisi tecniche e piani di trading per aiutar
QUESTO INDICATORE, BASATO SULL'INTELLIGENZA ARTIFICIALE, individua i possibili punti di inversione del mercato attraverso la lettura del footprint, e segnala IN ANTICIPO dei piccoli movimenti del mercato prima che questi avvengano. A differenza degli indicatori di prezzo e di volume, che generano gli ingressi "in ritardo" ovvero quando è già avvenuta una conferma nel prezzo o del volume su un cambio di direzione, e quindi spesso il movimento si è già esaurito, questo indicatore segnala, in base
Go Way TREND
Ywsf Hsyn Hmad Alrsh
Segui la tendenza. Sì, attendi il segnale di ingresso, sia di acquisto che di vendita, su un frame di 15 minuti e controlla il segnale se appare su un frame di 30 minuti (a volte ci vuole un'ora o più prima che il segnale appaia. Puoi tornare al frame di 15 minuti e torna al frame di 30 minuti, e ripeti l'operazione finché non appare il segnale principale. Se il segnale appare sul frame di 30 minuti, entra con il prezzo e il profitto viene preso quando la linea di disegno cambia , viene registr
How to use Pair Trading Station Pair Trading Station is recommended for H1 time frame and you can use it for any currency pairs. To generate buy and sell signal, follow few steps below to apply Pair Trading Station to your MetaTrader terminal. When you load Pair Trading Station on your chart, Pair Trading station will assess available historical data in your MetaTrader platforms for each currency pair. On your chart, the amount of historical data available will be displayed for each currency pai
IVISTscalp5
Vadym Zhukovskyi
5 (5)
What's new about iVISTscalp5 forecast indicator (Version 10)? iVISTscalp5 is a unique nonlinear forecasting for a week ahead system for any financial instrument which executes fast scalping using time levels. iVISTscalp5 is a tool for easy study and understanding of financial market. 1) iVISTscalp5 forecast indicator has been completely rewritten into another programming language (C++), which has accelerated data loading and processing. As a result, a different graphical display of forecast
Bill Williams Advanced
Siarhei Vashchylka
5 (8)
Bill Williams Advanced is designed for automatic chart analysis using Bill Williams' "Profitunity" system. The indicator analyzes four timeframes at once. Manual (Be sure to read before purchasing) Advantages 1. Automatically analyzes the chart using the "Profitunity" system of Bill Williams. The found signals are placed in a table in the corner of the screen. 2. Equipped with a trend filter based on the Alligator indicator. Most of the system signals are recommended to be used only accordi
Currently, the product's selling price is over $480; however, we are offering a monthly rental system for only $30. This allows many people to enjoy and experience our products during this launch stage, which will likely lead to positive reviews from users, making it more enjoyable | We hope that if there are more than 10 positive reviews, the GOOD NEWS is that the next use will last for 3 months at a fixed price of only $30 | Take advantage of our promo opportunity, before it goes back to sell
Volatility Trend System - è un sistema di trading che fornisce segnali per le entrate. Il sistema di volatilità fornisce segnali lineari e puntuali nella direzione del trend, nonché segnali per uscirne, senza ridisegnare o ritardi. L'indicatore di tendenza monitora la direzione del trend a medio termine, mostra la direzione e il suo cambiamento. L'indicatore del segnale si basa sui cambiamenti della volatilità e mostra gli ingressi nel mercato. L'indicatore è dotato di diversi tipi di avvi
Introduction to X3 Chart Pattern Scanner X3 Cherart Pattern Scanner is the non-repainting and non-lagging indicator detecting X3 chart patterns including Harmonic pattern, Elliott Wave pattern, X3 patterns, and Japanese Candlestick patterns. Historical patterns match with signal patterns. Hence, you can readily develop the solid trading strategy in your chart. More importantly, this superb pattern scanner can detect the optimal pattern of its kind. In addition, you can switch on and off individu
Native Channels
BeeXXI Corporation
5 (1)
This indicator recognizes all support and resistance levels. A number of unique high-performance techniques have been applied, which made the existence of this indicator possible. All formed channels are naturally visible: horizontal linear linear parabolic cubic (Polynomial 3 degrees - Wave) This is due to a bundle of approximating channels. The formed channels form "standing waves" in a hierarchical sequence. Thus, all support and resistance levels are visible. All parameter management is
Piranha version 2
Maria Strudov
5 (1)
"Piranha" - an autonomous trading system that determines overbought and oversold levels on the chart. Red and blue zones represent overbought and oversold levels respectively. Entry points are marked with arrows: a downward arrow in the red zone for "sell" and an upward arrow in the blue zone for "buy". The Take profit level is indicated by the green moving average. Key features: Adjusting the Take profit level as the green moving average changes position. Averaging ability when a new market e
SMCpro
Arief
5 (1)
Currently Price  20% OFF  ( for unlimited use ) Indicator   USER MANUAL , trade setups, solving issues, etc :  Direct Download Here     (  for users only  ) Hello World! Introducing.. SMCpro tool and Indicator for  MetaTrader 5 , a cutting-edge feature designed to revolutionize your trading experience. With innovative ICT Smart Money Concept, you gain unparalleled insight into market dynamics, empowering you to make informed trading decisions like never before. SMC Indicator built on th
The iChannels
BeeXXI Corporation
5 (2)
Ultra-fast recognition of parabolic channels (as well as linear, horizontal and wavy channels) throughout the depth of history, creating a hierarchy of channels. Required setting: Max bars in chart: Unlimited This indicator is designed primarily for algorithmic trading, but can also be used for manual trading.  This indicator will have a very active evolution in the near future and detailed descriptions on how to apply to create robots
Introducing the Power Trade Plus indicator designed by a small group of traders with a few years of experience trading the market profitably.  The Power Trade Plus is derived from the Power Trade indicator,  the indicator strive in powerful sniper entries and take profit levels,  with an algorithm that's can determine the markets volatility and Provides entries based on the current market volatility. This indicator is much more effective in stock ,currencies and indices.
Introducing the South African Sniper indicator created by a small group of traders with a few years trading trading the financial market profitably . This is a plug and play indicator that provides you with  BUY and SELL (SNIPER ENTRY) signals with TARGET and trail stops. The indicator Works with all MT5 trading instruments. The indicator uses previous  chart data as receipt to speculate on future market moves.  "The South African Sniper indicator community are very happy with the indicator an
Innanzitutto, è importante sottolineare che questo sistema di trading è un indicatore non repainting, non redrawing e non lagging, il che lo rende ideale per il trading professionale. Corso online, manuale utente e demo. Il "Sistema di Trading di Supporto e Resistenza Intelligente" è un indicatore avanzato progettato per trader nuovi ed esperti. Permette ai trader di ottenere precisione e fiducia sul mercato forex. Questo sistema completo combina più di 7 strategie, 10 indicatori e varie approc
Golden Gate Algo MT5
James David Lane
4 (6)
40% DI SCONTO PER NATALE! AUMENTO DEL PREZZO A $250 IL 1 GENNAIO! Presentiamo GoldenGate Entries: una soluzione di trading all'avanguardia! Scopri un approccio rivoluzionario al trading con GoldenGate Entries (GGE), un indicatore avanzato progettato per migliorare la tua esperienza di trading. GGE offre un set completo di funzionalità per fornire agli utenti precisione e fiducia nelle loro decisioni di trading. Coppie: Qualsiasi (FX - Materie prime - Azioni - Azioni - Cripto) TimeFrame
Elliott Wave Trend was designed for the scientific wave counting. This tool focuses to get rid of the vagueness of the classic Elliott Wave Counting using the guideline from the template and pattern approach. In doing so, firstly Elliott Wave Trend offers the template for your wave counting. Secondly, it offers Wave Structural Score to assist to identify accurate wave formation. It offers both impulse wave Structural Score and corrective wave Structure Score. Structural Score is the rating to sh
Altri dall’autore
Box Weis Wave
Thalles Nascimento De Carvalho
5 (1)
Eleva la tua analisi con Weis Wave Box! Se stai cercando precisione e chiarezza nel tuo trading, Weis Wave Box è lo strumento che fa per te. Questo indicatore avanzato offre un'analisi visiva dettagliata delle onde di volume e dei punti di swing, aiutandoti a comprendere meglio la relazione tra sforzo e risultati nel mercato. Caratteristiche principali di Weis Wave Box: Onde di Volume Personalizzabili: Regola le onde di volume in tick per adattarle alle tue strategie di trading. Stori
AI Channel
Thalles Nascimento De Carvalho
4 (4)
Welcome to the presentation of the AI Channel indicator, a powerful tool that uses artificial intelligence for price channel analysis in the financial market. In this session, we will explore how this revolutionary indicator can assist investors and traders in making more informed and strategic decisions. Let's get started! I. What is the AI Channel indicator? AI Channel is an indicator developed based on advanced artificial intelligence algorithms. It utilizes historical price data of financial
FREE
Cumulative Volume Bands
Thalles Nascimento De Carvalho
CVB Cumulative Volume Bands: Potenzia le tue operazioni con il volume accumulato! CVB Cumulative Volume Bands è un indicatore avanzato progettato per i trader che cercano segnali precisi basati sul volume accumulato. Utilizzando bande di volume accumulato, questo indicatore offre letture chiare delle pressioni di acquisto e vendita nel mercato, aiutando a identificare inversioni e forti movimenti dei prezzi. Cumulative Volume Bands for MT5 ! Caratteristiche principali: Analis
FREE
Swing Point Volume
Thalles Nascimento De Carvalho
Swing Point Volume, the indicator that signals weakness and strength at the tops and bottoms. This indicador can be for used the Wyckoff Method. Information provided; - Swing on customized ticks. - Volume and points in each balance sheet. - Percentage of Displacement. - Sound alert option on top and bottom breaks. - Volume in ticks and Real Volume. - Volume HL (extreme) or (opening and closing) - Customized volume shapes.
Atr Projection
Thalles Nascimento De Carvalho
L'indicateur ATR Projeção se distingue comme un outil robuste dans l'analyse technique, conçu pour fournir des informations précises sur les limites potentielles des mouvements de prix sur les marchés financiers. Son approche flexible permet aux utilisateurs de personnaliser de manière intuitive les métriques d'analyse, en s'adaptant aux besoins spécifiques de chaque actif négocié. Fonctionnement personnalisable : Par défaut, l'ATR Projeção fonctionne en considérant 30 % de la moyenne des
Long Short Pro
Thalles Nascimento De Carvalho
Indicatore Long & Short - Versione Pro: Sblocca il Potenziale Illimitato della Tua Analisi di Mercato! Nessuna Limitazione per Qualsiasi Attivo La versione Pro dell’indicatore Long & Short ti offre la libertà totale di utilizzarlo su qualsiasi strumento finanziario. Niente più limitazioni – applica lo stesso indicatore a tutti i tuoi attivi preferiti! Senza Limitazioni Approfitta di tutte le funzionalità dell’indicatore senza alcuna restrizione. La versione Pro offre un’esperienza
Didi Index Volume
Thalles Nascimento De Carvalho
Presentiamo il Didi Index Volume, un indicatore di analisi tecnica sviluppato dal trader brasiliano Odir Aguiar, che si distingue per il suo approccio avanzato e potente nell'individuazione delle opportunità nei mercati finanziari. Disponibile su diverse piattaforme, il Didi Index Volume è diventato uno strumento essenziale per i trader che cercano informazioni precise e preziose per le loro strategie di trading. L'indicatore combina il rinomato Didi Index, creato da Odir Aguiar, con l'intell
Smart Binary Volume
Thalles Nascimento De Carvalho
L'indicatore Smart Binary Volume è uno strumento versatile che combina l'analisi del volume di trading con l'apprendimento automatico (machine learning). Può essere applicato su diversi mercati e strategie, inclusi lo scalping e altre tipologie di trading a breve termine. Utilizzando algoritmi avanzati di machine learning, l'indicatore identifica pattern complessi, generando segnali di acquisto e vendita più precisi. Buffer to Create EA. Buffer Line Gold = 0. Buffer Line Red = 2 Buffer   AI 
TimeChannel
Thalles Nascimento De Carvalho
The "Timechannel" is a powerful technical analysis tool designed specifically for traders who want to gain deeper and more accurate insights into price movements across multiple timeframes (multi-timeframe). This indicator is an essential addition to the toolbox of any serious trader seeking to make informed and data-driven trading decisions. Key Features: Advanced Multi-Timeframe Analysis : Timechannel allows traders to analyze price movements on different timeframes simultaneously. This is cr
Big Player Range
Thalles Nascimento De Carvalho
5 (2)
Scopri la Potenza di "BigPlayerRange": Il Tuo Alleato nell'Analisi Tecnica del Mercato Presentiamo BigPlayerRange , uno strumento avanzato di analisi tecnica progettato per rivelare le aree di interesse degli investitori istituzionali sul mercato. Con questo strumento, potrai identificare con precisione dove i principali attori sono attivamente coinvolti e comprendere come ciò possa influenzare le tue strategie di trading. Caratteristiche Principali: Mappatura delle Aree di Interesse Istitu
Master OBV
Thalles Nascimento De Carvalho
MasterOBV: Domina le Tendenze di Mercato con Precisione! MasterOBV è un indicatore di analisi tecnica che combina volume , correlazione positiva e una Media Mobile (MA) per affinare l'identificazione delle tendenze sui mercati finanziari. Funzionalità Principali: Volume Intelligente: Analizza il volume delle transazioni per identificare cambiamenti significativi nella forza della tendenza. Correlazione Positiva: Include asset correlati per ottenere una visione più ampia e precisa, ra
Smart Delta Volume
Thalles Nascimento De Carvalho
Smart Delta Volume: Preciso e Adattabile alle Condizioni Dinamiche del Mercato Smart Delta Volume è un indicatore tecnico avanzato progettato per offrire un'analisi precisa e adattabile in un ambiente di mercato in continua evoluzione. Utilizzando livelli dinamici che si regolano automaticamente in base alla volatilità, questo indicatore fornisce una visione più completa e affidabile dell'interazione tra flusso di volume e azione dei prezzi. Questa capacità di adattamento è cruciale per i tra
VolaMetrics VSA
Thalles Nascimento De Carvalho
VolaMetrics VSA | Un Potente Alleato nell'Analisi Tecnica Il VolaMetrics VSA è un indicatore di analisi tecnica che combina il metodo Volume Spread Analysis (VSA) con un'analisi dettagliata del volume delle transazioni . Progettato per identificare e tracciare i movimenti significativi dei prezzi , il VolaMetrics VSA utilizza l'interazione tra volume e spread dei prezzi per fornire intuizioni preziose che possono aiutare nelle decisioni di trading. Fondamenti della Volume Spread Analysis (VSA
CVD SmoothFlow Pro
Thalles Nascimento De Carvalho
CVD SmoothFlow Pro - Analisi del Volume Illimitata per Qualsiasi Attivo! CVD SmoothFlow Pro è la soluzione definitiva per i trader che cercano un'analisi del volume precisa e illimitata. Utilizzando il calcolo del Cumulative Volume Delta (CVD) con filtraggio avanzato del rumore, la versione Pro offre la flessibilità e la precisione necessarie per operare su qualsiasi strumento finanziario. Cosa offre CVD SmoothFlow Pro? Analisi Chiara : Filtra il rumore di mercato e mette in risalto i movi
VolumeSecret
Thalles Nascimento De Carvalho
VolumeSecret: Il Potere del Volume nelle Tue Mani Nel mondo sfidante della programmazione, affrontiamo costantemente ostacoli che ci spingono a crescere e ad evolverci. Comprendiamo profondamente le difficoltà imposte dal mercato e come i trader lottano per raggiungere le migliori performance. Per questo motivo, lavoriamo instancabilmente su soluzioni innovative per rendere la presa di decisioni sul mercato più fluida e precisa. VolumeSecret è il risultato di questo impegno. Si tratta di un indi
Cumulative Vol Bands
Thalles Nascimento De Carvalho
CVB Cumulative Volume Bands: Potenzia le tue operazioni con il volume accumulato! CVB Cumulative Volume Bands è un indicatore avanzato progettato per i trader che cercano segnali precisi basati sul volume accumulato. Utilizzando bande di volume accumulato, questo indicatore offre letture chiare delle pressioni di acquisto e vendita nel mercato, aiutando a identificare inversioni e forti movimenti dei prezzi. Caratteristiche principali: Analisi del Volume Accumulato : Rileva i punt
ZigWave Oscillator
Thalles Nascimento De Carvalho
ZigWave Oscillator: Potenzia le tue operazioni con oscillatori e ZigZag! Il ZigWave Oscillator è lo strumento perfetto per i trader che cercano precisione e chiarezza nell'analisi del mercato finanziario. Questo indicatore combina la forza degli oscillatori con la semplicità visiva dello ZigZag, aiutandoti a identificare le migliori opportunità di acquisto e vendita con rapidità ed efficienza. Perché scegliere il ZigWave Oscillator? Analisi precisa degli oscillatori : Integra RSI, Will
Filtro:
Nessuna recensione
Rispondi alla recensione
Versione 1.5 2024.09.13
Improvement in delta calculation and better hardware management!
Versione 1.4 2024.08.16
Revisão para melhor compatibilidade com EA
Versione 1.3 2024.08.16
add buffers para os swings
Versione 1.1 2024.08.14
Atualização na função "all volumes"