Ma Speedometer Dashboard
- Indicatori
- Davit Beridze
- Versione: 1.0
- Attivazioni: 5
La versione demo non è utile. Non capirai nulla guardando i numeri lampeggianti. Questo è un dashboard. Cerca di capire il concetto e ti aiuterò per il resto.
I simboli devono essere separati da virgole (,) ed essere inseriti nei parametri esattamente come visualizzati dal tuo broker, in modo che vengano riconosciuti nel dashboard. Questi simboli verranno utilizzati per l'analisi da parte dell'indicatore.
Con un solo clic puoi aprire qualsiasi coppia di valute e qualsiasi intervallo di tempo direttamente dal dashboard.
Il MA Speedometer Dashboard è un indicatore altamente funzionale per MetaTrader 4 (MT4) progettato per migliorare le strategie di trading attraverso un'analisi dinamica del mercato. Offre potenti funzionalità per identificare le tendenze di mercato, operare su mercati laterali e uscire da condizioni di mercato piatte, il tutto basato sugli angoli delle medie mobili. Come offerta speciale, i clienti ricevono anche una versione speciale dell'indicatore MA Speedometer, che serve come base per il dashboard.
Caratteristiche principali:
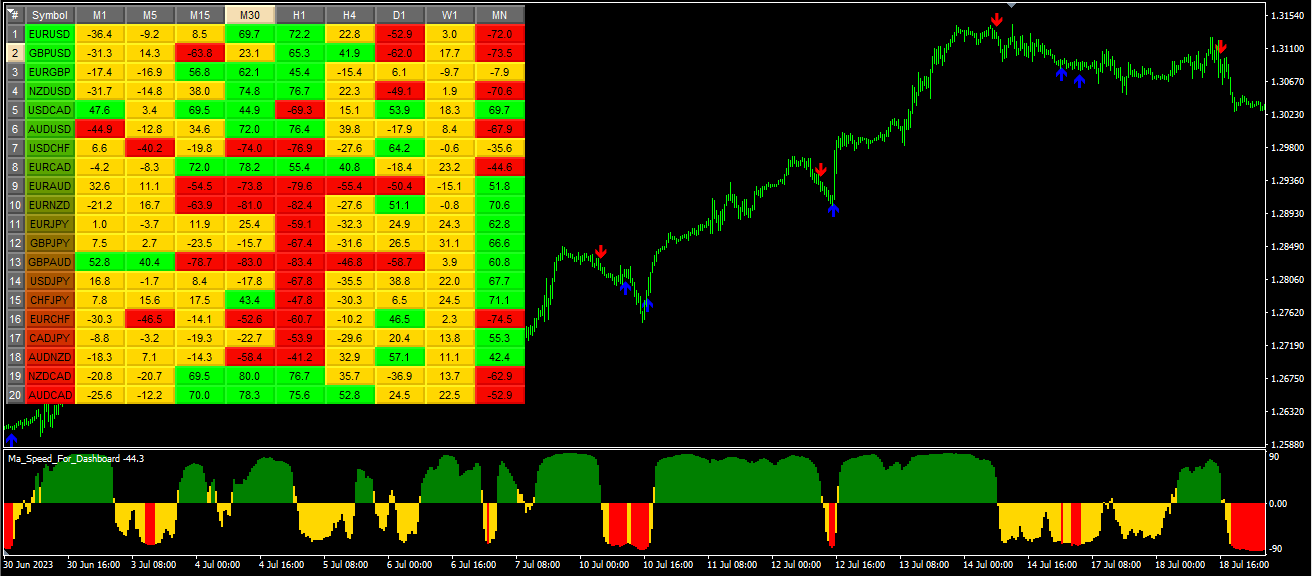
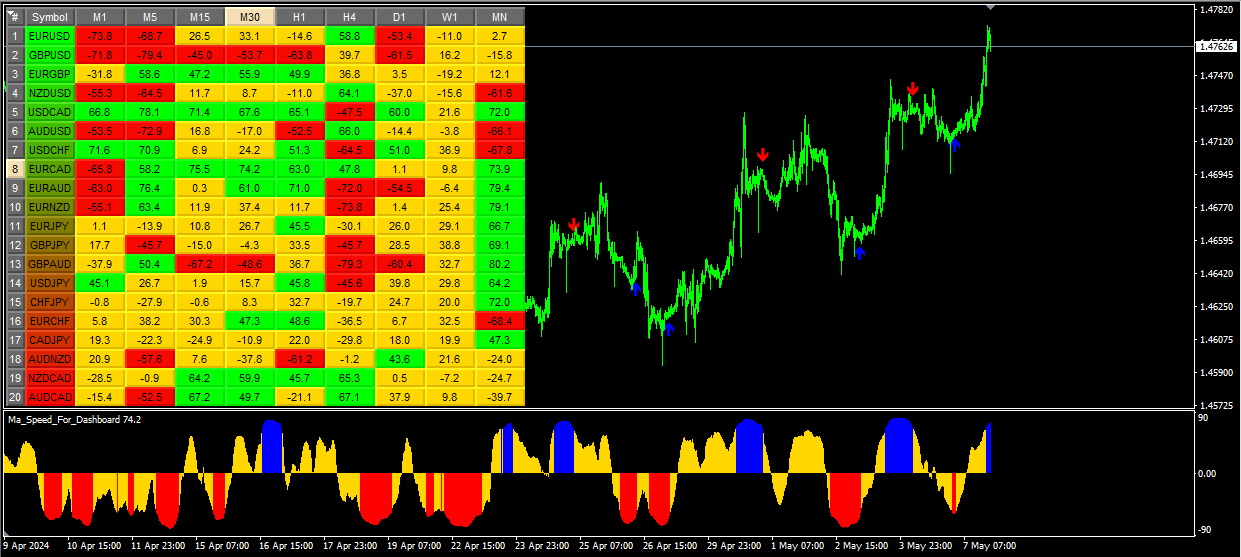
Analisi delle tendenze: Il dashboard utilizza gli angoli delle medie mobili (MA) per rilevare potenziali tendenze di mercato. I trader possono individuare facilmente l'inizio di forti tendenze rialziste o ribassiste attraverso segnali colorati:
- Verde: Indica l'inizio di una forte tendenza rialzista, offrendo un'opportunità di ingresso.
- Rosso: Indica l'inizio di una forte tendenza ribassista, offrendo anche un'opportunità di ingresso.
- Giallo: Segnala mercati laterali o piatti, suggerendo potenziali punti di uscita.
Monitoraggio multi-temporale: Il dashboard supporta diversi intervalli di tempo, da M1 a MN, permettendo ai trader di analizzare le condizioni di mercato sia a livello micro che macro. Questa funzione è utile per diversi stili di trading, inclusi il day trading e gli investimenti a lungo termine.
Dashboard interattivo: L'interfaccia interattiva consente ai trader di passare rapidamente tra diverse coppie di valute e intervalli di tempo. Facendo clic sul dashboard, MT4 apre automaticamente un grafico per la coppia di valute e l'intervallo di tempo selezionati, migliorando l'usabilità e l'efficienza.
Parametri personalizzabili: I trader possono personalizzare il periodo delle medie mobili, il metodo e le soglie degli angoli per allineare il dashboard con le loro strategie di trading preferite. Questa flessibilità rende lo strumento adattabile a diverse condizioni di mercato e approcci di trading.
Avvisi visivi: Il design intuitivo del dashboard include avvisi visivi e etichette facili da leggere per le diverse condizioni di mercato. Questa funzionalità migliora la consapevolezza della situazione, aiutando i trader a prendere decisioni informate rapidamente.
Offerta speciale: Come offerta speciale, i clienti ricevono una versione unica dell'indicatore MA Speedometer in regalo. Questo indicatore costituisce la base del dashboard e consente un'analisi ancora più dettagliata.
Descrizione di ogni parametro di input:
- Symbols: Questo parametro è un input stringa in cui puoi specificare un elenco di simboli separati da virgole (,). Questi simboli saranno utilizzati per l'analisi dall'indicatore.
- StartBar: Questo parametro è un input numerico che rappresenta la barra di partenza per calcolare l'angolo della media mobile.
- MaPeriod: Questo parametro è un input numerico che rappresenta il periodo utilizzato per calcolare la media mobile.
- MaMethod: Questo parametro è un input enumerativo che rappresenta il metodo utilizzato per calcolare la media mobile. Può assumere valori dall'enumerazione ENUM_MA_METHOD, che probabilmente include opzioni come la Media Mobile Semplice (SMA), la Media Mobile Esponenziale (EMA), ecc.
- Level_Up_M1 a Level_Dn_MN1: Questi parametri sono input numerici che rappresentano i livelli superiori e inferiori per diversi intervalli di tempo (da M1 a MN1). Sono utilizzati per determinare il colore di sfondo dei pulsanti in base all'angolo della media mobile.
- X-Size e Y-Size: Questi parametri sono input numerici che rappresentano rispettivamente la larghezza e l'altezza dei pulsanti.
Riassunto: Il MA Speedometer Dashboard offre ai trader uno strumento completo per l'analisi del mercato, adatto sia ai trader di tendenza che a quelli che preferiscono mercati laterali. La sua flessibilità, l'interfaccia interattiva e i parametri personalizzabili lo rendono un'aggiunta preziosa a qualsiasi kit di strumenti di trading, aiutando a navigare con maggiore precisione e comprensione nelle complessità del mercato Forex.


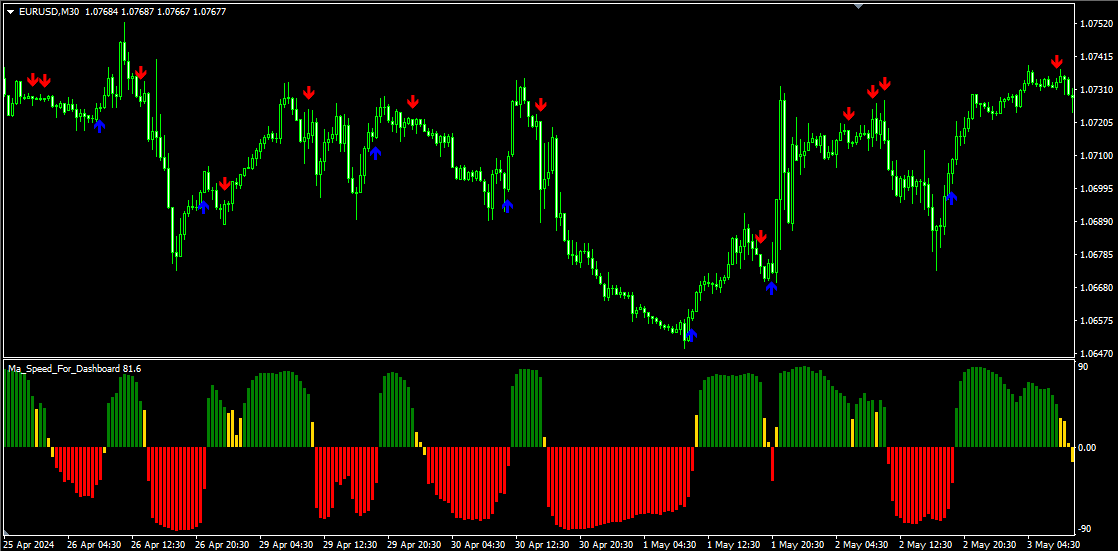


Great dashboard based on the innovative idea of MA angle changes on various instruments desired. The steeper the MA angle, the greater the momentum. Find the instruments with best momentum. Very clever idea. The bonus indicator is very helpful and gives great signals based on the same concept of MA angles, fully customizable.