• Panoramica
  • Recensioni
  • Commenti
  • Novità

Master OBV

🚀 MasterOBV: Domina le Tendenze di Mercato con Precisione!

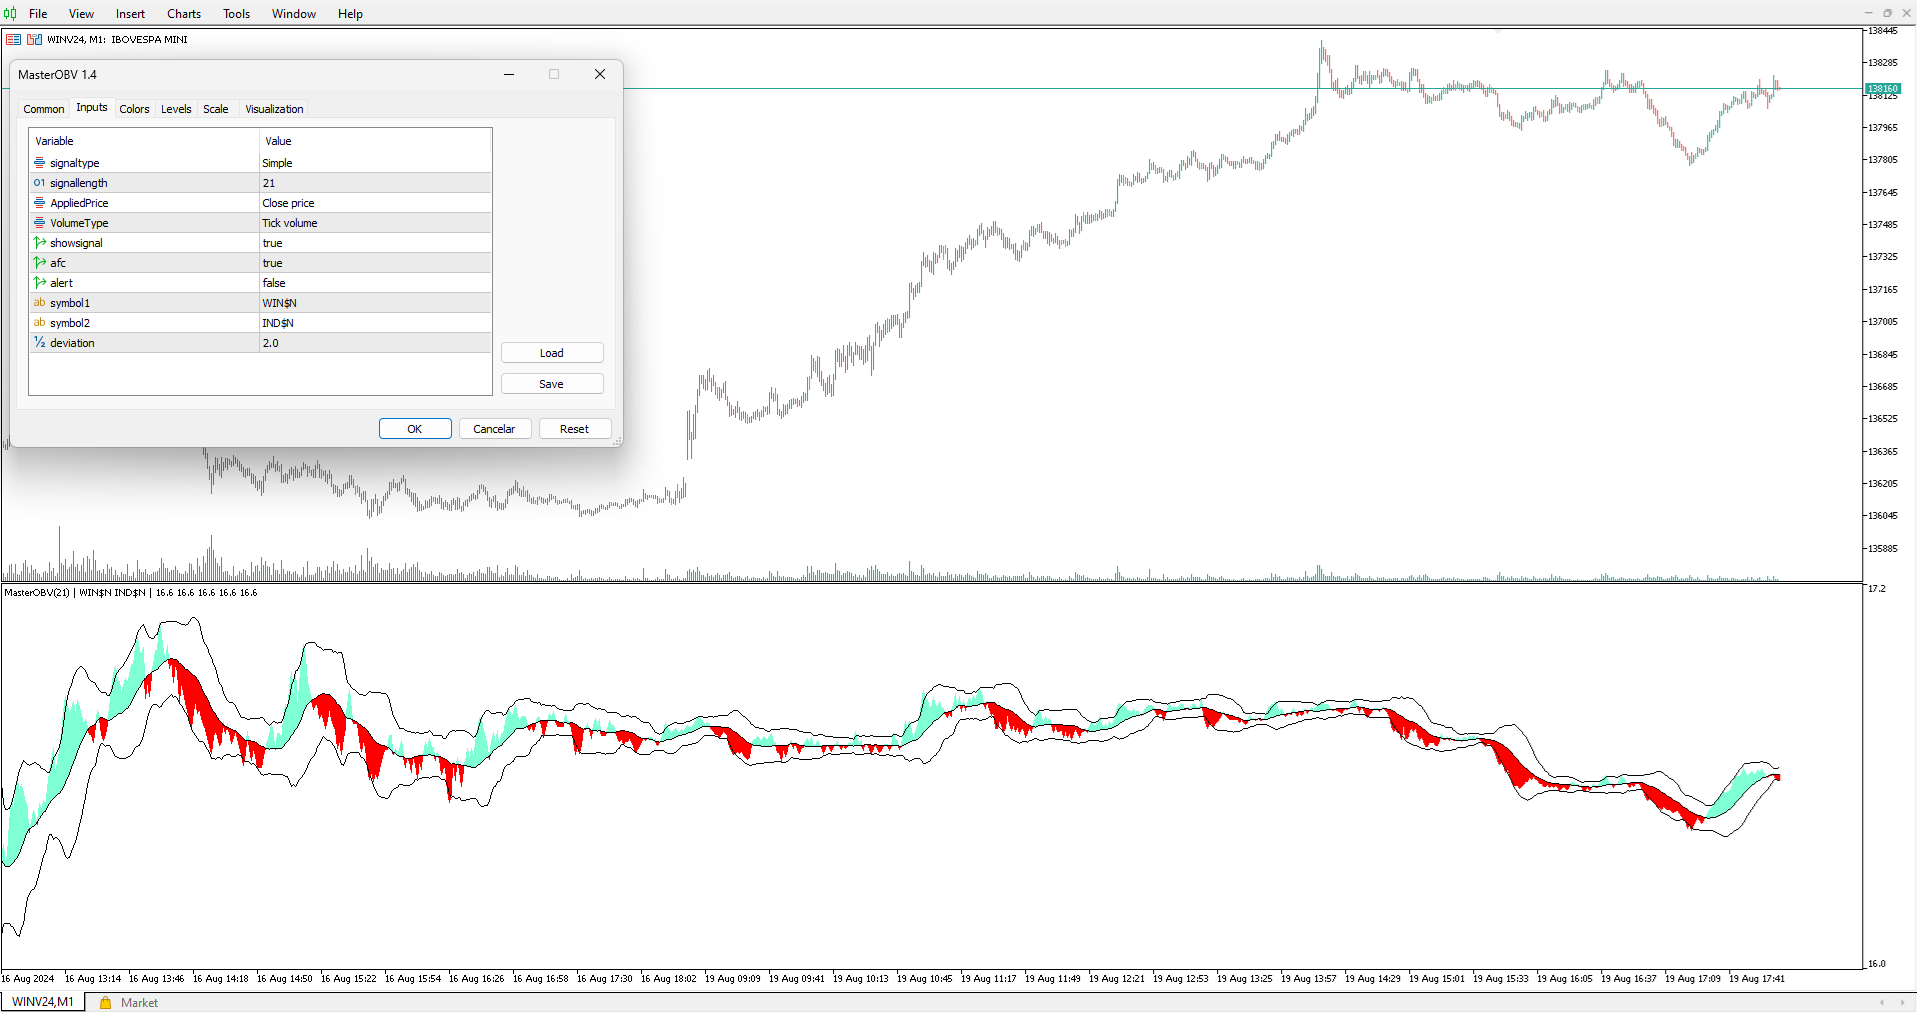
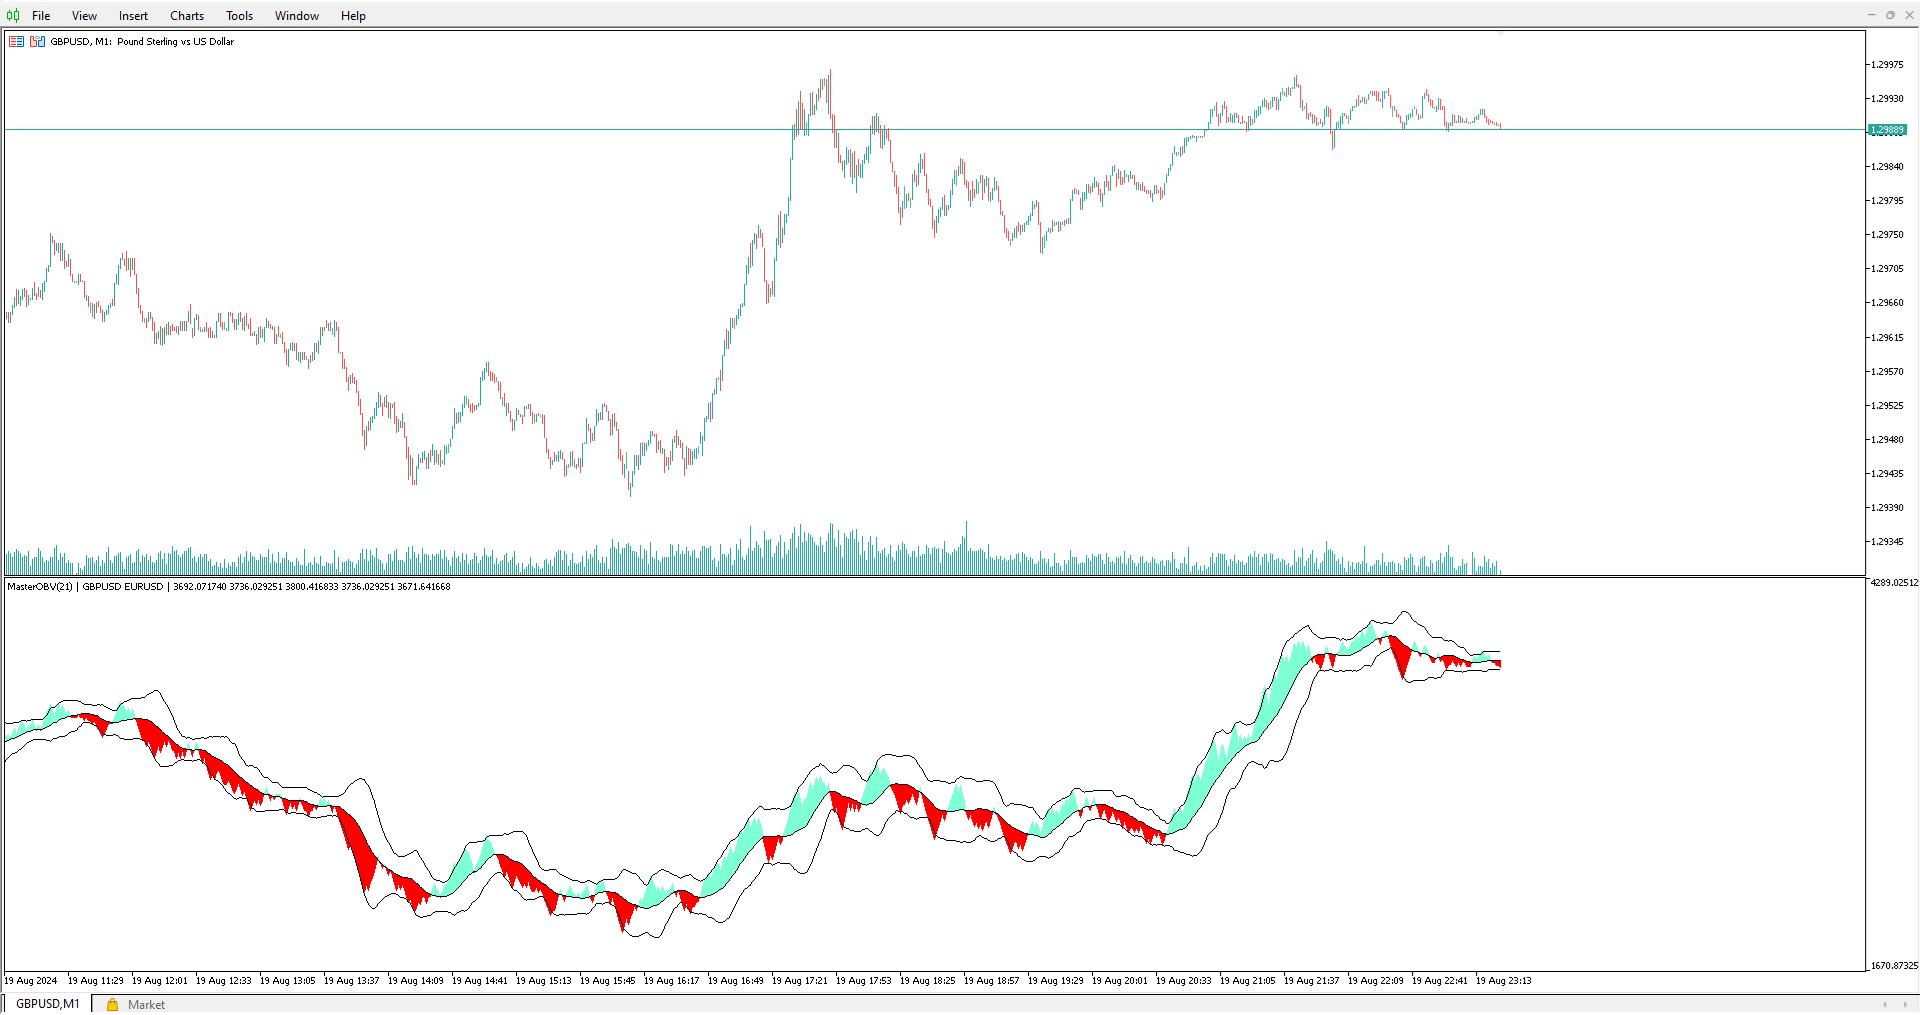
MasterOBV è un indicatore di analisi tecnica che combina volume, correlazione positiva e una Media Mobile (MA) per affinare l'identificazione delle tendenze sui mercati finanziari.

🔍 Funzionalità Principali:

  • 📊 Volume Intelligente: Analizza il volume delle transazioni per identificare cambiamenti significativi nella forza della tendenza.
  • 🔗 Correlazione Positiva: Include asset correlati per ottenere una visione più ampia e precisa, rafforzando il potenziale di spostamento del prezzo basato sul volume delle coppie.
  • 📈 Canali Visivi: Utilizza canali visivi per valutare il potenziale di continuazione e inversione delle tendenze con chiarezza e precisione, offrendo un'analisi visiva intuitiva.
  • 📉 Media Mobile Livellata: La MA smussa le fluttuazioni dei prezzi, facilitando l'identificazione della direzione della tendenza sottostante.

🎯 Perché Scegliere MasterOBV?

  • Fiducia nelle Decisioni: Integra più fattori per permetterti di prendere decisioni di ingresso e uscita con sicurezza.
  • 🌐 Analisi Completa: Considera non solo il prezzo, ma anche il volume, la correlazione degli asset e i canali visivi, offrendo una visione completa del mercato.
  • 🚀 Potenziale di Spostamento del Prezzo: L'uso di coppie correlate che si muovono nella stessa direzione rafforza le opportunità di spostamento del prezzo, massimizzando l'impatto delle tue strategie di trading.

🔗 Accedi alla versione illimitata qui


Prodotti consigliati
Rocket Trend
Andriy Sydoruk
The Rocket Trend indicator is trending. The indicator draws two-color points connected by lines along the chart. This is a trend indicator, it is an algorithmic indicator. It is easy to work and understand when a blue circle appears, you need to buy, when a red one appears, sell. The indicator is used for scalping and pipsing, and has proven itself well. Rocket Trend is available for analyzing the direction of the trend for a specific period of time. Ideal for novice traders learning the laws o
TrendDetect
Pavel Gotkevitch
The Trend Detect indicator combines the features of both trend indicators and oscillators. This indicator is a convenient tool for detecting short-term market cycles and identifying overbought and oversold levels. A long position can be opened when the indicator starts leaving the oversold area and breaks the zero level from below. A short position can be opened when the indicator starts leaving the overbought area and breaks the zero level from above. An opposite signal of the indicator can
KT Horizontal Lines MT5
KEENBASE SOFTWARE SOLUTIONS
In MetaTrader, plotting multiple   horizontal lines   and then tracking their respective price levels can be a hassle. This indicator automatically plots multiple horizontal lines at equal intervals for setting price alerts, plotting support and resistance levels, and other manual purposes. This indicator is suitable for Forex traders who are new and looking for chances to make quick profits from buying and selling. Horizontal lines can help traders find possible areas to start trading when the
To download MT4 version please click here . This is the exact conversion from TradingView: "WaveTrend [LazyBear]" By "zeusuk3". One of the coolest indicators out there to detect overbought and oversold zones. It can be used as a part of more complicated strategy and for confirming a potential trade setup. There are buffers to use in EAs also. The indicator is loaded light and non-repaint. - You can message in private chat for further changes you need. Thanks for downloading 
Esplora modelli per modelli a triangolo come triangolo simmetrico, triangolo asimmetrico o triangolo ad angolo retto, modello a cuneo come cuneo ascendente o cuneo discendente, modello di espansione e canale di tendenza Questo indicatore esplora il modello storico così come i modelli attuali, è il miglior indicatore per coloro che stanno cercando di risparmiare tempo disegnando manualmente una linea di tendenza o un triangolo e vogliono usarlo per l'analisi automatizzata del tracciamento dei
Indicatore per determinare flat e trend. Se il prezzo è inferiore a uno qualsiasi dei due istogrammi e delle due linee (rossa e blu), questa è una zona di vendita. Quando acquisti questa versione dell'indicatore, versione MT4 per un conto reale e uno demo - in regalo (per ricevere, scrivimi un messaggio privato)! Se il prezzo è al di sopra di uno dei due istogrammi e delle due linee (rossa e blu), questa è una zona di acquisto. Versione MT4: https://www.mql5.com/en/market/product/3793 S
Was: $249  Now: $99   Market Profile defines a number of day types that can help the trader to determine market behaviour. A key feature is the Value Area, representing the range of price action where 70% of trading took place. Understanding the Value Area can give traders valuable insight into market direction and establish the higher odds trade. It is an excellent addition to any system you may be using. Inspired by Jim Dalton’s book “Mind Over Markets”, this indicator is designed to suit the
The Antique Trend Indicator is a revolutionary trend trading and filtering solution with all the important features of a trend tool built into one tool! The Antique Trend indicator is good for any trader, suitable for any trader both for Forex and binary options. There is no need to configure anything, everything has been perfected by time and experience, it works great during flats and trends. The Antique Trend indicator is a tool for technical analysis of financial markets, reflecting curre
Fibrillar
Vitalii Zakharuk
It is very easy to use the Fibrillar indicator, since the simplest is to look at the chart and act according to the indications of the colored arrows. The algorithm takes into account the measurement of prices, and this method also focuses on measuring each of the price drops (H / C, H / O, LC, LO) - which gives more detailed information, but also more averaged. When calculating this indicator, logarithmic gains are first calculated at the closing price, which allows you to filter out the tre
Pullback Hunter
Anton Polkovnikov
PULLBACK HUNTER What is every trader's cherished dream? To see without delay the places where the reversal will happen. This, of course, is from the category of magic, though... nothing is impossible. But for now I've prepared for you an indicator that marks in real time the end of corrections to the current movement or in short - catches pullbacks.What is the main point? Many people practice rebounds when the price moves in the direction of the open position. And they do them on the formation o
The Supernova Momentums indicator simplifies the visual perception of the price chart and reduces the time for analysis: if there is no signal, the deal is not opened, and if an opposite signal appears, it is recommended to close the current position. This arrow indicator is designed to determine the trend. Supernova Momentums implements a trend trading strategy, filters out market noise, and includes all the necessary features in one tool. Its work is based on automatically determining the c
Liquidity Oscillator
Paolo Scopazzo
5 (1)
A powerful oscillator that provide Buy and Sell signals by calculating the investor liquidity. The more liquidity the more buy possibilities. The less liquidity the more sell possibilities. Please download the demo and run a backtest! HOW IT WORKS: The oscillator will put buy and sell arrow on the chart in runtime only . Top value is 95 to 100 -> Investors are ready to buy and you should follow. Bottom value is 5 to 0 -> Investors are ready to sell and you should follow. Alert + sound will app
Your Trend Friend
Luigi Nunes Labigalini
5 (1)
The trend is your friend! Look at the color of the indicator and trade on that direction. It does not  repaint. After each candle is closed, that's the color of the trend. You can focus on shorter faster trends or major trends, just test what's most suitable for the symbol and timeframe you trade. Simply change the "Length" parameter and the indicator will automatically adapt. You can also change the color, thickness and style of the lines. Download and give it a try! There are big movements
Best SAR MT5
Ashkan Hazegh Nikrou
5 (1)
Descrizione:  siamo felici di presentare il nostro nuovo indicatore gratuito basato su uno degli indicatori professionali e popolari nel mercato forex (PSAR) questo indicatore è una nuova modifica sull'indicatore SAR parabolico originale, nell'indicatore pro SAR puoi vedere l'incrocio tra i punti e il grafico dei prezzi, questo il crossover non è un segnale ma parla del potenziale di fine movimento, puoi iniziare a comprare con un nuovo punto blu e posizionare lo stop loss un atr prima del pr
FREE
Upgraded - Stars added to indentify Areas you can scale in to compound on your entry  when buying or selling version 2.4 Upgraded Notifications and alerts added version 2.3 *The indicator is suitable for all pairs fromm  Deriv pairs (Vix,jump,boom & crash indices) , Currencies, cryptos , stocks(USA100, USA30 ), and metals like gold etc. How does it work? Increasing the period make it more stable hence will only focus on important entry points However  lowering the period will mean the indica
Questo indicatore ti mostrerà i valori TP e SL (in quella valuta) che hai già impostato per ogni ordine sui grafici (chiuso alla riga della transazione/ordine) che ti aiuteranno molto a stimare il tuo profitto e la tua perdita per ogni ordine. E ti mostra anche i valori PIP. il formato mostrato è "Valori valutari dei nostri profitti o perdite / valori PIP". Il valore TP sarà mostrato in colore verde e il valore SL sarà mostrato in colore rosso. Per qualsiasi domanda o ulteriori informazioni,
Provided Trend is a complex signal formation indicator. As a result of the work of internal algorithms, you can see only three types of signals on your chart. The first is a buy signal, the second is a sell signal, and the third is a market exit signal. Options: CalcFlatSlow - The first parameter that controls the main function of splitting the price chart into waves. CalcFlatFast - The second parameter that controls the main function of splitting the price chart into waves. CalcFlatAvg - Par
The indicator determines the state of the market: trend or flat. The state of the market is determined by taking into account volatility. The flat (trading corridor)is displayed in yellow. The green color shows the upward trend. The red color shows the downward trend. The height of the label corresponds to the volatility in the market. The indicator does not redraw . Settings History_Size   - the amount of history for calculation. Period_Candles  - the number of candles to calculate the
ZigZag with Fibonacci
Rafael Caetano Pinto
This indicator uses the metaquotes ZigZag indicator as base to plot fibonacci extension and fibonacci retracement based in the Elliot waves. A fibonacci retracement will be plotted on every wave draw by the ZigZag. A fibonacci extension will be plotted only after the 2nd wave. Both fibonacci will be updated over the same wave tendency. Supporting until 9 consecutive elliot waves. Parameters: Depth: How much the algorithm will iterate to find the lowest and highest candles Deviation: Amoun
True Day
Aurthur Musendame
5 (1)
True Days is a tool designed specifically for the trader who wants to catch intraday volatility in price charts.  True day makes it easier for the trader to avoid trading in the dead zone - a period in time where markets are considered dead or non volatile. The trader can concentrate on finding opportunities only during periods of profound market movements. By default the indicator gives you a true day starting at 02:00 to 19:00 hours GMT+2. You can adjust according to your Time Zone. By deafult
FREE
Il livello Premium è un indicatore unico con una precisione superiore all'80% delle previsioni corrette! Questo indicatore è stato testato dai migliori Specialisti di Trading per più di due mesi! L'indicatore dell'autore che non troverai da nessun'altra parte! Dagli screenshot puoi vedere di persona la precisione di questo strumento! 1 è ottimo per il trading di opzioni binarie con un tempo di scadenza di 1 candela. 2 funziona su tutte le coppie di valute, azioni, materie prime, cript
ACB Breakout Arrows MT5
KEENBASE SOFTWARE SOLUTIONS
5 (1)
The ACB Breakout Arrows indicator provides a crucial entry signal in the market by detecting a special breakout pattern. The indicator constantly scans the chart for a settling momentum in one direction and provide the accurate entry signal right before the major move. Get multi-symbol and multi-timeframe scanner from here - Scanner for ACB Breakout Arrows MT 5 Key features Stoploss   and Take Profit levels are provided by the indicator. Comes with a MTF Scanner dashboard which tracks the br
Il nostro indicatore   Basic Support and Resistance   è la soluzione necessaria per aumentare l'analisi tecnica.Questo indicatore consente di proiettare i livelli di supporto e resistenza sul grafico/ MT4 gratuita Funzionalità Integrazione dei livelli di Fibonacci: Con la possibilità di visualizzare i livelli di Fibonacci insieme a livelli di supporto e resistenza, il nostro indicatore ti dà una visione ancora più profonda del comportamento del mercato e delle possibili aree di inversione.
The new update makes this indicator a complete tool for studying, analyzing and operating probabilistic patterns. It includes: On-chart Multi-asset percentage monitor. Configurable martingales. Twenty-one pre-configured patterns, including Mhi patterns and C3. An advanced pattern editor to store up to 5 custom patterns. Backtest mode to test results with loss reports. Trend filter. Hit operational filter. Martingale Cycles option. Various types of strategies and alerts. Confluence between patter
ATrend
Zaha Feiz
4.75 (4)
"ATREND: Come funziona e come utilizzarlo" ### Come funziona L'indicatore "ATREND" per la piattaforma MT5 è progettato per fornire ai trader robusti segnali di acquisto e vendita utilizzando una combinazione di metodologie di analisi tecnica. Questo indicatore sfrutta principalmente l'Average True Range (ATR) per la misurazione della volatilità, insieme ad algoritmi di individuazione dei trend per identificare potenziali movimenti di mercato. Lascia un messaggio dopo l'acquisto e ricevi un rega
Medias colors
Sergio Domingues
O indicador media colors se baseia num canal que pode ser criado a partir de duas médias Media colors  é um indicador de tendência utilizado no trading para identificar a direção predominante do mercado. Pode ser baseado na Média Móvel Simples (SMA) e na  Média Móvel Exponencial  (EMA) que dá mais peso aos preços mais recentes, tornando-a mais sensível às mudanças de preço. Como Funciona: Cálculo:   A EMA é calculada aplicando um fator de suavização aos preços de fechamento de um ativo financeir
The Riko Trend indicator is a revolutionary trend trading and filtering solution with all the important features of a trend tool built into one tool! The Riko Trend indicator is good for any trader, suitable for any trader for both forex and binary options. You don’t need to configure anything, everything is perfected by time and experience, it works great during a flat and in a trend. The Riko Trend indicator is a technical analysis tool for financial markets that reflects the current price
Owl Smart Levels MT5
Sergey Ermolov
4.07 (28)
Versione MT4  |  FAQ L' indicatore Owl Smart Levels è un sistema di trading completo all'interno dell'unico indicatore che include strumenti di analisi di mercato popolari come i frattali avanzati di Bill Williams , Valable ZigZag che costruisce la corretta struttura a onde del mercato, e i livelli di Fibonacci che segnano i livelli esatti di entrata nel mercato e luoghi per prendere profitti. Descrizione dettagliata della strategia Istruzioni per lavorare con l'indicatore Consulente-assistente
Gioteen Volatility Index (GVI) - your ultimate solution to overcoming market unpredictability and maximizing trading opportunities. This revolutionary indicator helps you in lowering your losing trades due to choppy market movements. The GVI is designed to measure market volatility, providing you with valuable insights to identify the most favorable trading prospects. Its intuitive interface consists of a dynamic red line representing the volatility index, accompanied by blue line that indicate
The Penta-O is a 6-point retracement harmonacci pattern which usually precedes big market movements. Penta-O patterns can expand and repaint quite a bit. To make things easier this indicator implements a twist: it waits for a donchian breakout in the right direction before signaling the trade. The end result is an otherwise repainting indicator with a very reliable trading signal. The donchian breakout period is entered as an input. [ Installation Guide | Update Guide | Troubleshooting | FAQ | A
Gli utenti di questo prodotto hanno anche acquistato
TPSpro RFI Levels MT5
Roman Podpora
4.73 (11)
ISTRUZIONI       RUS   -   INGLESE       Si   consiglia di utilizzare con un indicatore       -       TPSpro   TENDENZA PRO -   Versione MT4         Un elemento chiave nel trading sono le zone o i livelli da cui vengono prese le decisioni di acquisto o vendita di uno strumento di trading. Nonostante i tentativi dei principali attori di nascondere la loro presenza sul mercato, lasciano inevitabilmente delle tracce. Il nostro compito era imparare a identificare queste tracce e interpretarle corre
TPSproTREND PrO MT5
Roman Podpora
4.89 (9)
TPSpro TREND PRO   è un indicatore di tendenza che analizza automaticamente il mercato, fornisce informazioni sulla tendenza e sui rispettivi cambiamenti e fornisce segnali per entrare nelle operazioni senza ridisegnare. L'indicatore utilizza ciascuna candela e la analizza separatamente. Si riferisce a vari shock al rialzo o al ribasso. Punto di ingresso preciso per il trading di valute, criptovalute, metalli, azioni e indici! Versione MT5                   Descrizione completa dell'indicatore
Innanzitutto è importante sottolineare che questo sistema di trading è un indicatore Non-Repainting, Non-Redrawing e Non-Lagging, il che lo rende ideale sia per il trading manuale che per quello automatico. Corso online, manuale e download di preset. Il "Sistema di Trading Smart Trend MT5" è una soluzione completa pensata sia per i trader principianti che per quelli esperti. Combina oltre 10 indicatori premium e offre più di 7 robuste strategie di trading, rendendolo una scelta versatile per div
Atomic Analyst MT5
Issam Kassas
4.42 (19)
Innanzitutto, vale la pena sottolineare che questo indicatore di trading non è repaint, non è ridisegno e non presenta ritardi, il che lo rende ideale sia per il trading manuale che per quello automatico. Manuale utente: impostazioni, input e strategia. L'Analista Atomico è un indicatore di azione del prezzo PA che utilizza la forza e il momentum del prezzo per trovare un miglior vantaggio sul mercato. Dotato di filtri avanzati che aiutano a rimuovere rumori e segnali falsi, e aumentare il pote
Quantum Trend Sniper
Bogdan Ion Puscasu
4.8 (49)
Presentazione       Quantum Trend Sniper Indicator   , l'innovativo indicatore MQL5 che sta trasformando il modo in cui identifichi e scambi le inversioni di tendenza! Sviluppato da un team di trader esperti con un'esperienza di trading di oltre 13 anni,       Indicatore Quantum Trend Sniper       è progettato per spingere il tuo viaggio di trading verso nuove vette con il suo modo innovativo di identificare le inversioni di tendenza con una precisione estremamente elevata. *** Acquista Quant
TrendMaestro5
Stefano Frisetti
nota: questo indicatore e' per METATRADER5, se vuoi la versione per  METATRADER4 questo e' il link:   https://www.mql5.com/it/market/product/108106 TRENDMAESTRO ver 2.4 TRENDMAESTRO   riconosce un nuovo TREND sul nascere, non sbaglia mai. La sicurezza di identificare un nuovo TREND non ha prezzo. DESCRIZIONE TRENDMAESTRO identifica un nuovo TREND sul nascere, questo indicatore prende in esame la volatilita' i volumi ed il momentum per identificare il momento in cui c'e' un'esplosione di uno
Top indicator for MT5   providing accurate signals to enter a trade without repainting! It can be applied to any financial assets:   forex, cryptocurrencies, metals, stocks, indices .  Watch  the video  (6:22) with an example of processing only one signal that paid off the indicator! MT4 version is here It will provide pretty accurate trading signals and tell you when it's best to open a trade and close it. Most traders improve their trading results during the first trading week with the help of
FxaccurateLS
Shiv Raj Kumawat
WHY IS OUR FXACCCURATE LS MT5 THE PROFITABLE ? PROTECT YOUR CAPITAL WITH RISK MANAGEMENT Gives entry, stop and target levels from time to time. It finds Trading opportunities by analyzing what the price is doing during established trends. POWERFUL INDICATOR FOR A RELIABLE STRATEGIES We have made these indicators with a lot of years of hard work. It is made at a very advanced level. Established trends provide dozens of trading opportunities, but most trend indicators completely ignore them!
AT Forex Indicator MT5
Marzena Maria Szmit
5 (4)
The AT Forex Indicator MT5 is a sophisticated trading tool designed to provide traders with a comprehensive analysis of multiple currency pairs. This powerful indicator simplifies the complex nature of the forex market, making it accessible for both novice and experienced traders. AT Forex Indicator uses advanced algorithms to detect trends, patterns and is an essential tool for traders aiming to enhance their forex trading performance. With its robust features, ease of use, and reliable signal
Advanced Supply Demand MT5
Bernhard Schweigert
4.5 (14)
La migliore soluzione per qualsiasi principiante o trader esperto! Questo indicatore è uno strumento di trading unico, di alta qualità e conveniente perché abbiamo incorporato una serie di funzionalità proprietarie e una nuova formula. Con questo aggiornamento, sarai in grado di mostrare fusi orari doppi. Non solo potrai mostrare una TF più alta, ma anche entrambe, la TF del grafico, PIÙ la TF più alta: SHOWING NESTED ZONES. Tutti i trader di domanda di offerta lo adoreranno. :) Informazioni imp
TPA True Price Action indicator reveals the true price action of the market makers through 100% non-repainting signals strictly at the close of a candle! TPA shows entries and re-entries, every time the bulls are definitely stronger than the bears and vice versa. Not to confuse with red/green candles. The shift of power gets confirmed at the earliest stage and is ONE exit strategy of several. There are available now two free parts of the TPA User Guide for our customers. The first "The Basics"
XQ Indicator MetaTrader 5
Marzena Maria Szmit
3 (2)
Step into the realm of Forex trading with confidence and precision using XQ, a cutting-edge Forex indicator designed to elevate your trading game to unprecedented heights. Whether you're a seasoned trader or just stepping into the world of currency exchange, XQ Forex Indicator empowers you with the insights and signals needed to make informed trading decisions. The signal conditions are a combination of three indicators, and XQ Forex Indicator only display  medium and long-term trends . The ind
PZ Swing Trading MT5
PZ TRADING SLU
5 (4)
Protect against whipsaws: revolutionize your swing trading approach Special Offer: Purchase now to receive free bonuses worth $135! (Read more for details) Swing Trading is the first indicator designed to detect swings in the direction of the trend and possible reversal swings. It uses the baseline swing trading approach, widely described in trading literature. The indicator studies several price and time vectors to track the aggregate trend direction and detects situations in which the market i
Trade smarter, not harder: Empower your trading with Harmonacci Patterns Special Offer: Purchase now to receive free bonuses worth $165! (Read more for details) This is arguably the most complete harmonic price formation auto-recognition indicator you can find for the MetaTrader Platform. It detects 19 different patterns, takes fibonacci projections as seriously as you do, displays the Potential Reversal Zone (PRZ) and finds suitable stop-loss and take-profit levels. [ Installation Guide | Up
FX Volume MT5
Daniel Stein
4.93 (14)
Ricevi il tuo aggiornamento quotidiano sul mercato con dettagli e schermate tramite il nostro Morning Briefing qui su mql5 e su Telegram ! FX Volume è il PRIMO e UNICO indicatore di volume che fornisce una visione REALE del sentiment del mercato dal punto di vista del broker. Fornisce informazioni straordinarie su come gli operatori di mercato istituzionali, come i broker, sono posizionati sul mercato Forex, molto più velocemente dei rapporti COT. Vedere queste informazioni direttamente sul vo
Noize Absorption Index - is the manual trading system that measures the difference of pressure between bears forces and bulls forces. Green line - is a noize free index that showing curent situation. Zero value of index shows totally choppy/flat market.Values above zero level shows how powerfull bullish wave is and values below zero measures bearish forces.Up arrow appears on bearish market when it's ready to reverse, dn arrow appears on weak bullish market, as a result of reverse expectation.
PZ Support Resistance MT5
PZ TRADING SLU
4.17 (6)
Unlock key market insights with automated support and resistance lines Special Offer: Purchase now to receive free bonuses worth $75! (Read more for details) Tired of plotting support and resistance lines? This is a multi-timeframe indicator that detects and plots supports and resistance lines in the chart with the same precision as a human eye would. As price levels are tested over time and its importance increases, the lines become thicker and darker, making price leves easy to glance and ev
The Price Action Finder Multi indicator is an indicator of entry points that searches for and displays Price Action system patterns on dozens of trading instruments and on all standard time frames: (m1, m5, m15, m30, H1, H4, D1, Wk, Mn). The indicator places the found patterns in a table at the bottom of the screen. By clicking on the pattern names in the table, you can move to the chart where this pattern is located. Manual (Be sure to read before purchasing) | Version for MT4 Advantages 1. Pa
Order Block Hunter MT5
Noha Mohamed Fathy Younes Badr
5 (1)
Order block hunter indicator is the best indicator for  hunt the order blocks that area where there has been a large concentration of limit orders waiting to be executed Order blocks are identified on a chart by observing previous price action and looking for areas where the price experienced significant movement or sudden changes in direction .This indicator does that for you by using very complicated codes and helps you to take the best areas To buy and sell because it make marks at the best a
MetaForecast M5
Vahidreza Heidar Gholami
5 (2)
MetaForecast predice e visualizza il futuro di qualsiasi mercato basandosi sull'armonia dei dati dei prezzi. Sebbene il mercato non sia sempre prevedibile, se esiste un modello nei prezzi, MetaForecast può prevedere il futuro con la massima precisione possibile. Rispetto ad altri prodotti simili, MetaForecast può generare risultati più accurati analizzando le tendenze di mercato. Parametri di input Past size (Dimensione passata) Specifica il numero di barre che MetaForecast utilizza per creare
Boom and Crash Trend Detector is a  Non-Repaint   MT5 trading system usually being sold for 50 0$ . Most people use this for Deriv but can be used to forex too. The boom and crash spike indicator is a spike detecting software, with Multiple features, these features include. Spike Alert ( from 10 to 100-second warning before spike) Continues spike Alert (for double or continuous spikes at a time) supports all Boom/crash Indices M6 time frame works best here . Bigger time frame trend pointer f
Unlock hidden profits: accurate divergence trading for all markets Special Offer: Purchase now to receive free bonuses worth $90! (Read more for details) Tricky to find and scarce in frequency, divergences are one of the most reliable trading scenarios. This indicator finds and scans for regular and hidden divergences automatically using your favourite oscillator. [ Installation Guide | Update Guide | Troubleshooting | FAQ | All Products ] Easy to trade Finds regular and hidden divergences S
Ora $ 147 (aumentando a $ 499 dopo alcuni aggiornamenti) - account illimitati (PC o MAC) Manuale utente di RelicusRoad + Video di formazione + Accesso al gruppo Discord privato + Stato VIP UN NUOVO MODO DI GUARDARE IL MERCATO RelicusRoad è l'indicatore di trading più potente al mondo per forex, futures, criptovalute, azioni e indici, fornendo ai trader tutte le informazioni e gli strumenti di cui hanno bisogno per rimanere redditizi. Forniamo analisi tecniche e piani di trading per aiutar
Go Way TREND
Ywsf Hsyn Hmad Alrsh
Segui la tendenza. Sì, attendi il segnale di ingresso, sia di acquisto che di vendita, su un frame di 15 minuti e controlla il segnale se appare su un frame di 30 minuti (a volte ci vuole un'ora o più prima che il segnale appaia. Puoi tornare al frame di 15 minuti e torna al frame di 30 minuti, e ripeti l'operazione finché non appare il segnale principale. Se il segnale appare sul frame di 30 minuti, entra con il prezzo e il profitto viene preso quando la linea di disegno cambia , viene registr
How to use Pair Trading Station Pair Trading Station is recommended for H1 time frame and you can use it for any currency pairs. To generate buy and sell signal, follow few steps below to apply Pair Trading Station to your MetaTrader terminal. When you load Pair Trading Station on your chart, Pair Trading station will assess available historical data in your MetaTrader platforms for each currency pair. On your chart, the amount of historical data available will be displayed for each currency pai
The indicator is the advanced form of the MetaTrader 4 standard Fibonacci tool. It is unique and very reasonable for serious Fibonacci traders. Key Features Drawing of Fibonacci retracement and expansion levels in a few seconds by using hotkeys. Auto adjusting of retracement levels once the market makes new highs/lows. Ability to edit/remove any retracement & expansion levels on chart. Auto snap to exact high and low of bars while plotting on chart. Getting very clear charts even though many ret
IVISTscalp5
Vadym Zhukovskyi
5 (5)
What's new about iVISTscalp5 forecast indicator (Version 10)? iVISTscalp5 is a unique nonlinear forecasting for a week ahead system for any financial instrument which executes fast scalping using time levels. iVISTscalp5 is a tool for easy study and understanding of financial market. 1) iVISTscalp5 forecast indicator has been completely rewritten into another programming language (C++), which has accelerated data loading and processing. As a result, a different graphical display of forecast
PZ Day Trading MT5
PZ TRADING SLU
2.83 (6)
Effortless trading: non-repainting indicator for accurate price reversals Special Offer: Purchase now to receive free bonuses worth $60! (Read more for details) This indicator detects price reversals in a zig-zag fashion, using only price action analysis and a donchian channel. It has been specifically designed for short-term trading, without repainting or backpainting at all. It is a fantastic tool for shrewd traders aiming to increase the timing of their operations. [ Installation Guide | Upd
Gartley Hunter Multi
Siarhei Vashchylka
5 (8)
Gartley Hunter Multi - An indicator for searching for harmonic patterns simultaneously on dozens of trading instruments and on all possible timeframes. Manual (Be sure to read before purchasing) | Version for MT4 Advantages 1. Patterns: Gartley, Butterfly, Shark, Crab. Bat, Alternate Bat, Deep Crab, Cypher 2. Simultaneous search for patterns on dozens of trading instruments and on all possible timeframes 3. Search for patterns of all possible sizes. From the smallest to the largest 4. A
Bill Williams Advanced
Siarhei Vashchylka
5 (8)
Bill Williams Advanced is designed for automatic chart analysis using Bill Williams' "Profitunity" system. The indicator analyzes four timeframes at once. Manual (Be sure to read before purchasing) Advantages 1. Automatically analyzes the chart using the "Profitunity" system of Bill Williams. The found signals are placed in a table in the corner of the screen. 2. Equipped with a trend filter based on the Alligator indicator. Most of the system signals are recommended to be used only accordi
Altri dall’autore
SwingVolumePro
Thalles Nascimento De Carvalho
Panoramica SwingVolumePro è un indicatore avanzato e versatile, progettato per essere utilizzato su una vasta gamma di strumenti finanziari e per supportare diversi stili di trading. Basato su un'analisi rigorosa di volume e prezzo, fornisce segnali chiari e precisi che consentono ai trader di tutti i livelli di prendere decisioni informate basate su dati di alta qualità. SwingVolumePro.PDF Caratteristiche principali Versatilità: SwingVolumePro può essere applicato a vari asset, t
Box Weis Wave
Thalles Nascimento De Carvalho
5 (1)
Eleva la tua analisi con Weis Wave Box! Se stai cercando precisione e chiarezza nel tuo trading, Weis Wave Box è lo strumento che fa per te. Questo indicatore avanzato offre un'analisi visiva dettagliata delle onde di volume e dei punti di swing, aiutandoti a comprendere meglio la relazione tra sforzo e risultati nel mercato. Caratteristiche principali di Weis Wave Box: Onde di Volume Personalizzabili: Regola le onde di volume in tick per adattarle alle tue strategie di trading. Stori
AI Channel
Thalles Nascimento De Carvalho
4 (4)
Welcome to the presentation of the AI Channel indicator, a powerful tool that uses artificial intelligence for price channel analysis in the financial market. In this session, we will explore how this revolutionary indicator can assist investors and traders in making more informed and strategic decisions. Let's get started! I. What is the AI Channel indicator? AI Channel is an indicator developed based on advanced artificial intelligence algorithms. It utilizes historical price data of financial
FREE
Cumulative Volume Bands
Thalles Nascimento De Carvalho
CVB Cumulative Volume Bands: Potenzia le tue operazioni con il volume accumulato! CVB Cumulative Volume Bands è un indicatore avanzato progettato per i trader che cercano segnali precisi basati sul volume accumulato. Utilizzando bande di volume accumulato, questo indicatore offre letture chiare delle pressioni di acquisto e vendita nel mercato, aiutando a identificare inversioni e forti movimenti dei prezzi. Cumulative Volume Bands for MT5 ! Caratteristiche principali: Analis
FREE
Swing Point Volume
Thalles Nascimento De Carvalho
Swing Point Volume, the indicator that signals weakness and strength at the tops and bottoms. This indicador can be for used the Wyckoff Method. Information provided; - Swing on customized ticks. - Volume and points in each balance sheet. - Percentage of Displacement. - Sound alert option on top and bottom breaks. - Volume in ticks and Real Volume. - Volume HL (extreme) or (opening and closing) - Customized volume shapes.
Atr Projection
Thalles Nascimento De Carvalho
L'indicateur ATR Projeção se distingue comme un outil robuste dans l'analyse technique, conçu pour fournir des informations précises sur les limites potentielles des mouvements de prix sur les marchés financiers. Son approche flexible permet aux utilisateurs de personnaliser de manière intuitive les métriques d'analyse, en s'adaptant aux besoins spécifiques de chaque actif négocié. Fonctionnement personnalisable : Par défaut, l'ATR Projeção fonctionne en considérant 30 % de la moyenne des
Long Short Pro
Thalles Nascimento De Carvalho
Indicatore Long & Short - Versione Pro: Sblocca il Potenziale Illimitato della Tua Analisi di Mercato! Nessuna Limitazione per Qualsiasi Attivo La versione Pro dell’indicatore Long & Short ti offre la libertà totale di utilizzarlo su qualsiasi strumento finanziario. Niente più limitazioni – applica lo stesso indicatore a tutti i tuoi attivi preferiti! Senza Limitazioni Approfitta di tutte le funzionalità dell’indicatore senza alcuna restrizione. La versione Pro offre un’esperienza
Didi Index Volume
Thalles Nascimento De Carvalho
Presentiamo il Didi Index Volume, un indicatore di analisi tecnica sviluppato dal trader brasiliano Odir Aguiar, che si distingue per il suo approccio avanzato e potente nell'individuazione delle opportunità nei mercati finanziari. Disponibile su diverse piattaforme, il Didi Index Volume è diventato uno strumento essenziale per i trader che cercano informazioni precise e preziose per le loro strategie di trading. L'indicatore combina il rinomato Didi Index, creato da Odir Aguiar, con l'intell
Smart Binary Volume
Thalles Nascimento De Carvalho
L'indicatore Smart Binary Volume è uno strumento versatile che combina l'analisi del volume di trading con l'apprendimento automatico (machine learning). Può essere applicato su diversi mercati e strategie, inclusi lo scalping e altre tipologie di trading a breve termine. Utilizzando algoritmi avanzati di machine learning, l'indicatore identifica pattern complessi, generando segnali di acquisto e vendita più precisi. Buffer to Create EA. Buffer Line Gold = 0. Buffer Line Red = 2 Buffer   AI 
TimeChannel
Thalles Nascimento De Carvalho
The "Timechannel" is a powerful technical analysis tool designed specifically for traders who want to gain deeper and more accurate insights into price movements across multiple timeframes (multi-timeframe). This indicator is an essential addition to the toolbox of any serious trader seeking to make informed and data-driven trading decisions. Key Features: Advanced Multi-Timeframe Analysis : Timechannel allows traders to analyze price movements on different timeframes simultaneously. This is cr
Big Player Range
Thalles Nascimento De Carvalho
5 (2)
Scopri la Potenza di "BigPlayerRange": Il Tuo Alleato nell'Analisi Tecnica del Mercato Presentiamo BigPlayerRange , uno strumento avanzato di analisi tecnica progettato per rivelare le aree di interesse degli investitori istituzionali sul mercato. Con questo strumento, potrai identificare con precisione dove i principali attori sono attivamente coinvolti e comprendere come ciò possa influenzare le tue strategie di trading. Caratteristiche Principali: Mappatura delle Aree di Interesse Istitu
Smart Delta Volume
Thalles Nascimento De Carvalho
Smart Delta Volume: Preciso e Adattabile alle Condizioni Dinamiche del Mercato Smart Delta Volume è un indicatore tecnico avanzato progettato per offrire un'analisi precisa e adattabile in un ambiente di mercato in continua evoluzione. Utilizzando livelli dinamici che si regolano automaticamente in base alla volatilità, questo indicatore fornisce una visione più completa e affidabile dell'interazione tra flusso di volume e azione dei prezzi. Questa capacità di adattamento è cruciale per i tra
VolaMetrics VSA
Thalles Nascimento De Carvalho
VolaMetrics VSA | Un Potente Alleato nell'Analisi Tecnica Il VolaMetrics VSA è un indicatore di analisi tecnica che combina il metodo Volume Spread Analysis (VSA) con un'analisi dettagliata del volume delle transazioni . Progettato per identificare e tracciare i movimenti significativi dei prezzi , il VolaMetrics VSA utilizza l'interazione tra volume e spread dei prezzi per fornire intuizioni preziose che possono aiutare nelle decisioni di trading. Fondamenti della Volume Spread Analysis (VSA
CVD SmoothFlow Pro
Thalles Nascimento De Carvalho
CVD SmoothFlow Pro - Analisi del Volume Illimitata per Qualsiasi Attivo! CVD SmoothFlow Pro è la soluzione definitiva per i trader che cercano un'analisi del volume precisa e illimitata. Utilizzando il calcolo del Cumulative Volume Delta (CVD) con filtraggio avanzato del rumore, la versione Pro offre la flessibilità e la precisione necessarie per operare su qualsiasi strumento finanziario. Cosa offre CVD SmoothFlow Pro? Analisi Chiara : Filtra il rumore di mercato e mette in risalto i movi
VolumeSecret
Thalles Nascimento De Carvalho
VolumeSecret: Il Potere del Volume nelle Tue Mani Nel mondo sfidante della programmazione, affrontiamo costantemente ostacoli che ci spingono a crescere e ad evolverci. Comprendiamo profondamente le difficoltà imposte dal mercato e come i trader lottano per raggiungere le migliori performance. Per questo motivo, lavoriamo instancabilmente su soluzioni innovative per rendere la presa di decisioni sul mercato più fluida e precisa. VolumeSecret è il risultato di questo impegno. Si tratta di un indi
Cumulative Vol Bands
Thalles Nascimento De Carvalho
CVB Cumulative Volume Bands: Potenzia le tue operazioni con il volume accumulato! CVB Cumulative Volume Bands è un indicatore avanzato progettato per i trader che cercano segnali precisi basati sul volume accumulato. Utilizzando bande di volume accumulato, questo indicatore offre letture chiare delle pressioni di acquisto e vendita nel mercato, aiutando a identificare inversioni e forti movimenti dei prezzi. Caratteristiche principali: Analisi del Volume Accumulato : Rileva i punt
ZigWave Oscillator
Thalles Nascimento De Carvalho
ZigWave Oscillator: Potenzia le tue operazioni con oscillatori e ZigZag! Il ZigWave Oscillator è lo strumento perfetto per i trader che cercano precisione e chiarezza nell'analisi del mercato finanziario. Questo indicatore combina la forza degli oscillatori con la semplicità visiva dello ZigZag, aiutandoti a identificare le migliori opportunità di acquisto e vendita con rapidità ed efficienza. Perché scegliere il ZigWave Oscillator? Analisi precisa degli oscillatori : Integra RSI, Will
Filtro:
Nessuna recensione
Rispondi alla recensione
Versione 1.4 2024.08.20
melhorias no calculo do volume e canais para rastrear tendências
Versione 1.2 2024.01.11
Correção nas notificações e ajuste de volume