Guarda i video tutorial del Market su YouTube
Come acquistare un Robot di Trading o un indicatore
Esegui il tuo EA
hosting virtuale
hosting virtuale
Prova un indicatore/robot di trading prima di acquistarlo
Vuoi guadagnare nel Market?
Come presentare un prodotto per venderlo con successo
Nuovi Expert Advisors e Indicatori per MetaTrader 5 - 109

This indicator has the main purpose of showing the current spread of the asset in which the indicator was placed. Depending on the photos, visually and within the graph itself, it is possible to view the spread value at the current time, it is possible to change the vertical position of the text and the horizontal position, in addition to the font size and color of the text.
FREE
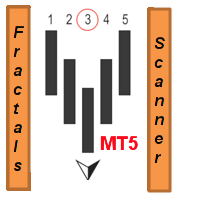
This multi time frame and multi symbol indicator identifies fractals patterns. As a bonus it can also scan for Parabolic SAR (pSAR) trend changes. Combined with your own rules and techniques, this indicator will allow you to create (or enhance) your own powerful system. Features
Can monitor all symbols visible in your Market Watch window at the same time. Apply the indicator to just one chart and instantly monitor the entire market. Can monitor every time frame, from M1 to MN, and sends you a r

Mercury MT5 it is a Secure Automated Software for trade Forex market and indices.The architecture is a Fully Automatic Autonomous Robot Expert. Mercury MT5 It is an advanced trading system. The system is ideal for consolidated market. You can download the demo and test it yourself.
Very stable growth curve as result of smart averaging techniques.
"Safety first" approach in development. Stress-tests on historical data for multiple pairs. Broker type: Low spread, f

FXC iRSI-DivergencE MT5 Indicator
This is an advanced RSI indicator that finds trend-turn divergences on the current symbol. The indicator detects divergence between the RSI and the price movements as a strong trend-turn pattern.
Main features: Advanced divergence settings
Price based on Close, Open or High/Low prices Give Buy/Sell open signals PUSH notifications
E-mail sending Pop-up alert Customizeable Information panel Input parameters: RSI Period: The Period size of the RSI indicator.
R

Genaral: Not martingale, not a grid; Use on EURUSD Use on M5
Signals: There is a good rational algorithm. Work of two indicators: CCI and OsMA (from 2 timeframes) (you can set a separate Timeframe for each indicator)
Stop Loss/Take Profit: There is a good money management system (there are several type for trailing stop loss); There is virtual levels of Stop Loss / Take Profit; There is smart lot (percent by risk) or fix lot
Important: EA can work on closed candles, and on current can
FREE

ToolBot Advisor Indicator (RSI, ATR, ADX, OBV) FREE An effective indicator for your negotiations
The toolbot indicator and advisor brings leading (OBV) and lagging (RSI, ATR, ADX) indicators so that you have more security in your negotiations. In addition, it informs you of possible up and down trends as well as providing you with incredible advisors who will give you information about trading opportunities.
With this indicator you will have more security and speed in your decision making
FREE
This EA trades with the trend using several methods to identify and enter a trade. For example, it uses trendlines, Gator and Stochastic indicators to analyze the market. In addition to trading, it can also display trend lines that it trades based on. It has filters for ADX and MA indicators, as well as a sufficient number of settings to be able to optimize on various currency pairs and timeframes.
The EA sets stop loss and take profit for each trade, does not have risky trading methods. It i

This indicator will draw two lines to represent the adjustment value, which can be used in both the Dollar and the Index.
The main advantage of this indicator is that it has two lines, one representing the adjustment calculated from the previous day and the other representing the adjustment calculated on the current day. The calculation of the adjustment on the current day is a great differential, since it will be possible to make operations in order to sleep bought or sold according to the a
FREE

The Price Action Finder indicator is an indicator of entry points, which is designed to search and display patterns of the Price Action system on a price chart. The indicator is equipped with a system of trend filters, as well as a system of alerts and push notifications. Manual (Be sure to read before purchasing) | Version for MT4 Advantages
1. Patterns: Pin bar, Outside bar, Inside bar, PPR, Power bar, Hanging man, Inverted hammer 2. Pattern filtering system. Removes countertrend patterns fro

Утилита Горячие Клавиши. Работает только на неттинговых типах счетов. Позволяет совершать торговые операции без мыши. Удобно использовать для акций, фьючерсов, валютных пар, криптовалют. В совокупности со стаканом получается полноценный скальперский привод.
Реализованные команды : · покупка по рынку; · продажа по рынку; · выставление лимитного ордера на покупку с заданным отступом (может быть отрицательным) от цены Бид; · выставление лимитного ордера на прод
FREE

ARSINIUM is brand new Multi Strategy EA where you are able to define your Entry Points like a PRO! Originally it was developed as a Scalper for lower Timeframes, but we saw that the Entry Points, combined with some Filters, and other useful Options, are more than that. It works in many different Conditions and has many different Strategies you can build on your own. Test it for yourself and find out the best Strategy inside the Strategy! We offer this for 99 USD for a limited time to support

Great dashboard for market analytics. The panel helps to analyze the values of the MACD indicator and Macd`s signals.
Using this panel you can: watch the current signal from Macd for all time frames; watch the current signal from Macd by different symbols; look Macd value (main line and signal line); look different between Main line and Signal Line; several types of signals for analytics.
Values in the table cell: Macd value (main line); Macd value (signal line);
main line minus signa

This multi time frame and multi symbol indicator scans for pin bars. Combined with your own rules and techniques, this indicator will allow you to create (or enhance) your own powerful system. Features Can monitor all symbols visible in your Market Watch window at the same time. Apply the indicator to just one chart and instantly monitor the entire market. Can monitors every time frame, from M1 to MN, and sends you a real-time alert when a pin bar is identified. All Metatrader native alert types

Genaral: Not martingale, not a grid; Use on EURUSD Use on M5 EA was opimized only on 2020 year
Signals: There is a good rational algorithm. Work of 3 indicators: WRP, DeMarker, CCI (from 3 timeframes) (you can set a separate Timeframe for each indicator)
Stop Loss/Take Profit: There is a good money management system (there are several type for trailing stop loss); There is virtual levels of Stop Loss / Take Profit; There is smart lot (percent by risk) or fix lot
Important: EA can work
FREE

This indicator serves as an alert for climax regions.
How does it work? When the 20-period arithmetic moving average meets the 200-period arithmetic moving average, a conflict region forms with two major opposing forces fighting. This causes the price to show random peaks until a winner side is defined, which can be dangerous. Therefore, the indicator paints the region between the moving averages to alert you.
How to use it? It can be used for specific volatility or support and resistance s
FREE

It is very easy to use the Fibrillar indicator, since the simplest is to look at the chart and act according to the indications of the colored arrows. The algorithm takes into account the measurement of prices, and this method also focuses on measuring each of the price drops (H / C, H / O, LC, LO) - which gives more detailed information, but also more averaged.
When calculating this indicator, logarithmic gains are first calculated at the closing price, which allows you to filter out the tre

Buy and sell signals based on the Continuous Point Setup for trend continuation, popularized in Brazil by Stormer and Palex.
How does it work? The indicator activates the buy signal when we have prices above the ascending 21-period Simple Moving Average (SMA21) followed by a pullback and a touch on it.
For a sell signal we need the prices below the descending SMA21 followed by a pullback and a touch on it.
How to use it? One way of using it, as suggested by Stormer, is to enter the

FXC iCorrelatioN MT5 Indicator (Specialized for DAX - DowJones)
The indicator shows the correlation soefficient between two assets. Correlations are useful because they can indicate a predictive relationship that can be exploited in practice. The correlation coefficient shows the relationship between the two symbols. When the correlation is near 1.0, the symbols are moving togerhet in the same direction. When the correlation is near -1.0, the symbols are moving in opposite direction. Main featu

Horizontal Level indicator - reflects, using a histogram, the horizontal volumes of transactions at a certain price without reference to time. At the same time, the histogram appears directly in the terminal window, and each column of the volume is easily correlated with the quote value of the currency pair. The volume of transactions is of great importance in exchange trading, usually an increase in the number of concluded contracts confirms the trend, and their reduction indicates an imminent
A trending strategy using a combination of two popular indicators Bollinger Bands and RSI provides reliable signals.
The logic of the advisor
Entering a short position is carried out when the price touches the upper Bollinger band, while the RSI indicator should be in the overbought zone, i.e. above level 70. Entering a long position is carried out when the price touches the lower Bollinger band, while the RSI indicator should be in the oversold zone, ie below level 30. It is possible to tr

Buy and sell signals based on Joe DiNapoli's shifted 3 period exponential moving average strategy for trend reversals.
Who is he? Joe DiNapoli is a professional trader and author that has been involved in the markets for more than 38 years. He is also a registered Commodity Trading Advisor (C.T.A.) for over 15 years and has taught his techniques in the major financial capitals of Europe, Asia, South Africa, the Middle East, Russia and in the United States.
How does the indicator work? The i

The fundamental technical indicator Ripple, allows you to assess the current market situation in order to enter the market of the selected currency pair in the trend and with minimal risk. It uses in its basis the process of identifying the rate of change in price growth and allows you to find points of entry and exit from the market.
This indicator was created on the basis of the original indicators of the search for extremes, the indicator is well suited for detecting a reversal or a large

O Indicador valida a força da tendência utilizando o volume negociado. Os candles são mostrados na cor verde indicando força compradora e cor vermelha na força vendedora. O movimento é encerrado pelo SAR parabólico. Vantagens: Filtra distorções de preço sem volume financeiro; Filtra consolidações e movimentos laterais; Filtra divergências de volume pelo indicador Money Flow. Desvantagens: Não filtra todos os falsos rompimentos, visto que rompimentos importantes geram altos volumes financeiros; N
FREE

EA made using combination of Pending Order and Martingale Strategy. Designed only to work best on Gold Spot M5. EA will put pending orders and on certain condition will create positions with bigger lot. This EA do not use Stop Loss due to the applied strategy. Stop Loss will be replaced using modified Take Profit.
Input Parameters 1. MaxOpenPositions : Define allowed positions can be open by EA, 0 will use default EA Value 2. TotalPendingOrders : Define allowed generated Pending order set, 0

EA designed to generate pending orders based on the trend and designated take profit value. This EA designed exclusively to work best on GOLD SPOT M5 especially during up trend. User can freely decide to close the open position from this EA or wait until take profit hit. No parameters need to be set as it already set from the EA itself. This EA do not use Stop Loss due to the applied strategy. Please do fully backtest the EA on the worst condition before use on the real account. Recommended ini

MultiPairs MT5 is a fully automated Expert Advisor. This expert advisor is based on Multi-currency strategy . This system analyzes the market volatility to find trading signals based on trend reversal strategies and is used to evaluate oversold and overbought market conditions. Swing trading is a short-medium speculation based on the buying-selling force in the trading market with an advantage and low risk with a trend reversal pattern. The Expert Advisor does not use martingale, grids, hedg

Strategy is based on moving average analysis with the Timeframe H1.
It is a combination of powerful trading techniques.
The trading system is suitable for experienced traders and beginner.
The EA allows you to trade with a fixed lot size.
Recommended :
Recommended timeframe is H1.
Minimum account balance: $200.
Default parameters are for EURUSD.
Features :
The EA is not sensitive to spread or broker, you may chose any broker you trust to; The EA is very easy to setup and use.
The best No Nonsense Forex EA for testing and real time trading your NNFX algorithm. This is a demo version, get the full version from mt5.karelnagel.com .
Demo version Full version Test whole NNFX algo Yes Yes Chart testing Partly Yes Multiple pairs One pair at a time All pairs that you need at once Optimization No Yes Strategy tester Yes Yes Live trading No Yes
FREE
CAP Zone Recovery Strategy Builder EA MT5 is a another version of our Main Product CAP Zone Recovery EA. This EA is a strategy builder type EA has more then 34+ build in indicator that you can make more then 1 million combination strategy that boost you trading strategy. Also this Builder offers an incredible amount of functionality with zone recovery strategy. So you can test your strategy easy way without knowledge of coding. [ Installation Guide | Update Guide | Submit Your Problem

Excellent Multiplatform Copier of deals. I use it regularly on VPS (copy from Mt5 to Mt4).
Multiplatform : copying from MetaTrader 4 to MetaTrader 4; copying from MetaTrader 4 to MetaTrader 5; copying from MetaTrader 5 to MetaTrader 4; copying from MetaTrader 5 to MetaTrader 5.
Modes: master - the current terminal is source of trades (deals are copied from it); slave - the current terminal is the receiver of trades (trades are copied to it). from myself - mode "deals multiplier" (use

Great dashboard for market analytics. The panel helps to analyze the values of the Envelopes indicator and prices.
Using this panel you can: watch the current signal from Envelopes for all time frames; watch the current signal from Envelopes by different symbols; look at how far Envelopes is from the price; look at how much the value of Envelopes has changed; several types of signals for analytics.
Values in the table cell: Envelopes value upper line; Envelopes value lower line;
"the

Introduction to Fibonacci Volatility Indicator Volatility indicator can help you to detect any statistical advantage for your trading. Especially, if you are trading with Price Action and Price Patterns, then we recommend to use the Volatility indicator together with your strategy. Especically, Fibonacci Volatility indicator combines the market volatiltiy with Fibonacci Analysis to provide you more advanced volatiltiy indicator. Main Features Fibonacci Volatility in Z score Configuration Mode Fi

HUBBLE it is a Secure Automated Software for trade Forex market and indices.
The architecture is a Fully Automatic Autonomous Robot Expert capable of
Independently analyzing the market and making trading decisions
HUBBLE It is an advanced trading system. This is a fully automatic Expert Advisor.
HUBBLE It is a 100% automatic system, The system is self-sufficient, performing all the work. Is a revolution in the customization of the trading. You can download the demo and te

The intention of the dashboard is to provide a quick overview of the daily, weekly and monthly range of configured assets. In "single asset mode" the dashboard shows you possible reversal points directly in the chart, thus making statistics directly tradable. If a configured threshold is exceeded, the dashboard can send a screen alert, a notification (to the mobile MT5) or an email. There are various ways of using this information. One approach is that an asset that has completed nearly 100%

BeST_Keltner Channels Strategies MT5 is an MT5 Indicator based on the original Keltner Channels Indicator and it can display in the Chart all the known Variations of Keltner Channels and also the corresponding 10 totally Strategies. Every such generally consists of a Central Moving Average Line and two Boundary Bands at a distance above and below it and can be traded mainly in a Trending Mode but also in a Ranging ReEntry Mode.
BeST_Keltner Channels Strategies Indicator Draws definite Bu

If you like to use traditional Moving Averages (like SMAs and EMAs) to provide your trades for dynamic levels of Support and Resistance, you will love the Adaptive Moving Average (AMA). Created in 1995 by Perry Kaufman and presented to the world in his book " Smarter Trading : Improving Performance in Changing Markets ", the Adaptive Moving Average (also known as KAMA - Kaufman Adaptive Moving Average) has the goal to be the perfect companion for following a trend without noise, but s
FREE

Indicator with 3 features
- Clock : Clock independent of the chart, counting continues even when the market is closed.
- Template : After setting up a configuration in any graphic, be it color patterns, indicators, zoom ... The configuration will be copied to all active graphics.
- TimeFrame : Set the TimeFrame on a chart, and with just one click all the active charts will be changed to the same TimeFrame.

Qstick is a way to objectively quantify candlestick analysis and improve the interpretation of candlestick patterns. Qstick was developed by Tushar Chande and published in his book " The New Technical Trader - Boost Your Profit by Plugging Into the Latest Indicators (1994) ". Qstick is built based on a moving average of the difference between the Open and Close prices. The basis of the idea is that the Opening and Closing prices are the heart of candlestick analysis. We strongly recommend the re
FREE

Utility for show on charts the visual informations about:
- a vertical line at start of each bar of selected timeframe
- a vertical line at start of each day
- a vertical line at start of each week
- vertical lines at start / end of trading sessions selected
- bid / ask prices, spread, money value for each point (of 1 standard lot) and last tick time recived"
You can enable / disable each information and set the color for each line
FREE

The Buffer Reader will help you to check and export the custom indicators buffers data for your current chart and timeframe. You can select the number of buffer and historical bars to read/export. The data can be exported in a CSV format and the files will be stored in the folder: \MQL5\Files .
How it works Put the number of buffers to read in the Buffers_Total input parameter. Put the number of rows to display in the Rows_Total. Choose the CSV separator in the parameter. Copy the correct na
FREE

This indicator is an utility for have always under control, how much time is left at the end of the bar setted.
The utility show on the lower right of the chart, the countdown to the end.
When the remaining seconds is = to the seconds set in the input, the color of remaining seconds on chart, change color and play a warning sound to warn you that the bar is about the end. When the remaining seconds is < to the seconds set in the input, the utility play a beep to warn you that the bar is in
FREE

Utility for know all informations and settings of all symbols available on your broker The informations that you can know are for example:
- Spread
- Digits
- Tick value
- Size step
- Size minimum
- Size maximum
- Swap buy and sell
- Margin required (for 1 standard lot)
- Rollover day
- Execution mode
and many other informations You can filter the symbols by group or you can also choose to see the informations only of symbols available on market watch.
FREE

Utility for know all informations and settings of account where the platform is connected The informations that you can know are for example:
- The difference from server time and time of your PC
- The limit orders that you can place at market
- The credit that you have
- The stopout mode of your broker
- The exact name of company of your broker
and other informations
FREE

Script to create arrows and lines on chart of history positions traded on account for the symbol where you launch the application. From inputs you can select: - Magic number (default is -1; -1 = all magics number) - "From" date and time (default is 1970.01.01 00:00; all positions) - "To" date and time (default is 1970.01.01 00:00; all positions) - Color for buy open positions (arrows and lines between open and close) - Color for buy closing positions (arrows) - Color for sell open positions
FREE

Script to load on chart the orders, starting from "Signal history report" downloaded from MQL5. If you found a good signal on "Signals" section of this site and you want to see the history orders on chart, you can do it, following this steps: - Download the csv file of history orders - Copy file in the common folder - Launch the script and set the input that are: - Report type (MT4 or MT5) - File name - Delimiter (default is ;) - Name of symbol to load (if symbol on file is for example EURUSDi,
FREE

Utility for know all informations and settings of terminal where the utility is loaded. The informations that you can know are for example:
- The path of folder where the terminal start
- The path of folder where the terminal store the indicators, experts advisors etc
- The path of common folder
- The permission to use DLL, to automated trading etc
- The permission to send email, FTP or notifications to smartphone
and many other informations
FREE

Script to calculate equity and balance at a specific date and time.
This script makes up for a lack of MetaTrader account history, that does not show how the balance and equity changes in time.
Balance calculation includes closed orders only.
Equity calculation includes orders closed before and orders that are still open at the specified time.
Example: date and time set to 2020/07/06 00:00. If I had a Buy 1 lot EURUSD position opened at price 1.12470 on the 2020/07/02, the program woul
FREE

Description :
Combination EA MT5 is a simple Expert Advisor based on Combination MT5 custom Indicator. The Indicator is incorporated in the EA, therefore you don't need it as a separate tool for the EA to operate. Combination MT5 custom Indicator is based on Stochastic Oscillator and Average True Range (ATR), both are set to their default values. If you wish, you can download Combination MT5 custom Indicator for free from my product page .
The Expert Advisor settings are as follows :
Ma
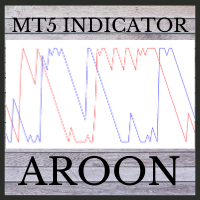
This indicator is powerful for detecting the trend.
The crossing between to line is the entry signal. Buffer 0 is UP line. Buffer 1 is DOWN line. Note: 1. Aroon is great tool for trending detecting. Please try to select the best period for each instrument.
Input AroonPeriod =14- Aroon period
MailAlert =false- Send email when entry signals appeared.
SoundAlert =false- Notify on MT5 platform.

Utility for know the performance of your acoount.
From dialog you can filter data in this modes:
- You can include or not include the open positions - You can include or not the closed positions - You can filter the data by date (from, to) - You can filter the data by simbols (multi selection) - You can filter the data by magic number (multi selection)
On bottom of table, are show the total of:
- Number of data - Total size - Total commissions paid - Total swap paids - Total profits - T

Индикатор построен на основе индикаторов VIX и RSI. Комбинация двух указанных индикаторов позволяет обнаруживать зоны крайней перепроданности, где цена с большой долей вероятности изменит направление. Наиболее сильные сигналы дает в периоды слабого тренда. Сигналом индикатора является изменение направления гистограммы (с роста на снижение) выше заданного (сигнального) уровня.
В индикаторе задан широкий спектр параметров, который позволяет оптимизировать индикатор для торговли любыми активами:

Currency Strength Meter is the easiest way to identify strong and weak currencies. The indicator shows the relative strength of 8 major currencies: AUD, CAD, CHF, EUR, GBP, JPY, NZD, USD.
By default the strength value is normalised to the range from 0 to 100 for RSI algorithm: The value above 60 means strong currency; The value below 40 means weak currency;
The indicator is created and optimized for using it externally at an Expert Advisors or as a Custom Indicator inside your programs.
Hi. PortfolioHedgingStopOrderOneSymbol-trend EA for opening orders from mid-channel on the third wave Elliot, is working on the breakdown of the level from a custom indicator TMA channel width with fixed S / L and T / P. this EA is designed to determine the best entry point into the market after the correction. if you have confirmation of a strong trend movement, but if you are a novice and still doubt the correctness of your actions, it is always better to wait for the correction to finish and

Renko is a timeless chart, that is, it does not take into account the time period, but the price change, which makes the price change on the chart clearer.
Hyper Renko is the indicator that provides this.
To configure, you only have one parameter, the size of the candle in the tick * you want to use.
* tick: is the smallest possible variation of an asset.
Thank you for choosing a Hyper Trader indicator.
Wikipedia: A renko chart indicates minimal variation in the value of a variable -
FREE

The Hyper Force indicator, originally created in 1984 by David Weis, indicates in wave form the strength of a symbol's trend.
The bigger the wave, the stronger the trend.
Small waves mean weak trend or market without trend.
In a wave, the greater the difference between one bar and another, the stronger the trend.
When the distance between one bar and another begins to decrease, it means that the wave has started to lose its tendency.
So catching the wave with a strong force and going
FREE

Questo indicatore riconosce un tipo speciale di formazione Inside Bar che è formata da una grande candela Master seguita da 4 candele più piccole (vedi la spiegazione della strategia di seguito). Caratteristiche Traccia le linee di stop di acquisto/vendita sul grafico, nonché i livelli di take profit e stop loss. I livelli TP/SL si basano sull'indicatore ATR (Average True Range). I colori degli oggetti sono modificabili. Ti invia un avviso in tempo reale quando viene identificata una formazione

Representation of the intercept value of the linear regression and the mean absolute deviation symmetrically to the intercept value.
PARAMETERS
• Periods: number of periods to calculate linear regression
• Amplitude: multiplier of the absolute mean deviation to define the bands
• Displacement: displacement on the horizontal axis
• AppliedPrice: price on which the calculations are made
• MainPlot: display of the main plot
• UpperPlot: display of the upper band
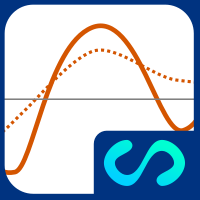
Representation of the slope value of the linear regression. It has a reference plot to visually determine changes in the slope value (acceleration / deceleration of the price).
PARAMETERS
• Periods: number of periods to calculate linear regression
• PeriodsReference: number of periods for the calculation of the moving average on the values of the main plot
• Displacement: displacement on the horizontal axis
• AppliedPrice: price on which the calculations are made
•

Great smart dashboard for market analytics.
Using this dashboard you can: find signals from different indicators from all timeframes ; find signals from the Moving Average from all symbols ;
Include: 9 indicators (10 in Mt5 version); 27 signals (29 in Mt5 version); "Total" page.
Indicators and signals: MOVING AVERAGE MA cross Price - MA crosses Price; MA more/less Price - MA higher/lower Price; BOLLINGER BANDS BB crosses Price (in) - Price crosses Bollinger (upper/lower line

The Metatrader 5 has a hidden jewel called Chart Object, mostly unknown to the common users and hidden in a sub-menu within the platform. Called Mini Chart, this object is a miniature instance of a big/normal chart that could be added/attached to any normal chart, this way the Mini Chart will be bound to the main Chart in a very minimalist way saving a precious amount of real state on your screen. If you don't know the Mini Chart, give it a try - see the video and screenshots below. This is a gr

Thread indicator is calculating possible values for the upcoming periods. It is built by author’s system, with ability to learn. Input data ( recommended interval ): Sensitivity to oscillatory motion (integer value, 0 - 8) increase of value shifts priority of calculation towards high-frequency vibrations (increase loads the system) Shift of diagram (integer value, 0 - 8) shifts output of indicator to the right Diagram forecast (integer value, maximum 10) defies the number of periods calculated
FREE
Conversion of ".set" files created in the MT5 terminal for use in the MT4 terminal. The script is great for cross platform experts.
How to work: place the source files ".set" in the local terminal folder\MQL5\Files run the script the ".set" files for the MT4 terminal appeared in the local terminal folder (the end of the file name "* -MT4.set")
Created on MT5 build 1755 from 18/01/18 Please leave your feedback after using.
FREE

Join Deriv link on profile>>>
The best time to trade Using this Indicator is when the time reach exactly hour,half,45 minutes,15 minutes and sometimes 5 minutes..
This indicators is helpful to those who trade boom and crash indecies.How to read this indicator first you'll see Blue allow and Red allow all these allows used to indicate or to detect the spike which will happen so the allow happens soon before the spike happen.This indicator works properly only in boom and crash trading thing

An algorithm to detect a spike instantly with zero lag.. Use default settings for "Crash And Boom" This smart algorithm detects a spike, which can be use to filter out market spikes, give entry signals with exit. Trading:- Booming for Boom and Crashing for Crash
Spike Signal:- The less you decrease the more signals
Multiplier:- This multiplies the Signal
Time Ratio:- For adjusting the Signal
AlertProperties = "====== Alert Properties ======";
SendAlertViaAlertWindow:- if set to true it wil

Create and trade timeframes in seconds. The bar time duration is freely adjustable from 1 second and up. The chart is accurately constructed using real ticks from the broker's server. Main characteristics The indicator is an overlay on the main chart, making it possible to utilize one-click trading and on-chart order manipulation. History calculated using real tick data. Built-in technical studies: 4 moving averages (Simple, Exponential, Smooth, Linear-weighted, Volume-weighted using tick or rea
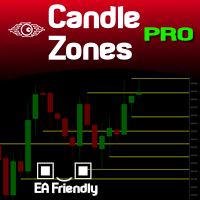
You probably heard about Candlesticks behaviors, which in most of the times could denote and trace Volume behaviors even if you are not watching Volume itself... Well, this indicator will do this. Naked traders love to rely solely on candlesticks patterns and with Candle Zones you can trap special patterns and DRAW THEM on your chart. As simple as that. There are several filters you can tweak in order to achieve the analysis you want. Just give it a try. After several months of testing, we think

AKT for MT5 (Traders Club)
機能: MAゴールデンクロスで買いサイン、デットクロスで売りサインを表示します。 MAの期間は短期足と長期足を入力できます。 MAの種類を選択できます。(SMA、EMA、SMMA、LWMA) 適用する価格を選べます。(CLOSE,OPEN,LOW,HIGH,MEDIAN,TYPICAL,WEIGHTED) サインをアラートで通知します。 サイン発生をE-mailやSNSで通知します。 表示するサインを変更することが出来ます。
サインの色を変更することが出来ます。
サインの表示された時間と価格が表示されます。
※価格は終値になります。
Indicator Noを変えることによるこのインジケータを複数適用することができます。
これにより違う MAの期間による ゴールデンクロスと デットクロスのサインを
表示できます。

ResiSupo (Traders Club)
このインジケータは直近の高値と安値を抜いたときに何ら方法で 知る方法はないかと思い開発されました。
機能: 指定したローソク足の本数で終値をベースに最高値と最安値の ラインを自動で引きます。 最高値と最安値のラインにタッチするとアラートで通知します。 通知はE-mailやSNSにも送信することができます。 最高値と最安値のラインを終値か高値または安値ベースにするかを選択できます。 Indicator Noを変えることによるこのインジケータを複数適用することができます。 これにより過去80本と20本などでの最高値と最安値のラインを引くことが可能になります。 現在のATRの値を画面に表示します。 これにより現在のボラリティーの状況が一目で分かります。 表示されているSLはディフォルトではATR値の1.5倍になっています。 この数値は現時点でのボラリティーの状況からの損切り幅の目安となります。 ATRのレベルにより表示の色が変わります。 ボタンを押すことによりアラートの通知を無効にできます。 ※ネットワークの不安

Old Partridge knew markets which are almost as old as the Earth itself are never wrong. The legend says he knew how to beat a legion of others. This system he will to me. This system I will give to you.
Example [1] = 100 pips, profit boundary [2] = 2.0, take profit [3] = 400, stop loss [4] = 200 You buy EURUSD as 1.1440. SL will be set to 1.1420, TP will be set to 1.1480, when EURUSD = 1.1460 SL will be moved to 1.1450 EA works with the pair it is run on, [5] option allows to escort positions
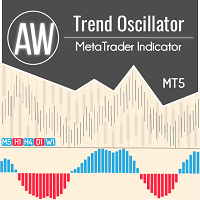
Oscillatore di tendenza con sistema di filtraggio avanzato. Determina la tendenza, il suo indebolimento e rafforzamento. Ha un pannello multi-timeframe integrato. AW Trend Oscillator funziona su qualsiasi timeframe e su qualsiasi simbolo (valute, indici, petrolio, metalli, azioni). Versione MT4 -> QUI / Risoluzione dei problemi -> QUI Caratteristiche e vantaggi:
Filtraggio trend avanzato Modifica della sensibilità dell'indicatore in un clic Installazione facile Pannello a più intervalli
MetaTrader Market - i robot di trading e gli indicatori tecnici per trader sono disponibili nel tuo terminale di trading.
Il sistema di pagamento MQL5.community è disponibile per tutti gli utenti registrati sul sito MQL5.com che effettuano transazioni su MetaTrader Services. Puoi depositare e prelevare denaro usando WebMoney, PayPal o una carta di credito.
Ti stai perdendo delle opportunità di trading:
- App di trading gratuite
- Oltre 8.000 segnali per il copy trading
- Notizie economiche per esplorare i mercati finanziari
Registrazione
Accedi
Se non hai un account, registrati
Consenti l'uso dei cookie per accedere al sito MQL5.com.
Abilita le impostazioni necessarie nel browser, altrimenti non sarà possibile accedere.