“GRAPHICS SETTING” are all the graphics settings of your panel that will not influence your trading apart from the last 2 before the CSV settings which generally should not be touched and we will see later.
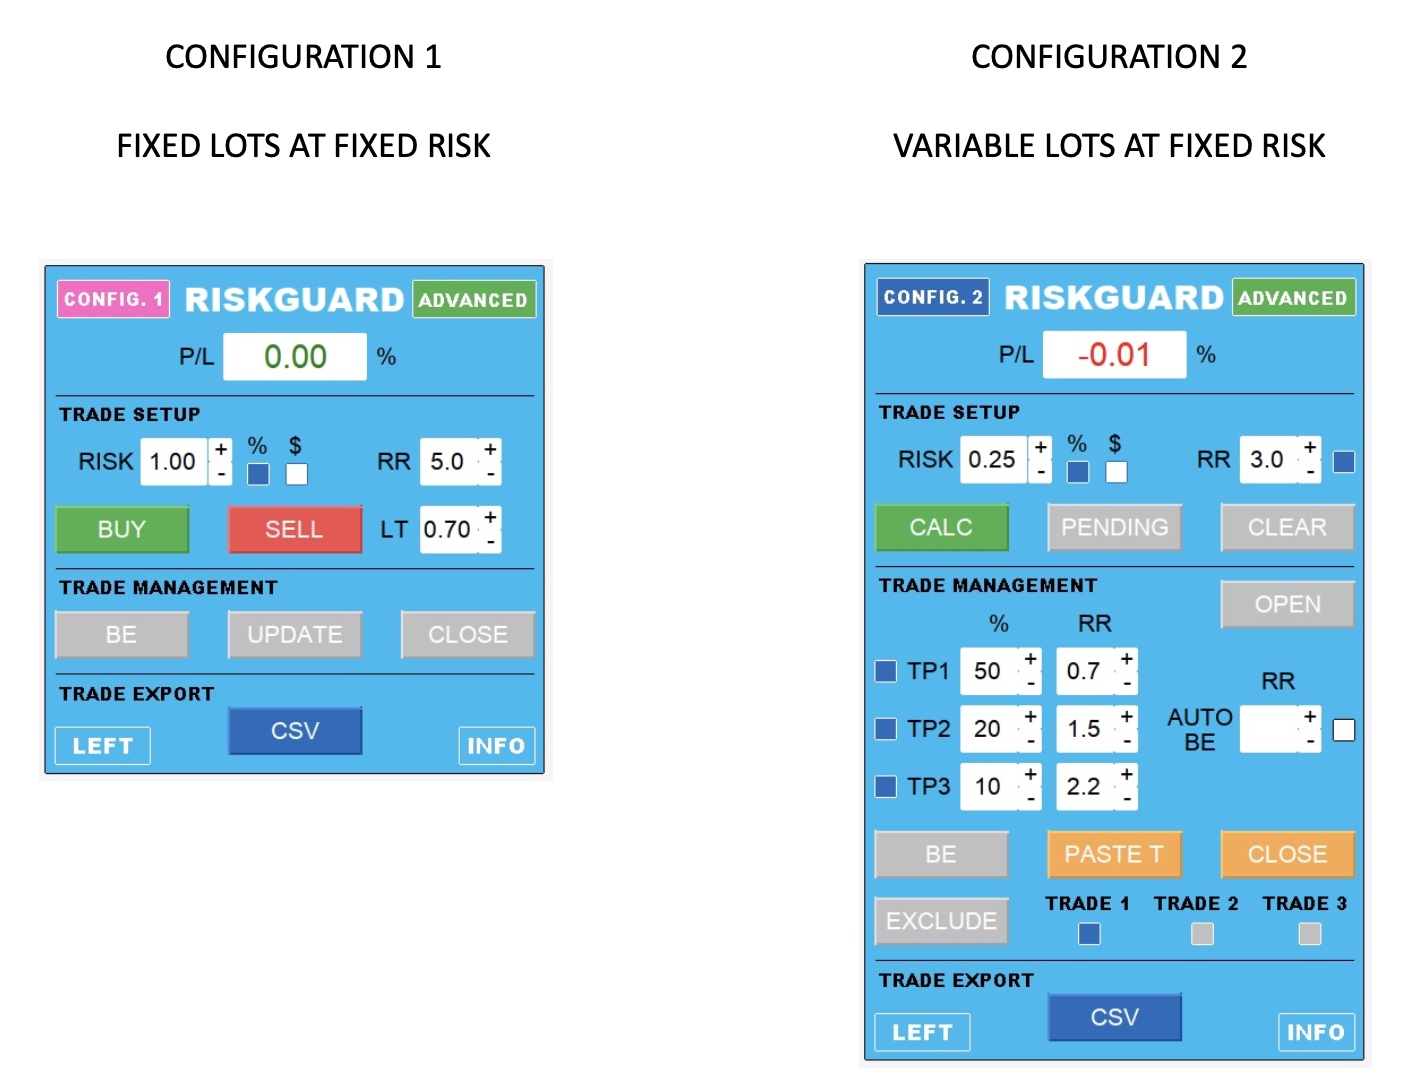
To switch from one configuration to another just click on the CONFIG button at the top left.
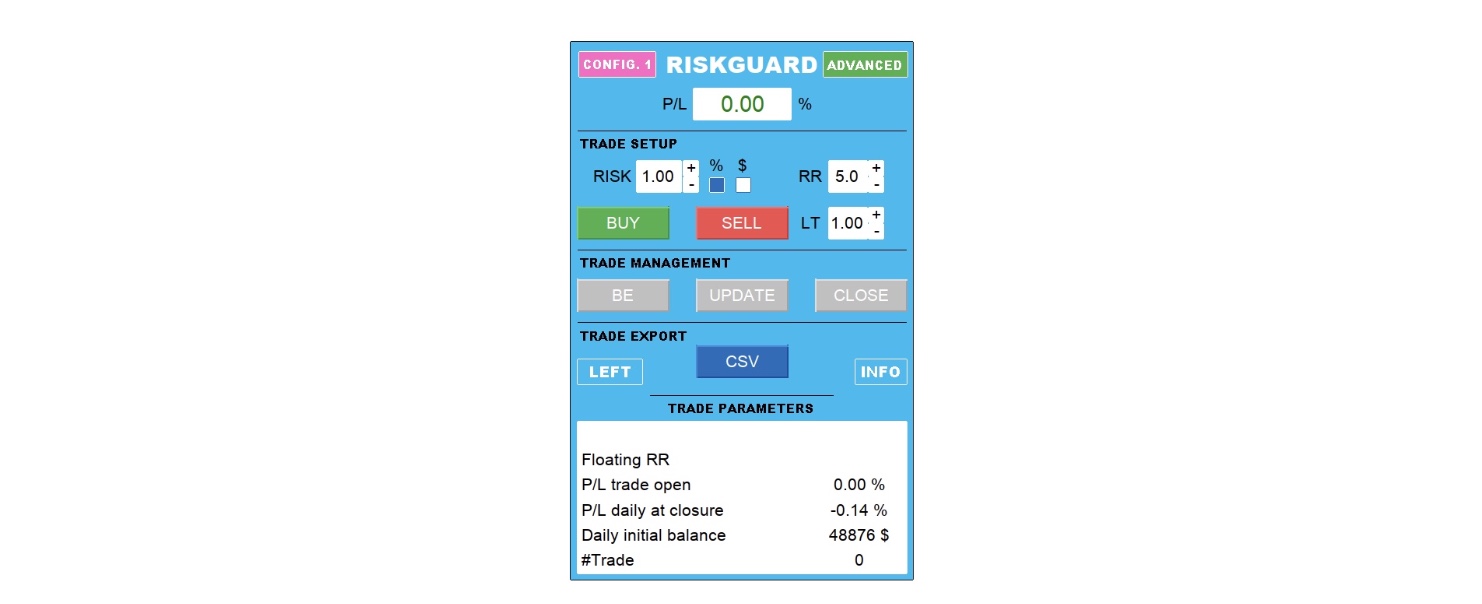
2 hidden buttons are the word RISKGUARD and the value in the P/L box, by clicking on the value of the P/L box you can switch from displaying it as a percentage to money to points or no value to display. While clicking on the word RISKGUARD will reduce the entire panel like the following photo

Clicking the INFO button at the bottom right will expand the panel with the parameters you have chosen on the settings.
 This setting is to choose the trader level and accordingly sets the various limits. Below are the limits for each level:
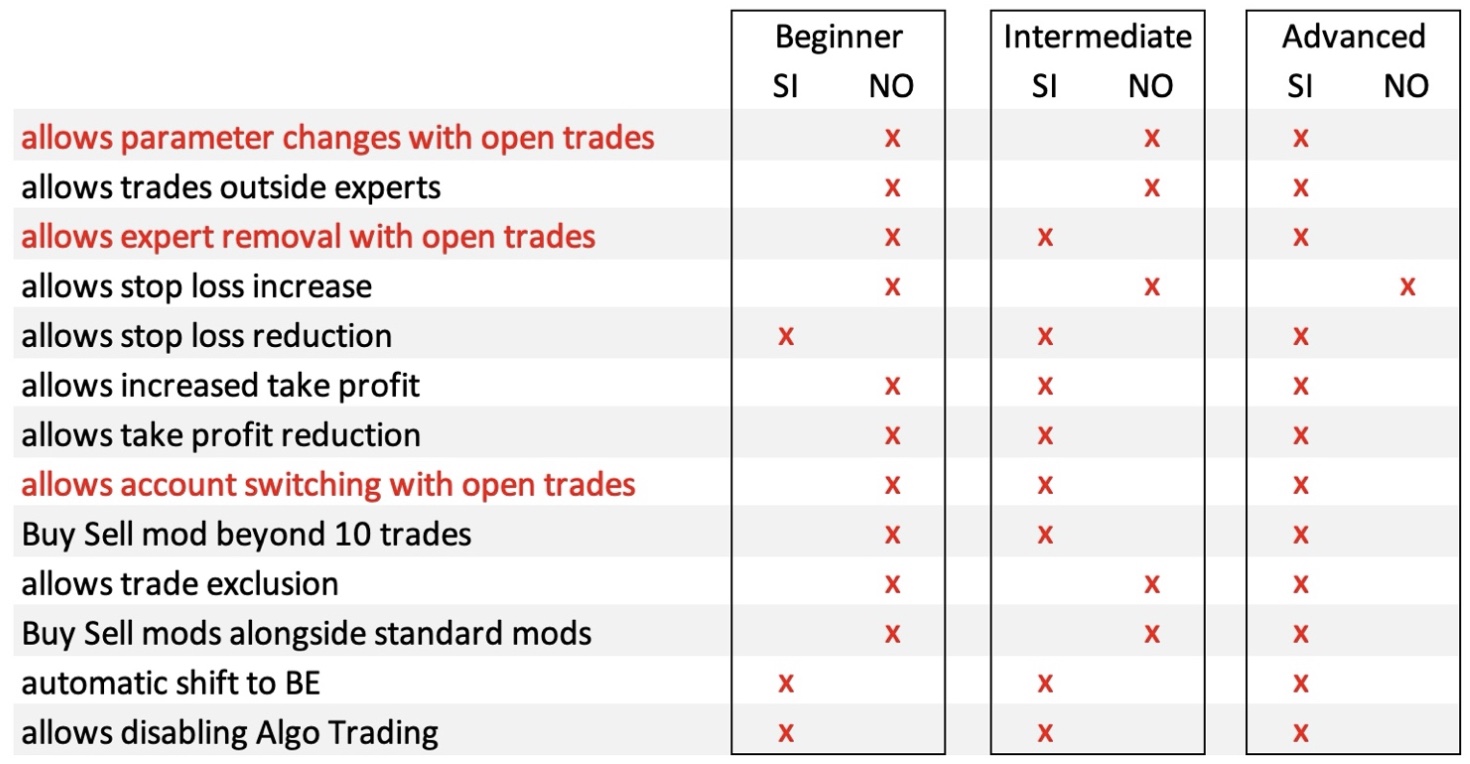
Pay attention to the points highlighted in red, in these cases where not permitted will close the open orders on that instrument or upon removal of the expert or upon re-entry into the account (depending on the situations). While if you disable Algo Trading based on the selected trader level you will be prevented from using the expert for a certain amount of time on that account so as not to be tempted to deceive RiskGuard to exit the trading plan. It is recommended to set the checkbox only to allow algorithmic trading on instruments - options - Expert Advisors.

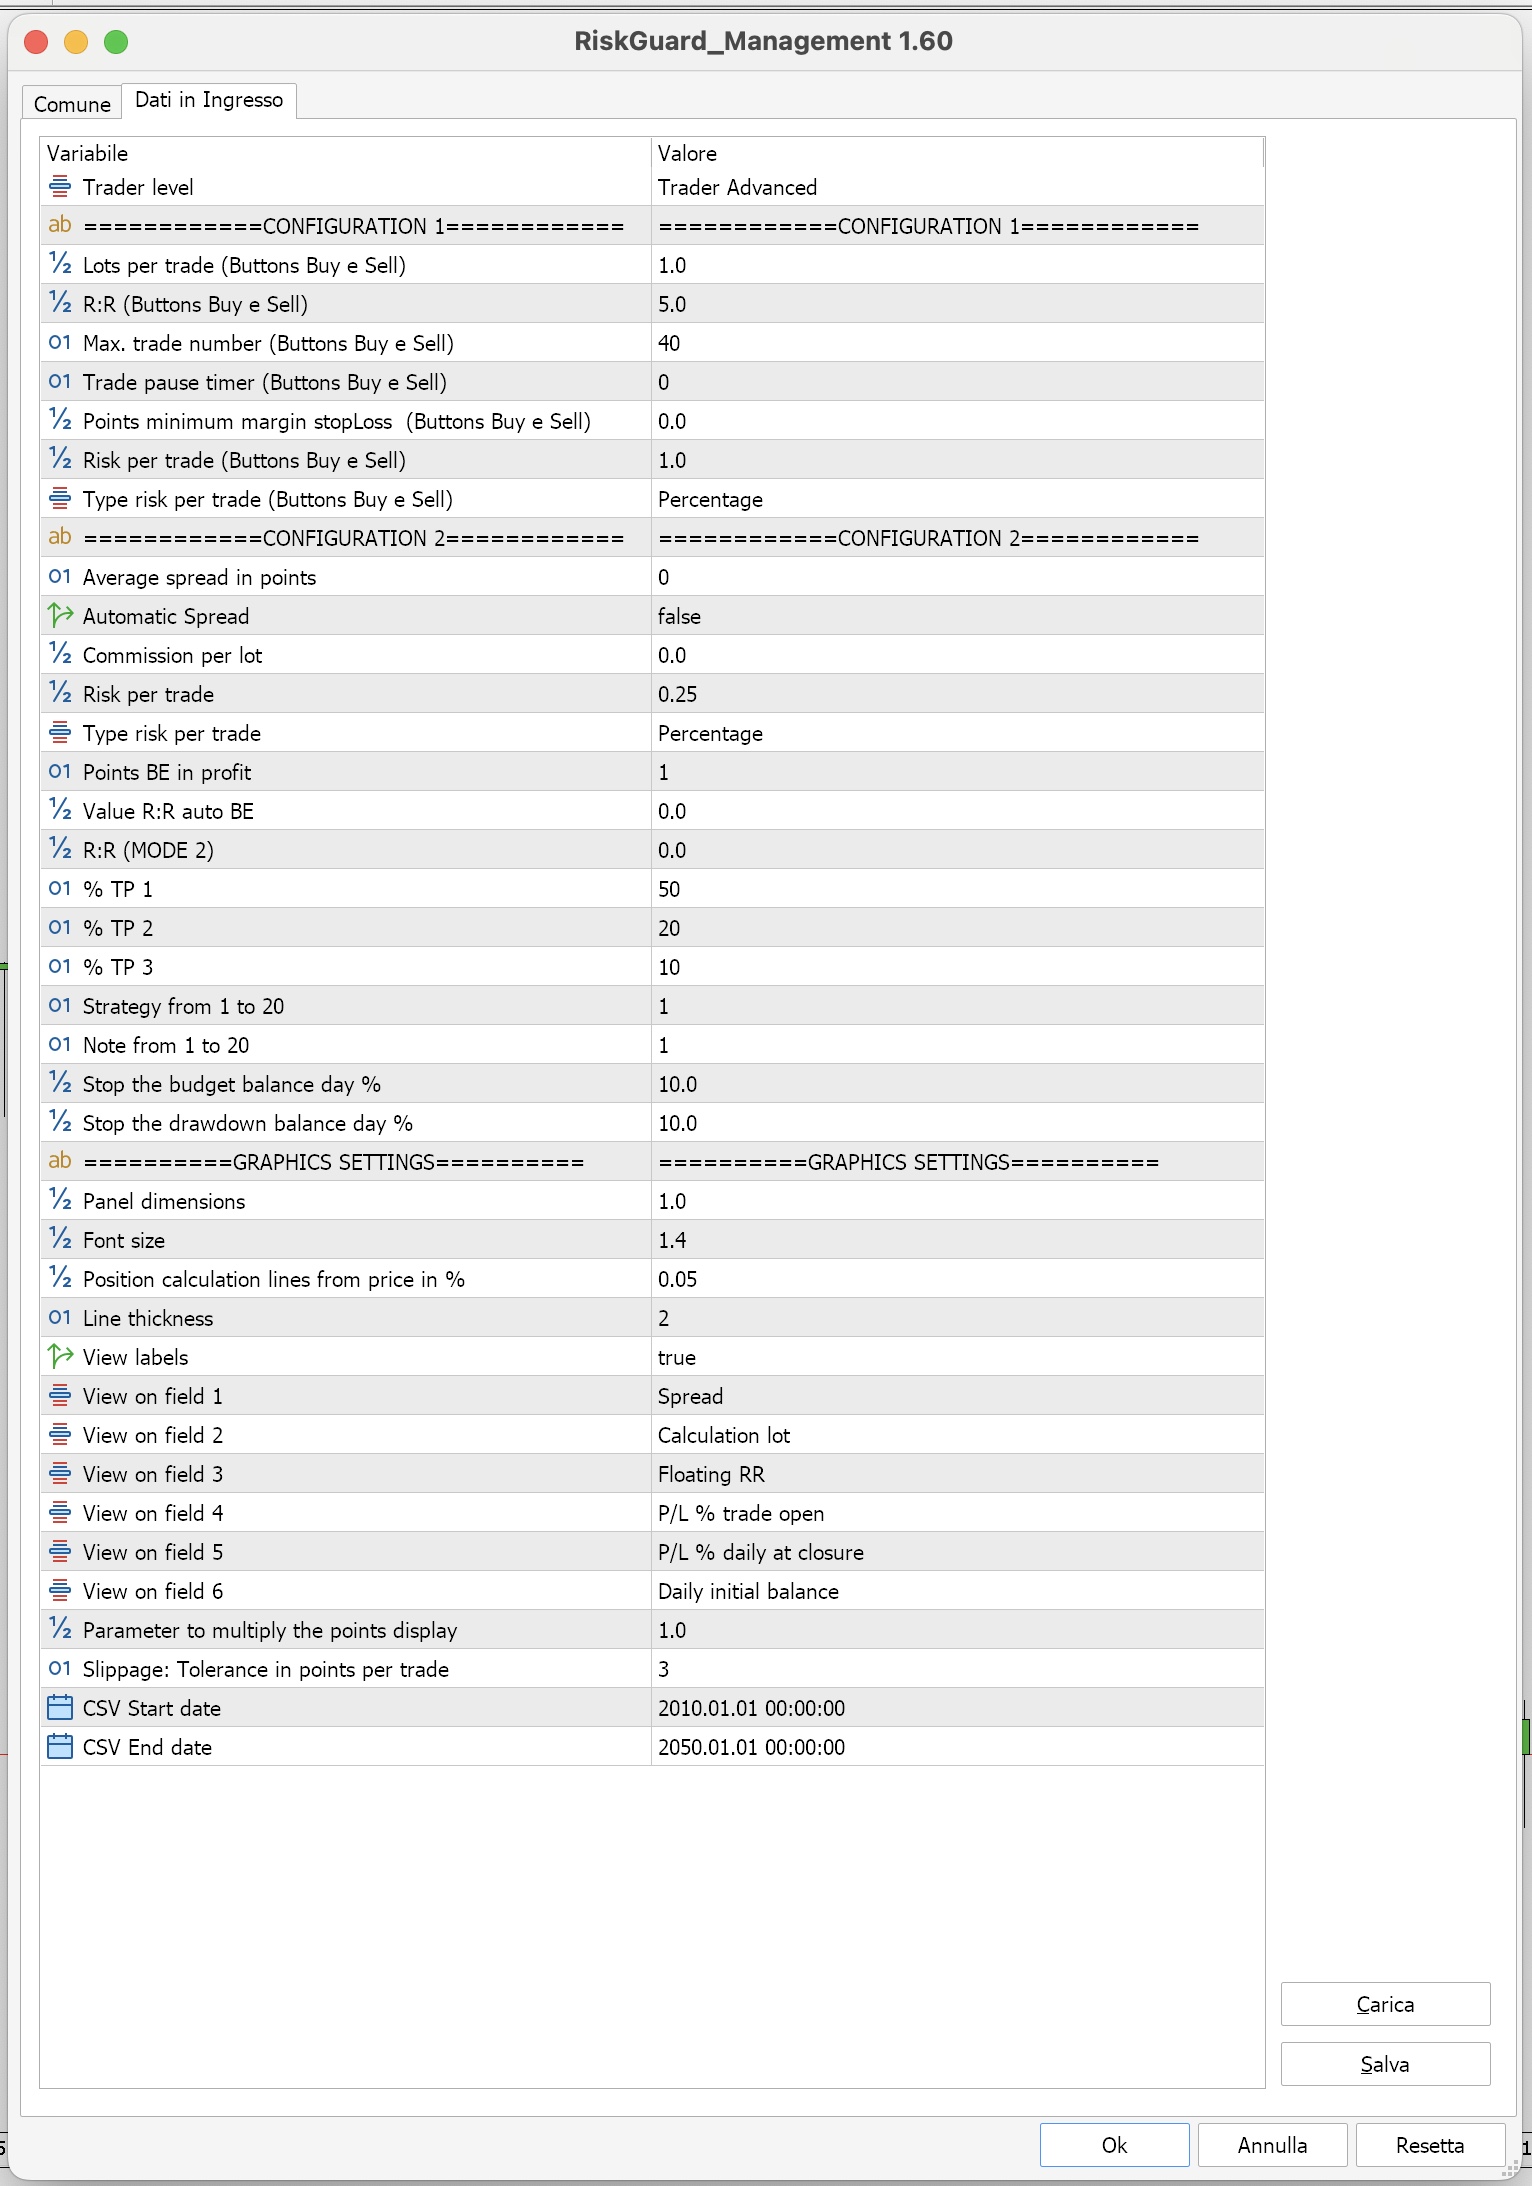
 Fixed size value to use with the “Buy” and “Sell” buttons.
 When opening a trade, the expert will set a stop loss level and a take profit level which cannot be changed. I recommend setting the take profit level wider as this type of trading is generally closed manually. with the “Close” button
 Maximum number of orders allowed in the same operation (for "Beginner traders" the maximum is however 10).
 This setting is a value expressed in seconds and will block the “Buy” and “Sell” buttons for the set time (useful to avoid issuing orders hastily)
 Setting expressed in points which will prevent you from adding an order if that order would bring the distance between the current price and the stop loss to a value lower than the one set.
 Choice of risk per trade, in this case the example shows a risk of 1% of your balance per trade. You have the possibility to choose a risk in % or in economic value
Let's now move on to "CONFIGURATION 2"
 This is one of the most useful parameters for the less experienced as we are used to only displaying the Bid price on a chart. This parameter, which must be set for each instrument, allows you to automatically set the stop, take and entry price in case of pending, taking into consideration the spread that we declare. The return risk that the expert will indicate to us also takes into account the spread.
 This parameter, if set to true, works exactly like the point described above except that it automatically sets the value of the spread by calculating the spread at the exact moment in which the operation is opened.
![]() This parameter is useful for those who use accounts with commissions (raw), putting the commission value that your broker provides you at the time of calculating the lot will set the value in such a way that your loss is the total of the commissions.
This parameter is useful for those who use accounts with commissions (raw), putting the commission value that your broker provides you at the time of calculating the lot will set the value in such a way that your loss is the total of the commissions.
 Exactly like the parameters of configuration 1 to give the possibility of choosing a different risk between one configuration and another.
![]() This parameter is actually used for both modes, both configuration 1 and configuration 2. When the "BE" button is pressed it will move the stop loss level, in this case 1 point above the entry price or the average price in the case of “CONFIG. 1”.
This parameter is actually used for both modes, both configuration 1 and configuration 2. When the "BE" button is pressed it will move the stop loss level, in this case 1 point above the entry price or the average price in the case of “CONFIG. 1”.
![]() This parameter allows you to set the return risk which, once reached, will automatically move the stop to BE. It only works with Senior Trader level as this type of function is only active on the currently active account. If your trade is on a second account this function will be executed when you log into your account.
This parameter allows you to set the return risk which, once reached, will automatically move the stop to BE. It only works with Senior Trader level as this type of function is only active on the currently active account. If your trade is on a second account this function will be executed when you log into your account.
![]() This parameter gives you the possibility of maintaining a pre-set risk-return ratio when calculating your operation. Obviously you are also free to change it from the operator panel.
This parameter gives you the possibility of maintaining a pre-set risk-return ratio when calculating your operation. Obviously you are also free to change it from the operator panel.
 These 3 levels are for partializing an operation, the value 50 means that I am closing 50% of my initial size. Example initial size of 10 lots at the first stage will close 5 lots, at the second stage another 2 lots at the third stage another 1 lot leaving 2 open lots.
 Here you can set the strategy and notes you prefer by default. Each time the trade is opened, after clicking on calc, the two fields will also appear on the panel and from there you can modify the values. once the trade is opened it will no longer be possible to change the strategy and note of that trade. You will also find these notes and strategies automatically in the journal to be able to carry out an analysis with all the possible combinations.
![]() This function serves as a daily safety stop, the expert will take the value of the balance from 00:00 (server time) for example balance 100,000 dollars upon reaching 90,000 dollars of equity he will close all orders of all instruments with active expert that are been inserted with expert or not. This feature also works only on the account currently in use.
This function serves as a daily safety stop, the expert will take the value of the balance from 00:00 (server time) for example balance 100,000 dollars upon reaching 90,000 dollars of equity he will close all orders of all instruments with active expert that are been inserted with expert or not. This feature also works only on the account currently in use.
![]() This function is exactly like the function described above with the difference that the percentage will be taken from your maximum daily balance. Example for the first trade of the day the stop level will be the same as above 90,000, but if our maximum daily balance has reached 110,000 10% will be on 110,000 so the stop will be at 99,000.
This function is exactly like the function described above with the difference that the percentage will be taken from your maximum daily balance. Example for the first trade of the day the stop level will be the same as above 90,000, but if our maximum daily balance has reached 110,000 10% will be on 110,000 so the stop will be at 99,000.
Let's now move on to the "GRAPHICS SETTINGS"
![]() This parameter allows you to increase or decrease the size of the panel on the graph.
This parameter allows you to increase or decrease the size of the panel on the graph.
![]() This parameter allows you to increase or decrease the size of the text in the panel on the graph.
This parameter allows you to increase or decrease the size of the text in the panel on the graph.
![]() This parameter is used to adjust the distance of the stop and take lines from the current price each time the “Calc” button is pressed
This parameter is used to adjust the distance of the stop and take lines from the current price each time the “Calc” button is pressed
![]() This parameter is used to adjust the thickness of the graph lines except the dotted lines indicating the spread which will always have a fixed size.
This parameter is used to adjust the thickness of the graph lines except the dotted lines indicating the spread which will always have a fixed size.
![]() This parameter is used to choose whether to display the labels placed in the graph lines. True are visible and false are hidden.
This parameter is used to choose whether to display the labels placed in the graph lines. True are visible and false are hidden.
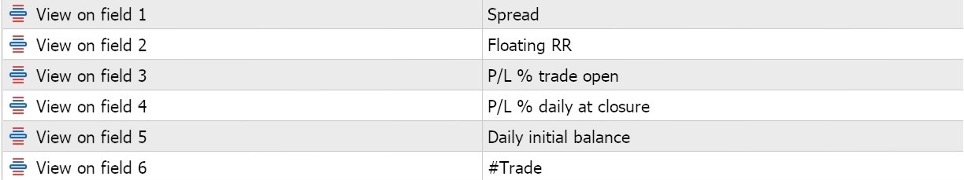 Here you have the possibility to choose what to display in the 6 fields that appear in the info table
![]() This parameter is used to change the display on the panel of those parameters that display the points, by decreasing the multiplier you can switch to pips for convenience.
This parameter is used to change the display on the panel of those parameters that display the points, by decreasing the multiplier you can switch to pips for convenience.
![]() This parameter is used to set the maximum slippage accepted to execute or not an order (if we issue a pending purchase order at the price of 1.0000 on eurusd in case of high volatility it means that we will accept to buy within a tolerance of 3 points, in addition will not issue the order)
This parameter is used to set the maximum slippage accepted to execute or not an order (if we issue a pending purchase order at the price of 1.0000 on eurusd in case of high volatility it means that we will accept to buy within a tolerance of 3 points, in addition will not issue the order)
 Here you choose the start and end dates of the trades and balances to export to csv.
Now let's see how to use the panel on the graph
A small premise: the panel is dynamic both in the value fields and in the buttons which are colored based on whether they can be used or not. this update occurs every minimum change in the "Bid" price so if you are in a moment of low price volatility and for a few seconds the price does not move you will also see the panel stopped and if you press a button it may seem slow in execution but in reality It doesn't depend on the expert but on the price. Everything was built to be as fast as possible using an update at each point which is the minimum change in price.
Let's see how to issue orders in "CONFIGURATION 1"
To issue orders in CONFIGURATION 1 and therefore with a fixed lot, once the parameters have been set, simply press either buy or sell and you start entering the orders, automatically if you press the buy button the sell button will be deactivated and the stop loss and take profit level will be set which cannot be moved, with each order added the levels will adapt to maintain the loss and gain in RR set among the parameters. You will notice that the stop and take prices in the orders will not be the same in all orders, this is done specifically as some prop firms place limits on the number of changes and orders executed daily. To get around this limit I have inserted an "Update" button which allows the trader when to update all the orders by putting the stop and take level equal for each one, in any case if the price touches the red stop line or the green line of take the expert if active on the current account will close all orders but will still be slightly slower than having a stop already updated on the broker's server.
Let's see how to issue orders in “MODE TRADE 2”
To open a trade in mode 2, simply press the "CALC" button and the 2 stop and take lines will appear. Simply drag them where you want to position your levels and press the "OPEN" button to issue the order. If you want to output a pending, just press “CALC” then “PENDING”, drag the levels and finally press “OPEN”. Partial TP levels can be easily added later by pressing the respective buttons and dragging the orange lines to the desired level.
Copy trade function
An important button is the "PASTE T" button which is useful for those who use multiple accounts and want to replicate operations. For each trade that opens, the expert stores the Stop loss, Take profit, and entry price level if it is pending. Simply move to another account and by pressing the "PASTE T" button it will show you the levels of the last trade executed on a graph and you can confirm and open the trade with the "OPEN" button or move the levels to your liking and then open the trade.
Excludes Temporarily
This button is used to temporarily exclude a trade from our expert, it can only be used when we have already reached 3 trades in "CONFIGURATION 2". We can select our trade to exclude using the “Trade 1-2-3” button and then press “Exclude Temporarily”. By temporarily excluding the trade, the stop loss and take profit will always be active and can be modified by the trader. What will no longer be active if they were present will be the partial TP levels. At this point it will be possible to add a further trade from our expert. To report our excluded trade on our expert it will obviously be enough to have a free space (therefore no more than 2 trades on our instrument) and by switching from one account to another it will automatically be reported on our panel. Even just by recharging the current account, the expert will bring it back to our panel.
CSV export and security.
The export from metatrader and the subsequent import into excel works in a completely safe way for the trader and he will have no risk of compromising his trading account. Using metatrader we are going to create a .CSV file which is a text file.
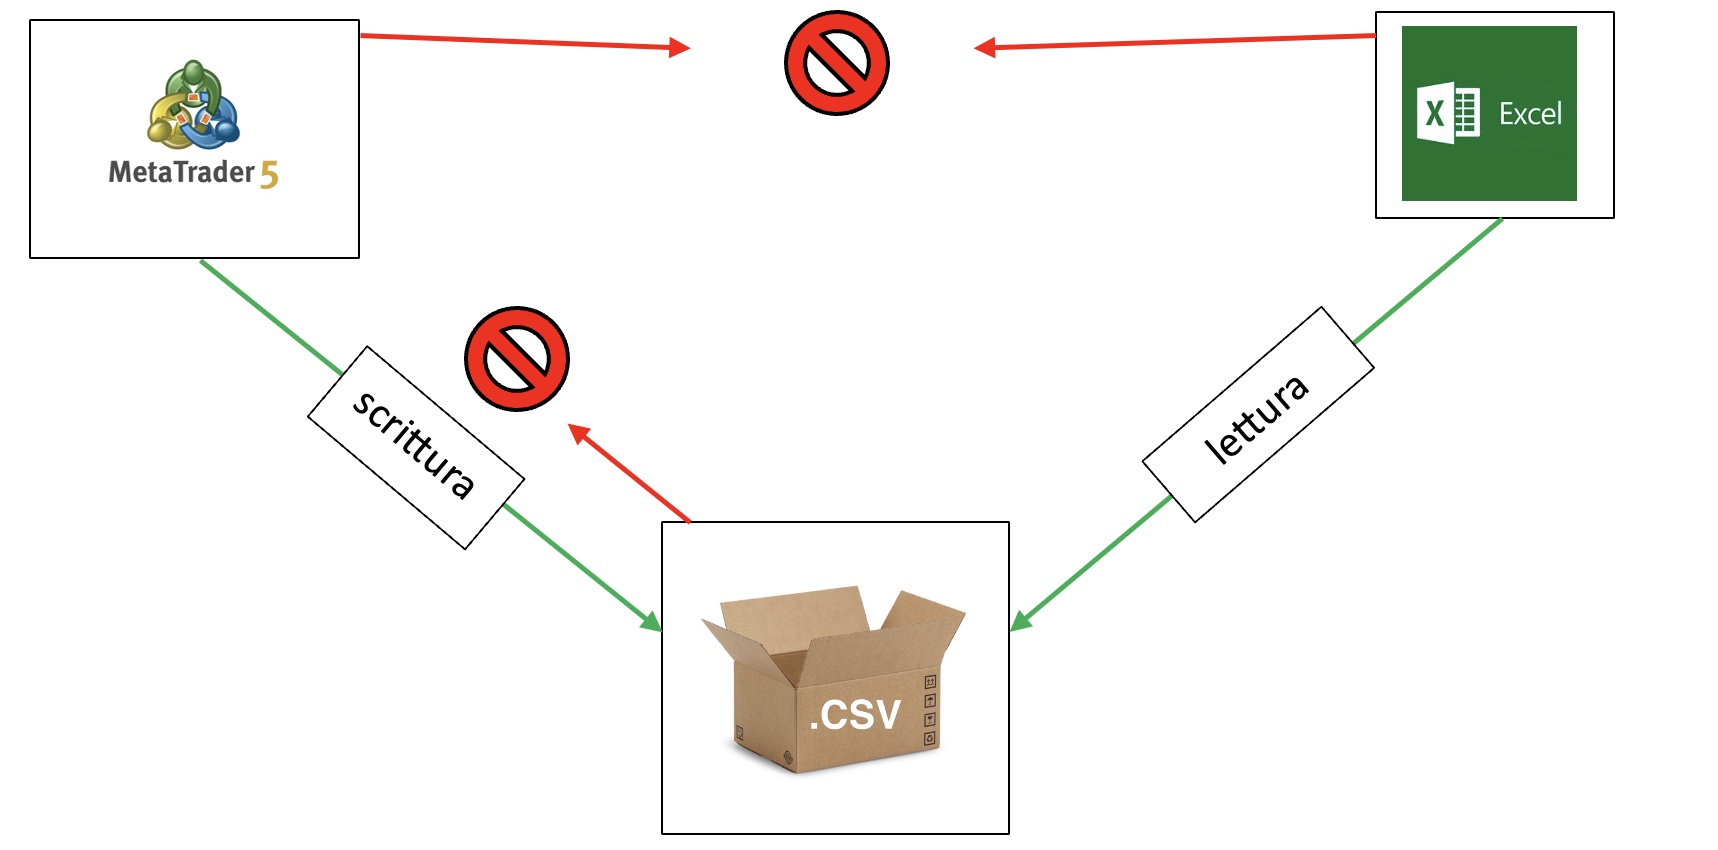
Metatrader will write into this file the data of our trades and the account number taken from the history (not knowing the password or membership or anything else of this account). The .CSV file has no way of communicating with metatrader but only metatrader has the ability to write to the .CSV. Using Excel we then read the data in the .CSV file and copy and reprocess them internally in Excel, this makes the entire system completely safe as Excel does not interface with metatrader and metatrader has one-way communication with the .CSV file
Below is a diagram of how communication occurs
Connect excel to the .CSV file
Once we press the CSV button in our metatrader panel it will create the "RiskGuard_Management.csv" file. this file is created inside the “MQL5” folder then in the “Files” subfolder. For Windows, connecting Excel to the CSV is simpler as this folder can be reached without any problem, while for Mac OS a small precaution may be necessary as a Windows virtualizer is often used to make metatrader work.
Let's see the procedure for connecting Excel to the CSV. First of all, we must activate the macros on our Excel file. On Windows, before opening the "RiskGuard_Management.xlsm" file, you will need to select it, right-click and press Properties. Check Cancel Block as shown in the image
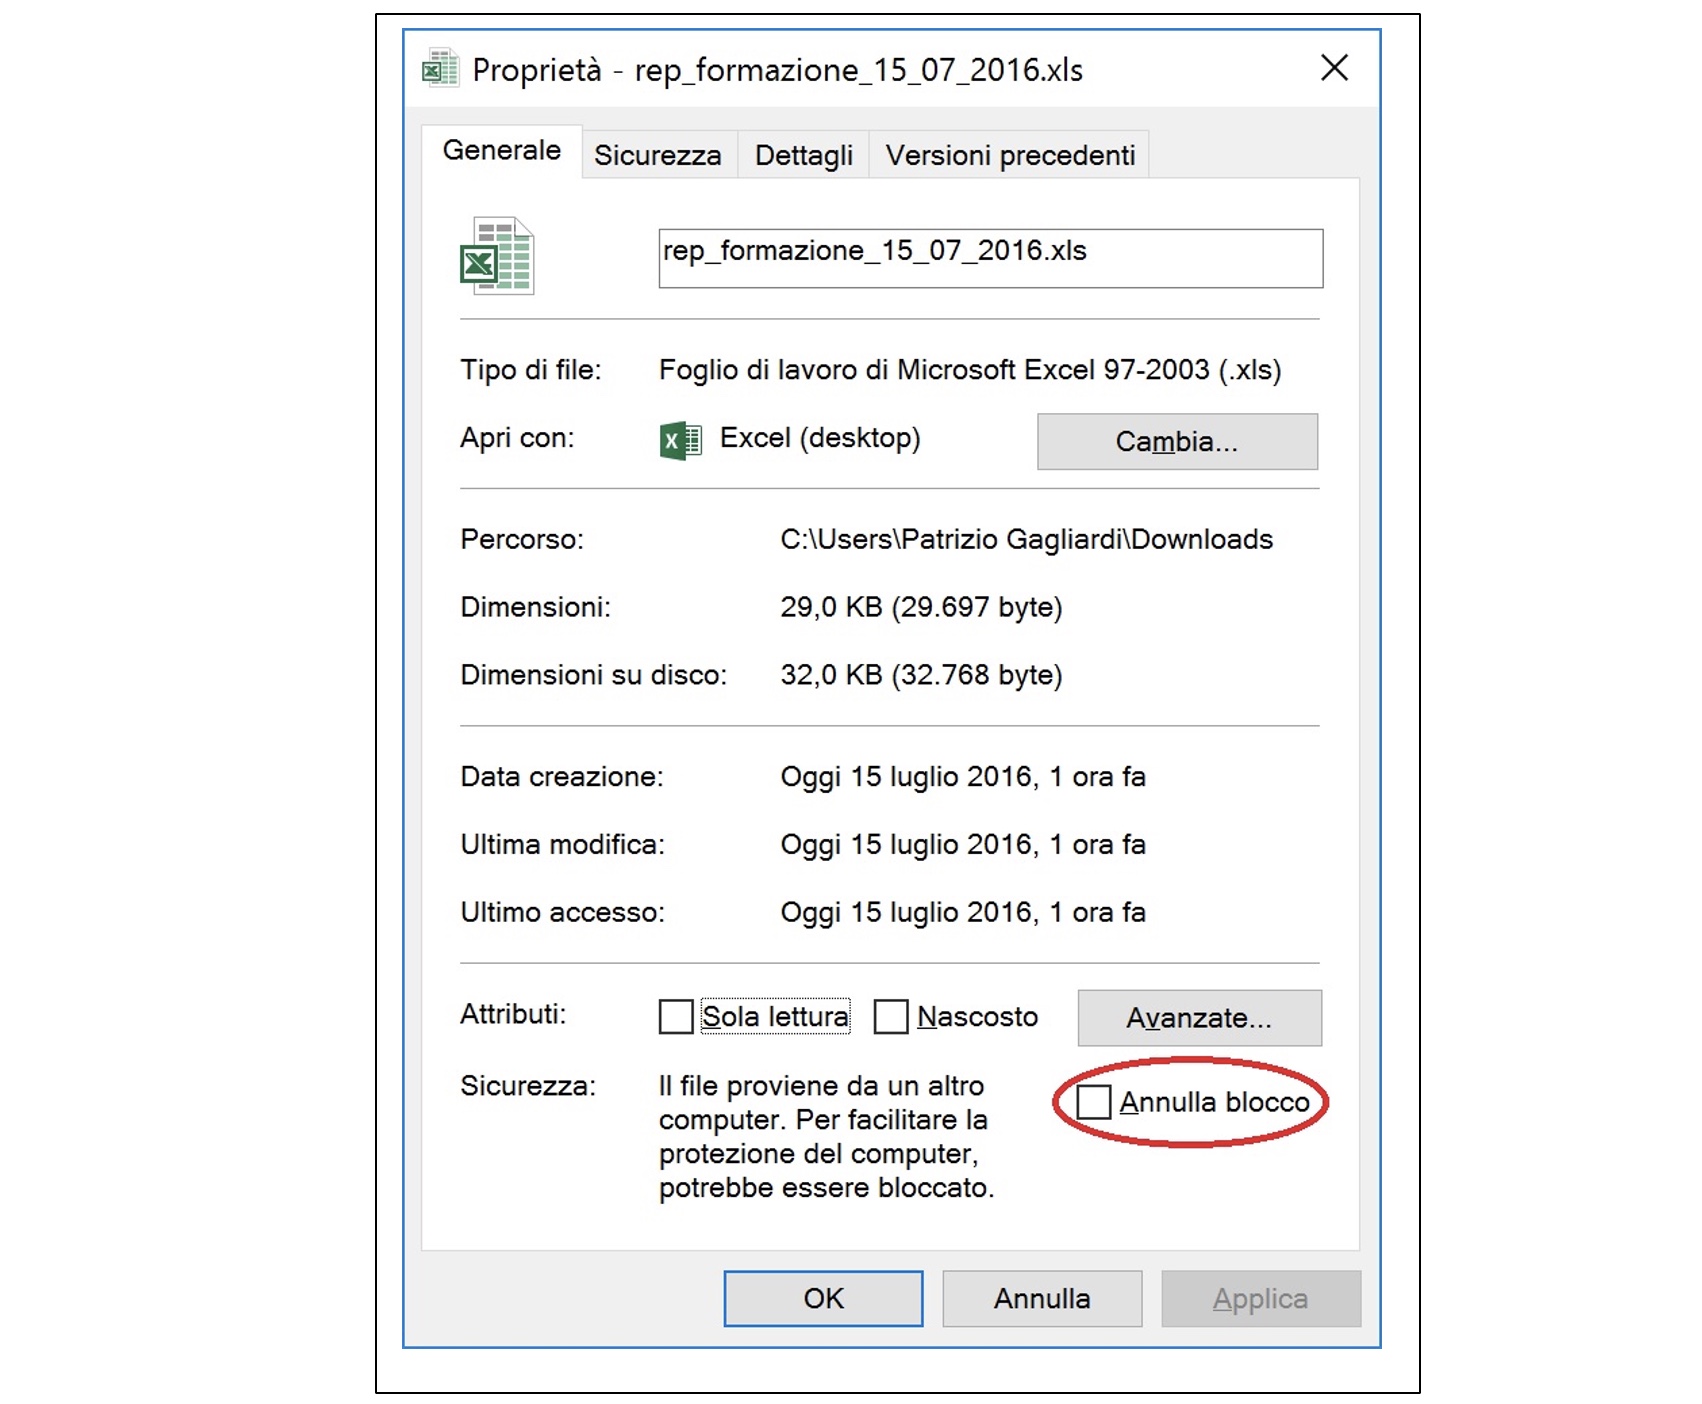
Then once you open the file in the security settings you will find the macros to activate. If so, look online for some guidance based on your version of Excel. Once you have activated the macros, it will be time to connect Excel to the CSV.
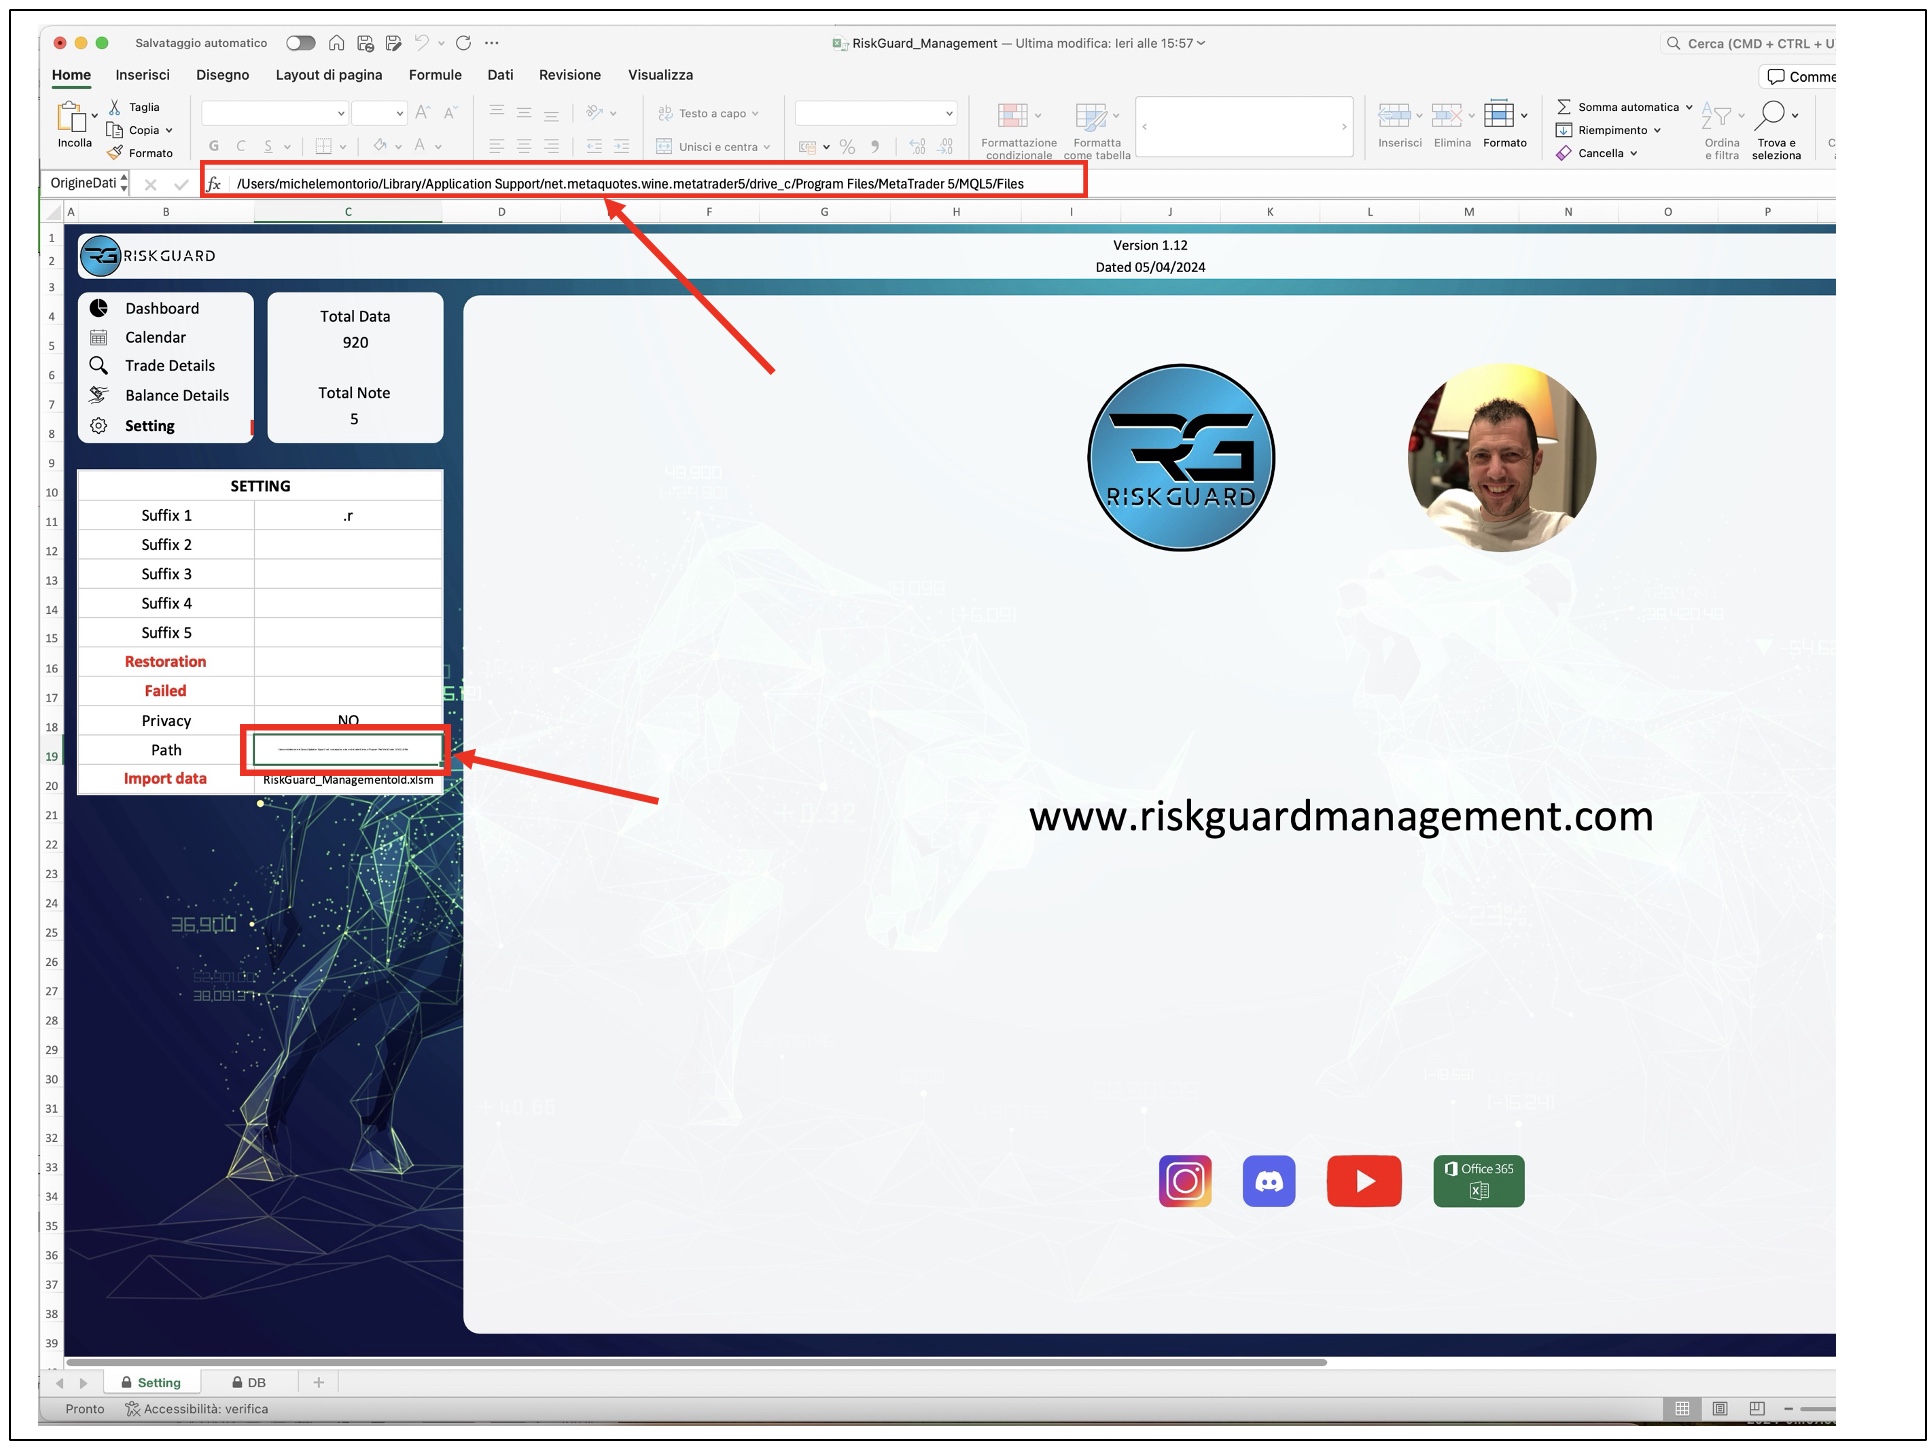
On the file setting sheet you will find the Path cell and there you will paste the path of your PC where the RiskGuard_Management.csv file is located (be careful that the name "RiskGuard_Management.csv" must not also appear but only the path to where the file is located ).At this point you have linked the excel file to the csv and you are finished.
I'll post some pictures of the procedure
INSTRUCTIONS FOR USING THE EXCEL DASHBOARD
To import your trades, simply click the Repeat button with solid color filling that you find at the top right of your dashboard, another point to know if you have multiple trading accounts and some of your brokers insert suffixes on the instruments, for example EURUSD they call it EURUSD.r and you are pleased to be able to do a better and more in-depth analysis that all your accounts do not have this suffix, just go to the settings sheet and in the suffix column you will find 5 boxes in which to put your suffixes that you want to remove during import. In the following image you can see that I wrote .r and the file will automatically remove the .r from all instruments of any account

To reset/delete an account, simply select it in the setting in the box to the right of the Restoration button and then click on the word Restoration which acts as a button, selecting total instead will delete all the accounts. While if you have an account on propfirm and lose it you can declare it failed simply by selecting it in the box to the right of the word Failed and then pressing the button still on the word Failed.
STRATEGIES
You will find 3 strategies inside the dashboard, ST-98 will be all the trades you have made with MODE TRADE 1 and therefore with the BUY and SELL buttons. at the closing of the operation if you go to view the Trade Details if you made your operation with 10 buy entries from 1 lot you will see a line with the size of 10 lots, the opening price will be the average price of your trades. MODE TRADE 2, in this case the stop loss value will be the first value set at the opening of the trade. If during your operation you moved the stop to be or to profit you will still see the opening one so that you can always calculate the return risk on the individual trade. For trades in which you have taken partials you will display the closing price not that of the actual closing of the trade but the weighted average between price and partials again in order to correctly display the return risk. The ST-100 strategy is all the trades opened outside the expert.
GRAPHS AND TABLE IN DASHBOARD
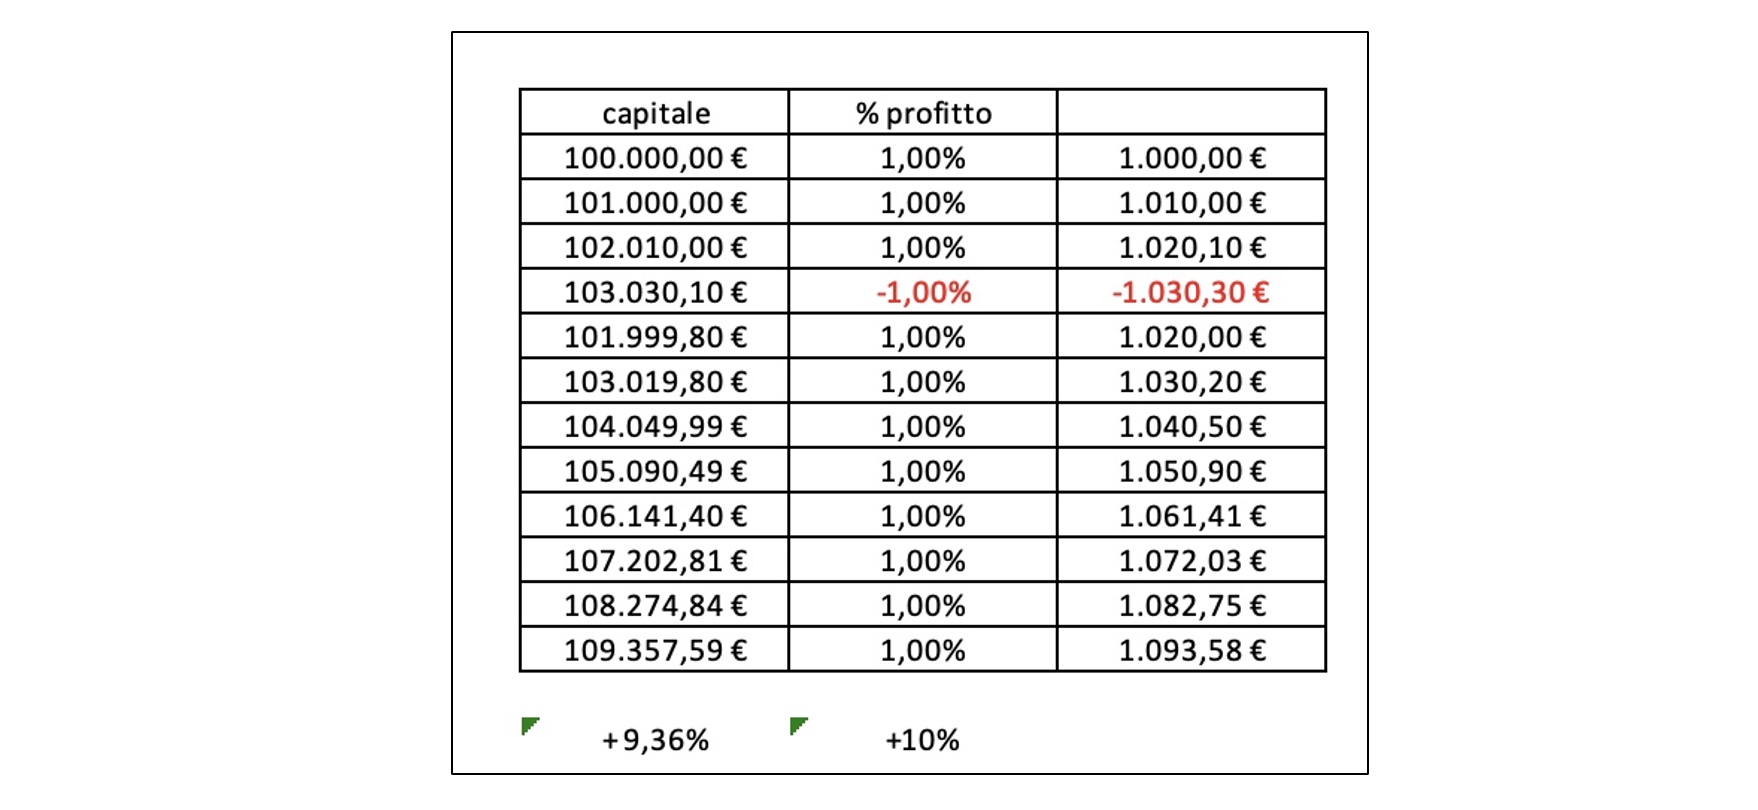
In the dashboard the % where c and * are not actual percentages, in the sense that they are the sum of the percentages of each individual trade. This is done specifically to be able to do multiple analyzes between multiple accounts/periods/strategies at the same time, in this case they only give a rough idea. I'll give an example in a table with an initial capital of 100k with 10 operations with a profit of 1% and a 1% loss. For a total of 11 operations you will see a +10% displayed in the dashboard but in reality the correct calculation should see the initial capital therefore 100,000 and the final one 109,357.59 therefore a +9.36%