CalcFlat Creative
- Indicateurs
- Ivan Simonika
- Version: 1.0
- Activations: 5
CalcFlat Creative is a flat indicator.
This is a more advanced version of the CalcFlat indicator. Three lines have been added for this indicator, which significantly improve the performance of the predecessor indicator. In addition to the two existing levels that the user reacted to and which were static, now the indicator has three dynamic lines on top of the main chart and interpreted as:
- signal line base,
- signal minimum,
- signal maximum.
These lines are formed due to the additional indicator parameter Avg, which represents the actual average value of the histogram. Such a strong averaging forms a line close to the direct level (which we set statically), but this is an improved line that is generated dynamically. Thus, the main signal line is calculated. Two more lines, the maximum and minimum signal lines, are formed as remote from the signal line and are set by the Activity parameter.
Options
- Slow - Forming parameter of the indicator No. 1.
- Fast is the forming parameter of indicator No. 2.
- Avg is a shaping parameter for a dynamic signal line.
- Activity is a shaping parameter for dynamic level lines.
- OnFixed – Fix below the specified levels as indicator limits.
- FixedMaximum - the maximum level (each timeframe has its own), for static levels.
- FixedMinimum – minimum level (for each timeframe, its own), for static levels.
The indicator can be used as a base indicator, everything that is described in the text regarding the CalcFlat indicator can be used for this indicator (CalcFlat Creative).
Thanks to the dynamic signal lines of the indicator, you can build additional rules of operation. Consider examples.
Comment. The trend is set by a trend indicator, for example, a standard Moving Average.
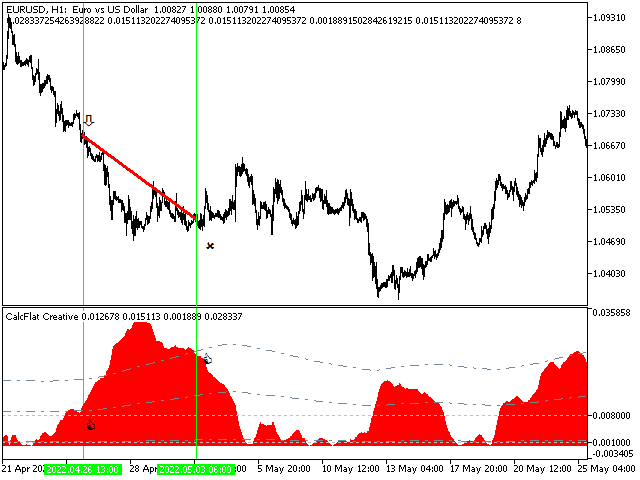
- Let's start from the first screenshot. Entry when the main line crosses the middle signal line, respectively, the downward arrow on the price chart. Exit when the main line crosses the upper signal line down, on the chart the cross symbolizes the exit from the position. The red sloping line characterizes the profit from such an operation. This approach allows you to jump on the current trend. Such situations occur quite often during a normal trend with rollbacks. If the figure is not fully formed, it is necessary to provide an additional way out of the position.
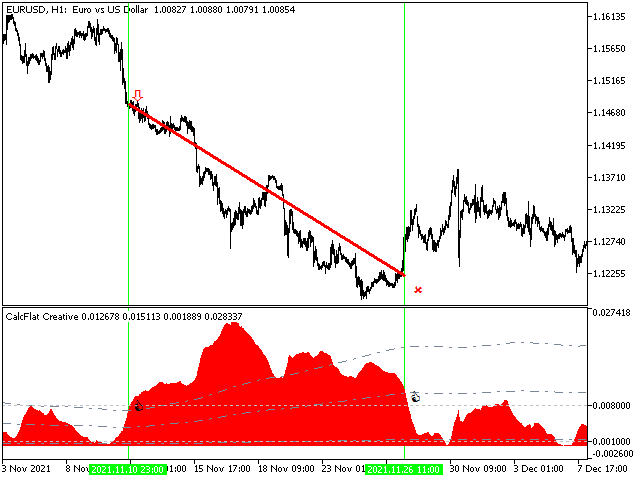
- Let's analyze the second screenshot. Entry at the intersection of the main line of the upper signal on the price chart down arrow. Exit when the main line crosses the middle signal line to the bottom, symbolizing a cross on the price chart - exit from the position. The red sloping line characterizes the profit from such an operation. This approach allows you to jump on the current trend. Such situations occur during a protracted trend with a minimum of pullbacks and rarely happen.
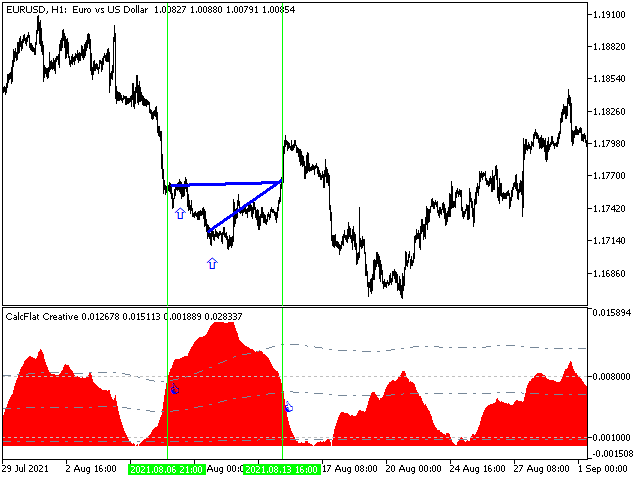
- The third screenshot is an analogy to the second screenshot in terms of entries, but this option happens more often - this is a variant of a trend with pullbacks. That is, we jump into the trend at the moment of its indicative center, which means that there will be a rollback after it, and if we use the martingale strategy, then we will very likely return to the zero point. And such situations will most often arise. If we still do not return and a long and protracted trend occurs, then it is necessary to close the series in the red on a rollback, which can be fixed by the same indicator.
