• Aperçu
  • Avis (5)
  • Commentaires (9)
  • Nouveautés

Golden Spikes Detector

2.67

Golden Spikes Detector

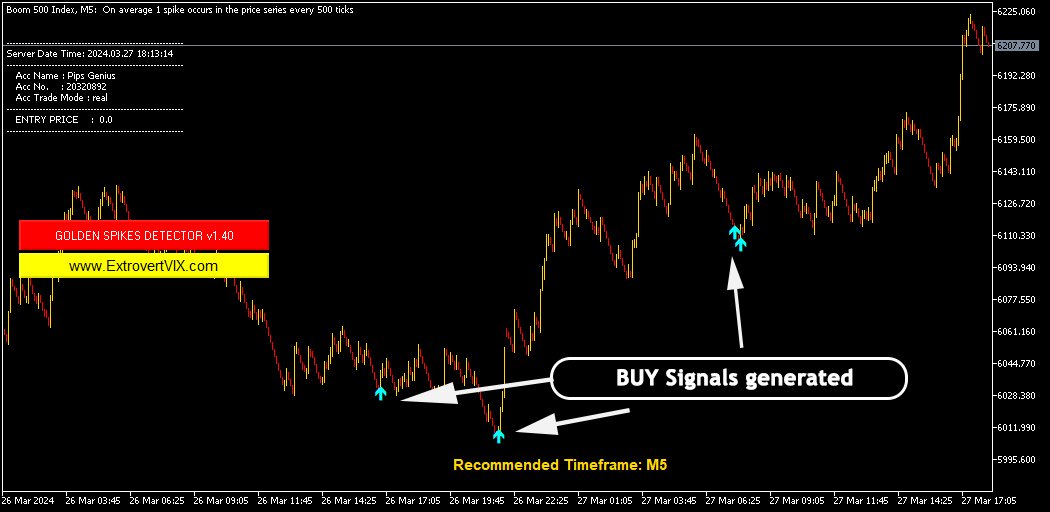
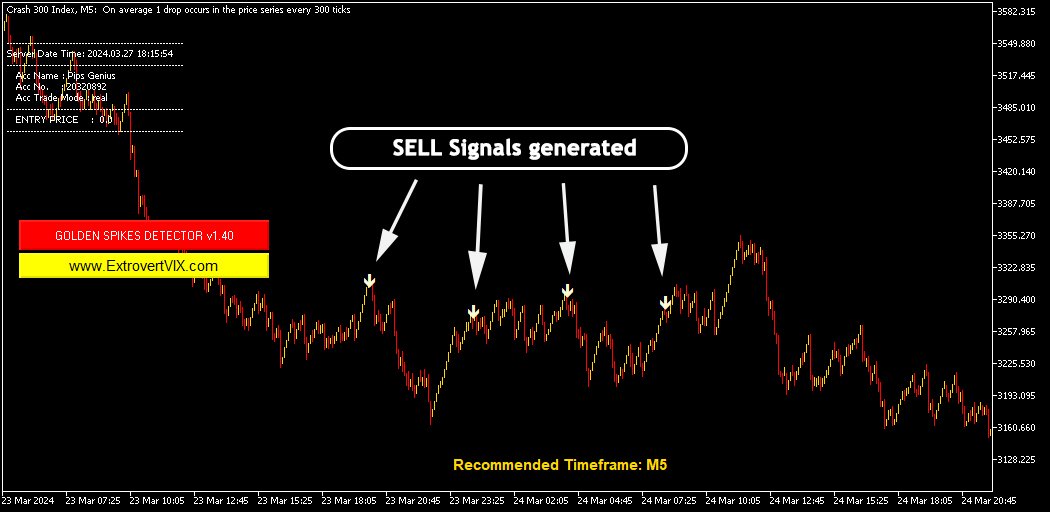
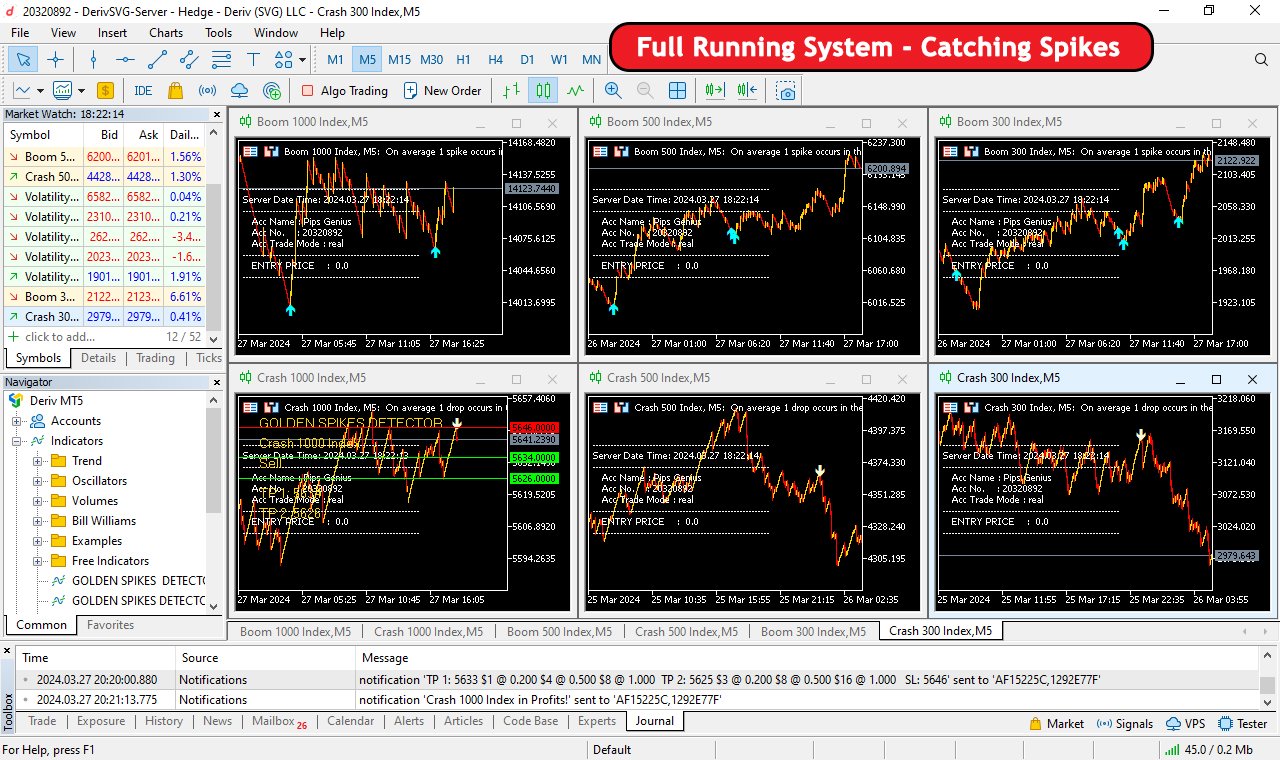
Cet indicateur est basé sur une stratégie avancée principalement pour les pics de trading sur les indices Boom et Crash. Des algorithmes complexes ont été mis en œuvre pour détecter uniquement les entrées à forte probabilité. Il alerte sur les entrées potentielles d’achat et de vente. Pour échanger des pics sur le courtier Deriv ou Binary, prenez uniquement les alertes Buy Boom et Sell Cash. Il a été optimisé pour être chargé sur une période de 5 minutes, bien qu'une analyse de plusieurs périodes soit effectuée en arrière-plan.
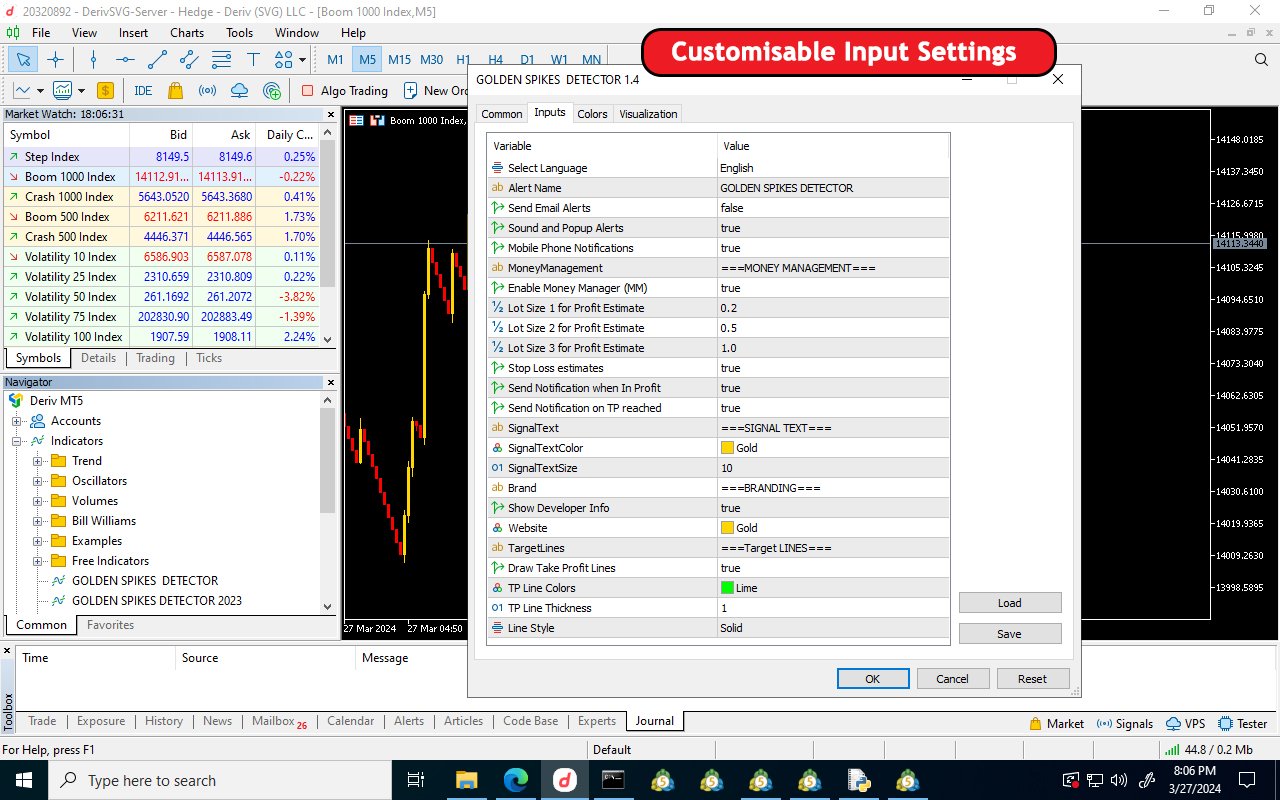
Caractéristiques

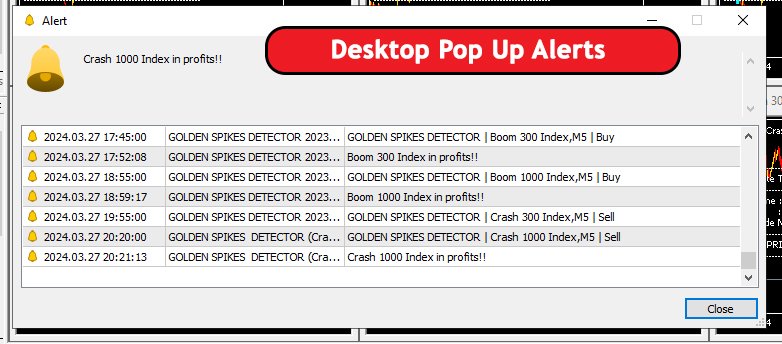
·            Fenêtre contextuelle du bureau et alertes sonores sur ordinateur ou ordinateur portable

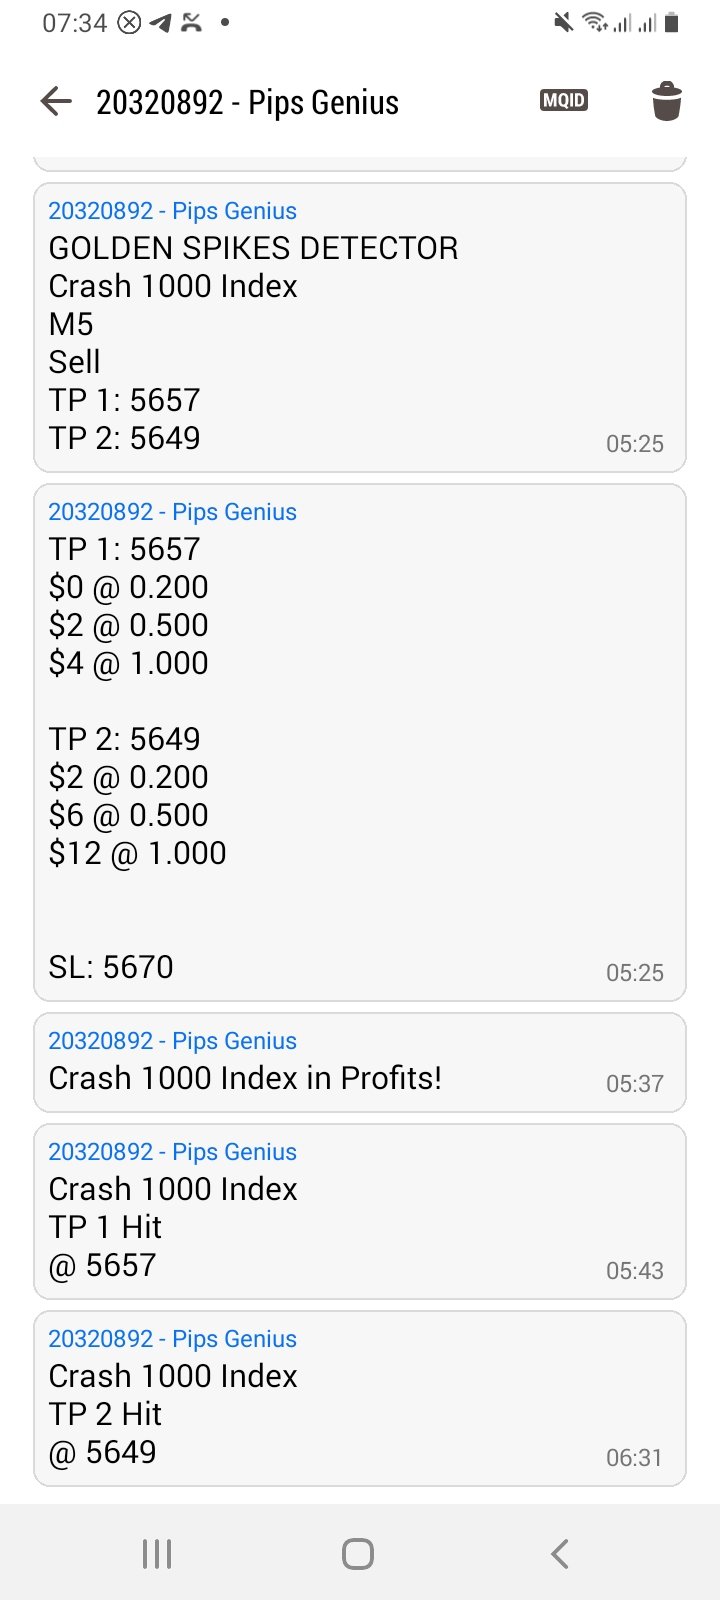
·            Envoie des notifications push au téléphone mobile

·            Envoie des notifications par e-mail

·            Affiche les flèches non repeintes (flèches vers le haut pour l'achat des indices Boom et flèches vers le bas pour la vente des indices Crash)

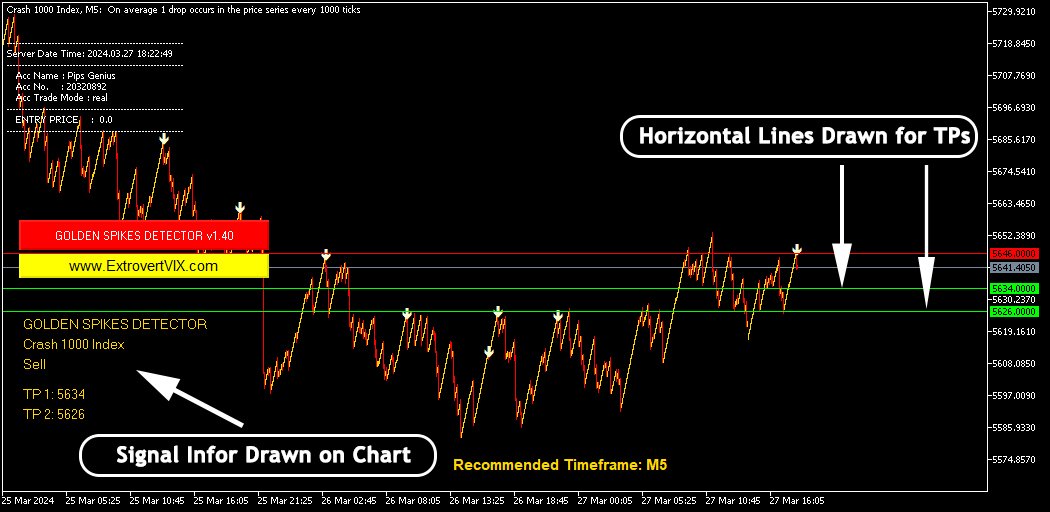
·            Donne deux estimations de profit. Lignes horizontales tracées pour une observation facile

·            Donne de bonnes estimations de stop loss pour minimiser les pertes en cas de pertes

·            Alertes lorsque les niveaux de profit sont atteints

·            Prise en charge de plusieurs langues : anglais, français, espagnol, portugais et malais


Recommandation

·            Utilisez un serveur privé virtuel (VPS) pour les alertes 24h/24 et 7j/7 sur téléphone mobile

·            Utilisez un délai de 5 minutes

·            Situé sur toutes les cartes Boom 1000, Boom 500, Boom 300, Crash 300, Crash 500 et Crash 1000

·            Estimez le Take Profit et le Stop Loss à proximité des zones de support et de résistance

·            Soyez patient, les signaux à forte probabilité ne se produisent pas toutes les minutes, mais lorsqu'ils maximisent les profits

Contacter le développeur

Site Web : www.extravertvix.com

Courriel : pipsgenius@extravertvix.com

Chaîne télégramme : https://t.me/ExtrovertVIX

Téléphone : +263739731749 pour les appels, SMS, WhatsApp, Telegram


Avis 5
foxone2
19
foxone2 2021.03.17 11:45 
 

Fantastic indicator! Loving it.

Produits recommandés
Owl Smart Levels MT5
Sergey Ermolov
4.07 (28)
Version MT4   |  FAQ L' indicateur Owl Smart Levels est un système de trading complet au sein d'un seul indicateur qui comprend des outils d'analyse de marché populaires tels que les fractales avancées de Bill Williams , Valable ZigZag qui construit la structure d'onde correcte du marché et les niveaux de Fibonacci qui marquent les niveaux exacts d'entrée. sur le marché et les endroits où prendre des bénéfices. Description détaillée de la stratégie Mode d'emploi de l'indicateur Conseiller-Assis
Renko Gold
Ignacio Agustin Mene Franco
Renko Gold! clearly indicates the floors and ceilings where it goes from 4 lines, the line below that marks the floor in green confirming with the thinnest line clarifies the purchase entry, the same is for sale, the top line marks the ceiling and the thinnest red line marks the sale, This indicator works for all temporalities! For Forex and Synthetic Indices markets! It also works for crypto markets! Good profit! World Investor.
Terra Infinity is a flat indicator. This improved version of the CalcFlat indicator has three additional lines that significantly increase its effectiveness. Unlike its predecessor with two static levels, Terra Infinity adds three dynamic lines above the main histogram, which are interpreted as follows: base signal line, minimum signal line, maximum signal line. These lines are formed using the additional parameter Avg, which is the average value of the histogram. Averaging produces a line
SolarTrade Suite Financial Indicator: Jupiter Market Indicator - Votre guide fiable dans le monde des marchés financiers ! Il s'agit d'un indicateur de tendance qui utilise des algorithmes spéciaux innovants et avancés pour calculer sa valeur, et qui présente également un design agréable à l'œil. Il est très facile de comprendre les lectures de cet indicateur : couleur bleue - achat, rouge - vente. Découvrez nos autres produits de la série SolarTrade Suite au bas de la description. Vous
The Penta-O is a 6-point retracement harmonacci pattern which usually precedes big market movements. Penta-O patterns can expand and repaint quite a bit. To make things easier this indicator implements a twist: it waits for a donchian breakout in the right direction before signaling the trade. The end result is an otherwise repainting indicator with a very reliable trading signal. The donchian breakout period is entered as an input. [ Installation Guide | Update Guide | Troubleshooting | FAQ | A
Noize Absorption Index - is the manual trading system that measures the difference of pressure between bears forces and bulls forces. Green line - is a noize free index that showing curent situation. Zero value of index shows totally choppy/flat market.Values above zero level shows how powerfull bullish wave is and values below zero measures bearish forces.Up arrow appears on bearish market when it's ready to reverse, dn arrow appears on weak bullish market, as a result of reverse expectation.
Le niveau Premium est un indicateur unique avec une précision de plus de 80 % des prédictions correctes ! Cet indicateur a été testé par les meilleurs Trading Specialists depuis plus de deux mois ! L'indicateur de l'auteur que vous ne trouverez nulle part ailleurs ! À partir des captures d'écran, vous pouvez constater par vous-même la précision de cet outil ! 1 est idéal pour le trading d'options binaires avec un délai d'expiration de 1 bougie. 2 fonctionne sur toutes les paires de de
Double HMA MTF for MT5
Pavel Zamoshnikov
3.67 (3)
This is an advanced multi-timeframe version of the popular Hull Moving Average (HMA) Features Two lines of the Hull indicator of different timeframes on the same chart. The HMA line of the higher timeframe defines the trend, and the HMA line of the current timeframe defines the short-term price movements. A graphical panel with HMA indicator data from all timeframes at the same time . If the HMA switched its direction on any timeframe, the panel displays a question or exclamation mark with a tex
PipFinite Trend PRO MT5
Karlo Wilson Vendiola
4.85 (574)
Breakthrough Solution For Trend Trading And Filtering With All Important Features Built Inside One Tool! Trend PRO's smart algorithm detects the trend, filters out market noise and gives entry signals with exit levels. The new features with enhanced rules for statistical calculation improved the overall performance of this indicator. Important Information Revealed Maximize the potential of Trend Pro, please visit www.mql5.com/en/blogs/post/713938 The Powerful Expert Advisor Version Automa
L'indicateur montre des modèles harmoniques sur le graphique   sans repeindre   avec le minimum de décalage possible. La recherche de sommets d'indicateurs est basée sur le principe des vagues de l'analyse des prix. Les paramètres avancés vous permettent de choisir les paramètres de votre style de trading. À l'ouverture d'une bougie (barre), lorsqu'un nouveau motif se forme, une flèche de la direction probable du mouvement des prix est fixée, qui reste inchangée. L'indicateur reconnaît les modèl
Atomic Analyst MT5
Issam Kassas
4.42 (19)
Tout d'abord, il convient de souligner que cet indicateur de trading n'est ni repainting, ni redrawing et ne présente aucun délai, ce qui le rend idéal à la fois pour le trading manuel et automatisé. Manuel de l'utilisateur : réglages, entrées et stratégie. L'Analyste Atomique est un indicateur d'action sur les prix PA qui utilise la force et le momentum du prix pour trouver un meilleur avantage sur le marché. Équipé de filtres avancés qui aident à éliminer les bruits et les faux signaux, et à
Indicator and Expert Adviser  EA Available in the comments section of this product. Download with Indicator must have indicator installed for EA to work. Mt5 indicator alerts for bollinger band and envelope extremes occurring at the same time. Buy signal alerts occur when A bullish candle has formed below both the lower bollinger band and the lower envelope  Bar must open and close below both these indicators. Sell signal occur when A bear bar is formed above the upper bollinger band and upp
Renko System
Marco Montemari
This indicator can be considered as a trading system. It offers a different view to see the currency pair: full timeless indicator, can be used for manual trading or for automatized trading with some expert advisor. When the price reaches a threshold a new block is created according to the set mode. The indicator beside the Renko bars, shows also 3 moving averages. Features renko mode median renko custom median renko 3 moving averages wicks datetime indicator for each block custom notificatio
To get access to MT4 version please click here . - This is the exact conversion from TradingView: "Stochastic Momentum Index" By "UCSgears". - This is a popular version of stochastic oscillator on tradingview. - This is a light-load processing and non-repaint indicator. - Buffers are available for the lines on chart. - You can message in private chat for further changes you need. Thanks for downloading
Cumulative delta indicator As most traders believe, the price moves under the pressure of market buying or selling. When someone redeems an offer standing in the cup, the deal is a "buy". If someone pours into the bid standing in the cup - the deal goes with the direction of "sale". The delta is the difference between purchases and sales. A cumulative delta - the difference between the cumulative sum of purchases and sales for a certain period of time. It allows you to see who is currently contr
Was: $249  Now: $99   Market Profile defines a number of day types that can help the trader to determine market behaviour. A key feature is the Value Area, representing the range of price action where 70% of trading took place. Understanding the Value Area can give traders valuable insight into market direction and establish the higher odds trade. It is an excellent addition to any system you may be using. Inspired by Jim Dalton’s book “Mind Over Markets”, this indicator is designed to suit the
TrendDetect
Pavel Gotkevitch
The Trend Detect indicator combines the features of both trend indicators and oscillators. This indicator is a convenient tool for detecting short-term market cycles and identifying overbought and oversold levels. A long position can be opened when the indicator starts leaving the oversold area and breaks the zero level from below. A short position can be opened when the indicator starts leaving the overbought area and breaks the zero level from above. An opposite signal of the indicator can
Trade history
Andriy Konovalov
5 (2)
The indicator plots charts of profit taken at the Close of candles for closed (or partially closed) long and short positions individually. The indicator allows to filter deals by the current symbol, specified expert ID (magic number) and the presence (absence) of a substring in a deal comment, to set the start time and the periodicity of profit reset (daily, weekly or monthly) to calculate the profit chart. The indicator also displays the floating (not fixed) profit of the opened positions at th
Trend Monitor MT5
Pavel Zamoshnikov
4.5 (2)
The indicator generates early signals basing on ADX reading data combined with elements of price patterns. Works on all symbols and timeframes. The indicator does not redraw its signals. You see the same things on history and in real time. For better visual perception signals are displayed as arrows (in order not to overload the chart). Features The best results are obtained when the indicator works on two timeframes. For example: M30 – the indicator shows the main trend; M5 – the indicator ge
This indicator is used to compare the relative strength of the trade on the chart against the other several selected symbols. By comparing the price movement of each traded variety based on the same base day, several trend lines of different directions can be seen, reflecting the strong and weak relationship between the several different traded varieties, so that we can have a clearer understanding of the market trend. For example, you can apply this indicator on a EurUSD chart and compare it
Ultimate Divergence Scanner (Multi Pair And Multi Time Frame) :   ---LIMITED TIME OFFER: NEXT 25 CLIENTS ONLY ---46% OFF REGULAR PRICE AND 2 FREE BONUSES ---SEE BELOW FOR FULL DETAILS It is a widely known market principle that momentum generally precedes price.  Making divergence patterns a clear indication that price and momentum are not in agreement.  Divergence patterns are widely used by institutional traders around the world. As they allow you to manage  your trades within strictly de
An indicator of pattern #31 ("Long Island") from Encyclopedia of Chart Patterns by Thomas N. Bulkowski. The second gap is in the opposite direction. Parameters: Alerts - show alert when an arrow appears   Push - send a push notification when an arrow appears (requires configuration in the terminal) GapSize - minimum gap size in points ArrowType - a symbol from 1 to 17 ArrowVShift - vertical shift of arrows in points   ShowLevels - show levels ColUp - color of an upward line ColDn - color of a
SolarTrade Suite Financial Indicator: Venus Market Indicator - Votre guide fiable dans le monde des marchés financiers ! Il s'agit d'un oscillateur qui utilise des algorithmes spéciaux innovants et avancés pour calculer sa valeur, et qui présente également un design agréable à l'œil. Il est très facile de comprendre les lectures de cet indicateur : couleur bleue - achat, rouge - vente. Plus la couleur est vive, plus le signal est fort. Découvrez nos autres produits de la série SolarTrad
"Support and Resistance" is a fundamental concept in technical analysis for trading stocks, currencies, or other assets in financial markets. Here's how to use it: Identifying Support Support is a price level where buying is strong. When the price drops to this level, there tends to be significant buying activity, preventing the price from falling further. Identifing Support: Look for the lowest points in a given period and find levels where the price has bounced back up multiple times. Usage:
Mine Farm
Maryna Kauzova
Mine Farm is one of the most classic and time-tested scalping strategies based on the breakdown of strong price levels. Mine Farm is the author's modification of the system for determining entry and exit points into the market... Mine Farm - is the combination of great potential with reliability and safety. Why Mine Farm?! - each order has a short dynamic Stop Loss - the advisor does not use any risky methods (averaging, martingale, grid, locking, etc.) - the advisor tries to get
HMA Trend Professional MT5
Pavel Zamoshnikov
4.25 (4)
Improved version of the free HMA Trend indicator (for MetaTrader 4) with statistical analysis. HMA Trend is a trend indicator based on the Hull Moving Average (HMA) with two periods. HMA with a slow period identifies the trend, while HMA with a fast period determines the short-term movements and signals in the trend direction. The main differences from the free version: Ability to predict the probability of a trend reversal using analysis of history data. Plotting statistical charts for analyz
Fit line supports to extrapolation next movement of market, support for buy/sell decision. Indicator using spline algorithm to extrapolation.  You can change number of spline with parameter "PointsNumber" and number of extrapolation point with "ExtrapolateBars". Eextrapolation points will be save into csv format, with prefix in parameter "PointsPrefix", and store in folder File of Data Folder.
PZ Chart Overlay MT5
PZ TRADING SLU
4.5 (2)
Master the market: harness the power of statistical arbitrage This indicator showcases the price action of multiple instruments on a single chart, enabling you to compare the fluctuations of different assets and seamlessly implement statistical arbitrage strategies. Its main usage is to find correlated symbols which are temporarily out of whack. [ Installation Guide | Update Guide | Troubleshooting | FAQ | All Products ] Find overbought or oversold currency pairs easily Plot up to six curre
FanTracer
Syed Oarasul Islam
This Indicator draws Fibonacci Fan levels in two different ways. You can select whether to draw Fibonacci Fan levels based on your favourite ZigZag settings or you can let the indicator to draw Fan levels based on given number of bars or candles.  You can also set Mobile and Email notification for your favourite Fan  levels individually. With this indicator you will not have to feel lonely as the it can generate Voice alerts, which will keep you focused on your trading and remove boredom.  Prod
This indicator is used to find support and resistance lines The support and pressure of different time periods can be found in the same icon cycle, and two time periods are provided here Parameter Description: ---------------------- Main --------------------- Timeframe                        //Used to select the main time period (recommended as the default PERIOD_D1); Retracement interval        //This value is the root number of backtracking k-lines (recommended to be 20 by default);
Les acheteurs de ce produit ont également acheté
TPSpro RFI Levels MT5
Roman Podpora
4.73 (11)
INSTRUCTIONS       RUS   -   ANGLAIS       Il   est recommandé de l'utiliser avec un indicateur       -       TPSpro   TENDANCE PRO -   Version MT4         Un élément clé du trading est constitué par les zones ou les niveaux à partir desquels les décisions d'achat ou de vente d'un instrument de trading sont prises. Malgré les tentatives des principaux acteurs de dissimuler leur présence sur le marché, ils laissent inévitablement des traces. Notre tâche était d'apprendre à identifier ces traces
Tout d'abord, il convient de souligner que ce système de trading est un indicateur non repeint, non redessiné et non retardé, ce qui le rend idéal pour le trading manuel et automatisé. Cours en ligne, manuel et téléchargement de préréglages. Le "Système de Trading Smart Trend MT5" est une solution de trading complète conçue pour les traders débutants et expérimentés. Il combine plus de 10 indicateurs premium et propose plus de 7 stratégies de trading robustes, ce qui en fait un choix polyvalent
TrendMaestro5
Stefano Frisetti
note: this indicator is for METATRADER4, if you want the version for METATRADER5 this is the link:  https://www.mql5.com/it/market/product/108106 TRENDMAESTRO ver 2.4 TRENDMAESTRO recognizes a new TREND in the bud, he never makes mistakes. The certainty of identifying a new TREND is priceless. DESCRIPTION TRENDMAESTRO identifies a new TREND in the bud, this indicator examines the volatility, volumes and momentum to identify the moment in which there is an explosion of one or more of these data a
FxaccurateLS
Shiv Raj Kumawat
WHY IS OUR FXACCCURATE LS MT5 THE PROFITABLE ? PROTECT YOUR CAPITAL WITH RISK MANAGEMENT Gives entry, stop and target levels from time to time. It finds Trading opportunities by analyzing what the price is doing during established trends. POWERFUL INDICATOR FOR A RELIABLE STRATEGIES We have made these indicators with a lot of years of hard work. It is made at a very advanced level. Established trends provide dozens of trading opportunities, but most trend indicators completely ignore them!
AT Forex Indicator MT5
Marzena Maria Szmit
5 (4)
The AT Forex Indicator MT5 is a sophisticated trading tool designed to provide traders with a comprehensive analysis of multiple currency pairs. This powerful indicator simplifies the complex nature of the forex market, making it accessible for both novice and experienced traders. AT Forex Indicator uses advanced algorithms to detect trends, patterns and is an essential tool for traders aiming to enhance their forex trading performance. With its robust features, ease of use, and reliable signal
TPA True Price Action indicator reveals the true price action of the market makers through 100% non-repainting signals strictly at the close of a candle! TPA shows entries and re-entries, every time the bulls are definitely stronger than the bears and vice versa. Not to confuse with red/green candles. The shift of power gets confirmed at the earliest stage and is ONE exit strategy of several. There are available now two free parts of the TPA User Guide for our customers. The first "The Basics"
XQ Indicator MetaTrader 5
Marzena Maria Szmit
3 (2)
Step into the realm of Forex trading with confidence and precision using XQ, a cutting-edge Forex indicator designed to elevate your trading game to unprecedented heights. Whether you're a seasoned trader or just stepping into the world of currency exchange, XQ Forex Indicator empowers you with the insights and signals needed to make informed trading decisions. The signal conditions are a combination of three indicators, and XQ Forex Indicator only display  medium and long-term trends . The ind
Trade smarter, not harder: Empower your trading with Harmonacci Patterns Special Offer: Purchase now to receive free bonuses worth $165! (Read more for details) This is arguably the most complete harmonic price formation auto-recognition indicator you can find for the MetaTrader Platform. It detects 19 different patterns, takes fibonacci projections as seriously as you do, displays the Potential Reversal Zone (PRZ) and finds suitable stop-loss and take-profit levels. [ Installation Guide | Up
Order Block Hunter MT5
Noha Mohamed Fathy Younes Badr
5 (1)
Order block hunter indicator is the best indicator for  hunt the order blocks that area where there has been a large concentration of limit orders waiting to be executed Order blocks are identified on a chart by observing previous price action and looking for areas where the price experienced significant movement or sudden changes in direction .This indicator does that for you by using very complicated codes and helps you to take the best areas To buy and sell because it make marks at the best a
MetaForecast M5
Vahidreza Heidar Gholami
5 (2)
MetaForecast prédit et visualise l'avenir de n'importe quel marché en se basant sur les harmoniques des données de prix. Bien que le marché ne soit pas toujours prévisible, s'il y a un motif dans les prix, MetaForecast peut prédire l'avenir aussi précisément que possible. Comparé à d'autres produits similaires, MetaForecast peut générer des résultats plus précis en analysant les tendances du marché. Paramètres d'entrée Past size (Taille passée) Spécifie le nombre de barres que MetaForecast uti
Boom and Crash Trend Detector is a  Non-Repaint   MT5 trading system usually being sold for 50 0$ . Most people use this for Deriv but can be used to forex too. The boom and crash spike indicator is a spike detecting software, with Multiple features, these features include. Spike Alert ( from 10 to 100-second warning before spike) Continues spike Alert (for double or continuous spikes at a time) supports all Boom/crash Indices M6 time frame works best here . Bigger time frame trend pointer f
Maintenant 147 $ (augmentant à 499 $ après quelques mises à jour) - Comptes illimités (PCS ou Mac) Manuel d'utilisation RelicusRoad + Vidéos de formation + Accès au groupe Discord privé + Statut VIP UNE NOUVELLE FAÇON DE REGARDER LE MARCHÉ RelicusRoad est l'indicateur de trading le plus puissant au monde pour le forex, les contrats à terme, les crypto-monnaies, les actions et les indices, offrant aux traders toutes les informations et tous les outils dont ils ont besoin pour rester renta
Go Way TREND
Ywsf Hsyn Hmad Alrsh
Suivez la tendance. Oui, attendez le signal d'entrée, qu'il soit d'achat ou de vente, sur une image de 15 minutes, et vérifiez le signal s'il apparaît sur une image de 30 minutes (il faut parfois une heure ou plus pour que le signal apparaisse. Vous pouvez revenir au cadre de 15 minutes et revenez au cadre de 30 minutes, et répétez cette opération jusqu'à ce que le signal principal apparaisse pour vous. Si le signal apparaît sur le cadre de 30 minutes, entrez avec le prix et le profit est pris
How to use Pair Trading Station Pair Trading Station is recommended for H1 time frame and you can use it for any currency pairs. To generate buy and sell signal, follow few steps below to apply Pair Trading Station to your MetaTrader terminal. When you load Pair Trading Station on your chart, Pair Trading station will assess available historical data in your MetaTrader platforms for each currency pair. On your chart, the amount of historical data available will be displayed for each currency pai
IVISTscalp5
Vadym Zhukovskyi
5 (5)
Nous vous présentons l'indicateur iVISTscalp5, qui est non seulement unique, mais également efficace dans les opérations de trading. Cet indicateur est basé sur des données temporelles et est le résultat de nombreuses années d'expérience et d'analyse approfondie des marchés financiers. L'indicateur iVISTscalp5 est un excellent outil pour le trading manuel. La commodité, la simplicité et la visualisation - toute la complexité est cachée à l'intérieur. Nous avons simplifié au maximum les paramètre
Bill Williams Advanced
Siarhei Vashchylka
5 (8)
Bill Williams Advanced is designed for automatic chart analysis using Bill Williams' "Profitunity" system. The indicator analyzes four timeframes at once. Manual (Be sure to read before purchasing) Advantages 1. Automatically analyzes the chart using the "Profitunity" system of Bill Williams. The found signals are placed in a table in the corner of the screen. 2. Equipped with a trend filter based on the Alligator indicator. Most of the system signals are recommended to be used only accordi
Native Channels
BeeXXI Corporation
5 (1)
This indicator recognizes all support and resistance levels. A number of unique high-performance techniques have been applied, which made the existence of this indicator possible. All formed channels are naturally visible: horizontal linear linear parabolic cubic (Polynomial 3 degrees - Wave) This is due to a bundle of approximating channels. The formed channels form "standing waves" in a hierarchical sequence. Thus, all support and resistance levels are visible. All parameter management is
Tout d'abord, il convient de souligner que ce système de trading est un indicateur non repainting, non redrawing et non lagging, ce qui le rend idéal pour le trading professionnel. Cours en ligne, manuel utilisateur et démonstration. Le "Système de Trading de Support et Résistance Intelligent" est un indicateur avancé conçu pour les traders novices et expérimentés. Il permet aux traders de bénéficier de précision et de confiance sur le marché du forex. Ce système complet combine plus de 7 strat
Introduction to Fractal Pattern Scanner Fractal Indicator refers to the technical indicator that makes use of the fractal geometry found in the financial market. Fractal Pattern Scanner is the advanced Fractal Indicator that brings the latest trading technology after the extensive research and development work in the fractal geometry in the financial market. The most important feature in Fractal Pattern Scanner is the ability to measure the turning point probability as well as the trend probabil
Volatility Trend System - est un système commercial qui fournit des signaux pour les entrées. Le système de volatilité donne des signaux linéaires et ponctuels dans le sens de la tendance, ainsi que des signaux pour en sortir, sans redessin ni délai. L'indicateur de tendance surveille la direction de la tendance à moyen terme, montre la direction et son changement. L'indicateur de signal est basé sur les changements de volatilité et montre les entrées sur le marché. L'indicateur est équipé
Introduction to X3 Chart Pattern Scanner X3 Cherart Pattern Scanner is the non-repainting and non-lagging indicator detecting X3 chart patterns including Harmonic pattern, Elliott Wave pattern, X3 patterns, and Japanese Candlestick patterns. Historical patterns match with signal patterns. Hence, you can readily develop the solid trading strategy in your chart. More importantly, this superb pattern scanner can detect the optimal pattern of its kind. In addition, you can switch on and off individu
Piranha version 2
Maria Strudov
5 (1)
"Piranha" - an autonomous trading system that determines overbought and oversold levels on the chart. Red and blue zones represent overbought and oversold levels respectively. Entry points are marked with arrows: a downward arrow in the red zone for "sell" and an upward arrow in the blue zone for "buy". The Take profit level is indicated by the green moving average. Key features: Adjusting the Take profit level as the green moving average changes position. Averaging ability when a new market e
SMCpro
Arief
5 (1)
Currently Price  20% OFF  ( for unlimited use ) Indicator   USER MANUAL , trade setups, solving issues, etc :  Direct Download Here     (  for users only  ) Hello World! Introducing.. SMCpro tool and Indicator for  MetaTrader 5 , a cutting-edge feature designed to revolutionize your trading experience. With innovative ICT Smart Money Concept, you gain unparalleled insight into market dynamics, empowering you to make informed trading decisions like never before. SMC Indicator built on th
The iChannels
BeeXXI Corporation
5 (2)
Ultra-fast recognition of parabolic channels (as well as linear, horizontal and wavy channels) throughout the depth of history, creating a hierarchy of channels. Required setting: Max bars in chart: Unlimited This indicator is designed primarily for algorithmic trading, but can also be used for manual trading.  This indicator will have a very active evolution in the near future and detailed descriptions on how to apply to create robots
Introducing the Power Trade Plus indicator designed by a small group of traders with a few years of experience trading the market profitably.  The Power Trade Plus is derived from the Power Trade indicator,  the indicator strive in powerful sniper entries and take profit levels,  with an algorithm that's can determine the markets volatility and Provides entries based on the current market volatility. This indicator is much more effective in stock ,currencies and indices.
Introducing the South African Sniper indicator created by a small group of traders with a few years trading trading the financial market profitably . This is a plug and play indicator that provides you with  BUY and SELL (SNIPER ENTRY) signals with TARGET and trail stops. The indicator Works with all MT5 trading instruments. The indicator uses previous  chart data as receipt to speculate on future market moves.  "The South African Sniper indicator community are very happy with the indicator an
Golden Gate Algo MT5
James David Lane
4 (6)
40% DE RÉDUCTION POUR NOËL ! AUGMENTATION DES PRIX À 250 $ LE 1er JANVIER ! Présentation de GoldenGate Entries : une solution de trading de pointe ! Découvrez une approche révolutionnaire du trading avec GoldenGate Entries (GGE), un indicateur avancé conçu pour améliorer votre expérience de trading. GGE offre un ensemble complet de fonctionnalités pour donner aux utilisateurs la précision et la confiance nécessaires dans leurs décisions de trading. Paires : Toutes (FX - Matières premières
Elliott Wave Trend was designed for the scientific wave counting. This tool focuses to get rid of the vagueness of the classic Elliott Wave Counting using the guideline from the template and pattern approach. In doing so, firstly Elliott Wave Trend offers the template for your wave counting. Secondly, it offers Wave Structural Score to assist to identify accurate wave formation. It offers both impulse wave Structural Score and corrective wave Structure Score. Structural Score is the rating to sh
L'oscillateur de l'indice de précision (Pi-Osc) de Roger Medcalf de Precision Trading Systems La version 2 a été soigneusement recodée pour être ultra-rapide à charger sur votre graphique, et quelques autres améliorations techniques ont été incorporées pour améliorer l'expérience. Le Pi-Osc a été créé pour fournir des signaux de synchronisation de trading précis conçus pour trouver des points d'épuisement extrêmes, les points auxquels les marchés sont contraints d'aller simplement pour élim
Matreshka
Dimitr Trifonov
5 (1)
Matreshka self-testing and self-optimizing indicator: 1. Is an interpretation of the Elliott Wave Analysis Theory. 2. Based on the principle of the indicator type ZigZag, and the waves are based on the principle of interpretation of the theory of DeMark. 3. Filters waves in length and height. 4. Draws up to six levels of ZigZag at the same time, tracking waves of different orders. 5. Marks Pulsed and Recoil Waves. 6. Draws arrows to open positions 7. Draws three channels. 8. Notes support and re
Plus de l'auteur
Automatic Fibonacci Tool Fibonacci retracements is a popular instrument used by technical analysts to determine potential Support and Resistance areas. In technical analysis, this tool is created by taking two extreme points (usually a peak and a minimum) on the chart and dividing the vertical distance by the key Fibonacci coefficients equal to 23.6%, 38.2%, 50%, 61.8%, and 100%. Our Automatic Fibonacci Tool is programmed to make thigs easier. Using this tool, there is no need to explicitly set
Advanced Support and Resistance Support and resistance levels are widely used in trading. They are important as they show some key price levels. Before applying any strategy, one may consider it necessary to draw support and resistance. However, this process can take much time especially if one is to analyse a lot of currency pairs, commodities or indices. This Advanced Support and Resistance tool was designed for traders at any level, amateur to professional. It plots key support and resistance
Filtrer:
wahyoepct
24
wahyoepct 2024.09.07 03:05 
 

.

bignon1990
24
bignon1990 2024.06.10 00:35 
 

Very disappoint about this indicator, I bought it since 24h, I receive only one signal on all the boom and crash. I was expecting better according to the description

Batsirayi L Marango
771
Réponse du développeur Batsirayi L Marango 2024.06.10 09:45
Greetings It seems you did not set the indicator properly. Even if the market is bad, we always receive more signals in a day. Check that you set on M5 timeframe. Then computer must be on and connected to the Internet for you to receive alerts. You can also use a VPS for alerts to come 24/7. If you want VPS we can offer you ours, free with the purchase. Kindly contact developer on Telegram https://t.me/PipsGenius or WhatsApp wa.me/263739731749 for further assistance. Ready to help you have it working.
Robert Rondon
28
Robert Rondon 2022.03.03 15:09 
 

My alerts stopped coming, I need technical support please.

Batsirayi L Marango
771
Réponse du développeur Batsirayi L Marango 2022.03.03 19:33
I can help you install and use. Send message on Telegram t.me/PipsGenius or on WhatsApp wa.me/263739731749.
Kagiso Sydney Simon
138
Kagiso Sydney Simon 2021.04.02 18:51 
 

L'utilisateur n'a laissé aucun commentaire sur la note

foxone2
19
foxone2 2021.03.17 11:45 
 

Fantastic indicator! Loving it.

Répondre à l'avis
Version 1.4 2024.03.27
1. Algorithme amélioré pour augmenter la précision.
Nous avons amélioré notre stratégie pour répondre aux dernières tendances du courtier. Notre objectif est de gagner plus que de perdre et nous nous améliorons continuellement.

2. Interface utilisateur améliorée
Nous avons ajouté une meilleure conception des couleurs des graphiques qui facilite l'analyse des graphiques, est attrayante pour les yeux et réduit la fatigue oculaire. Il n’est pas nécessaire de charger un modèle, sauf si vous le souhaitez bien sûr.

3. Ajout de la prise en charge de plusieurs langues
Nous avons ajouté davantage de langues pour permettre à chacun de recevoir des alertes dans la langue qu'il comprend facilement. Nous ajouterons d’autres langues au fur et à mesure. Anglais, portugais, français, espagnol et malais désormais pris en charge

4. Meilleur support de gestion financière pour inclure des estimations Stop Loss
Suite aux retours de nos utilisateurs, nous avons ajouté des estimations Stop Loss pour nous permettre de minimiser les pertes. Nous ne sommes bien sûr pas à 100%, donc en cas de baisse, nous pouvons simplement nous limiter au Stop Loss. De meilleurs signaux viendront toujours et nous gagnerons plus
5. Paramètres d'entrée entièrement personnalisables
Adaptez l'indicateur à vos préférences dans les paramètres de saisie. Vous pouvez également enregistrer vos préréglages et votre modèle
6. Canal de télégramme dédié
Rejoignez notre communauté Telegram en pleine croissance sur https://t.me/GoldenSpikes pour plus de conseils, de signaux et d'assistance
Version 1.3 2021.08.06
- Some bug fixes
- Added Dashboard to the charts
Version 1.2 2021.01.27
- Added option to select BUYS Only, Sells Only or Both BUYS ad SELLS. If trading Boom spikes, choose BUYs Only. If trading Crash Indices Spikes, choose SELLS Only
- Target Profit Lies ca ow e draw o the Chart to make it easier to set them
- Alert if also written right o the chart so one can see it when the signal is still valid