Volatility Line Signals
- Indicateurs
- Vitalyi Belyh
- Version: 1.50
- Mise à jour: 15 septembre 2024
- Activations: 7
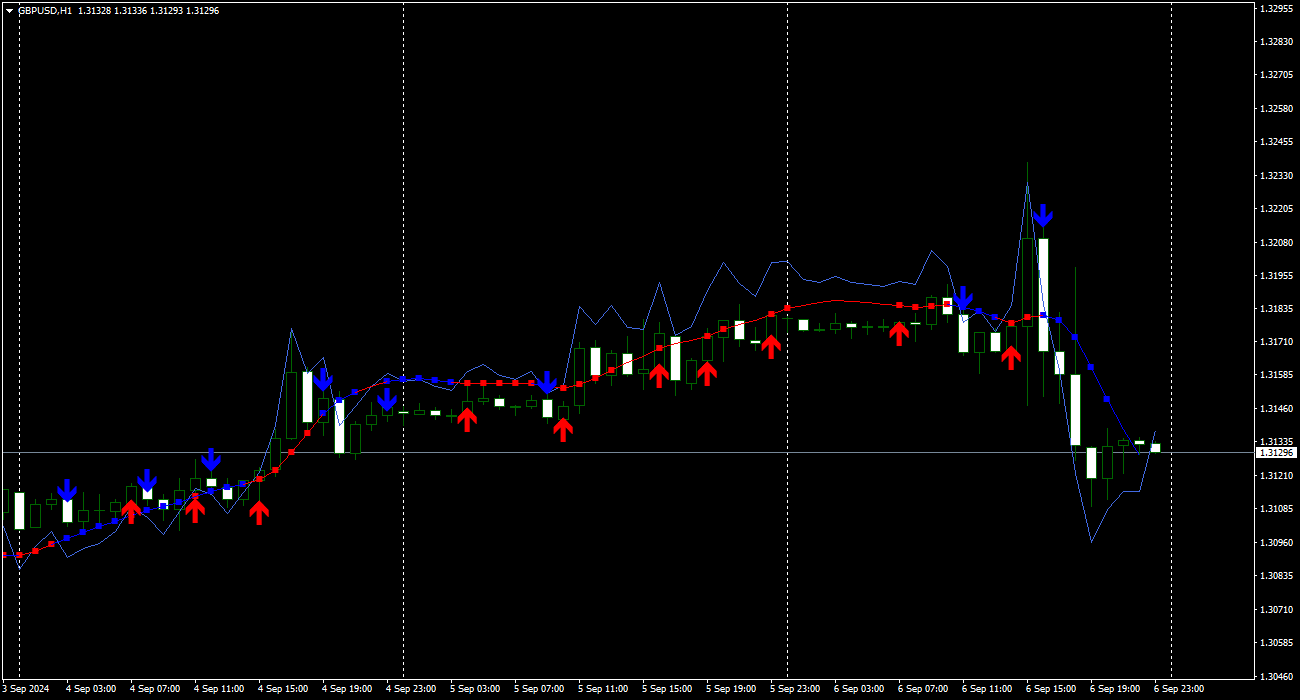
L'indicateur développé pour le trading utilise la volatilité du marché, vous permettant de prédire les mouvements de prix dès le début.
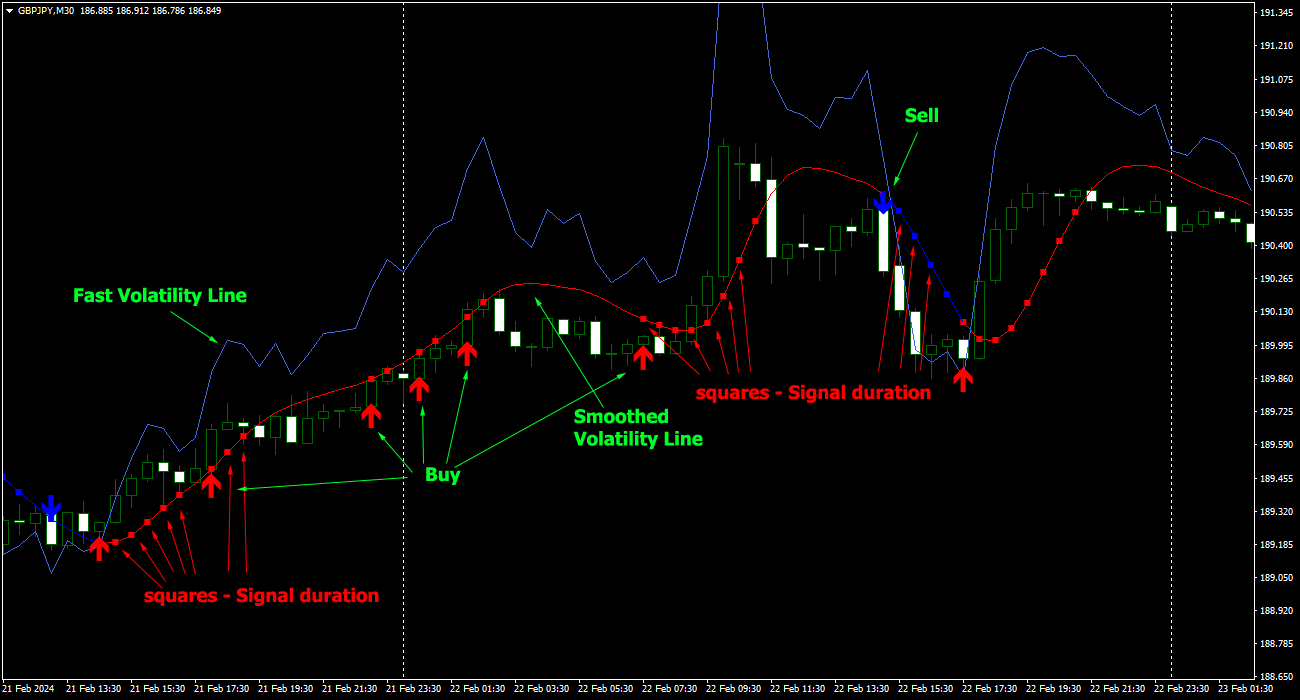
En lisant la volatilité et la dynamique des prix, il construit deux lignes, rapides et fluides. Lorsque la ligne rapide croise la ligne lisse, le mouvement de tendance change.
Les signaux n'apparaissent pas au moment du croisement des lignes, mais avec un indicateur supplémentaire généré par un générateur de signaux basé sur le mouvement de la ligne rapide.
Si la ligne rapide est au dessus de la ligne lissée, la tendance est haussière, si la ligne rapide est en dessous de la ligne lissée, la tendance est baissière.
La flèche de signal apparaît au moment de la fermeture de la bougie et ne disparaîtra jamais ni ne se terminera sur la bougie précédente.
Après la formation des flèches de signal, l'indicateur surveille la durée de ce signal, dessinant des carrés sur la ligne lissée à mesure que le prix évolue. Lorsque les carrés cessent d'apparaître, la fin du signal se produit.
Description
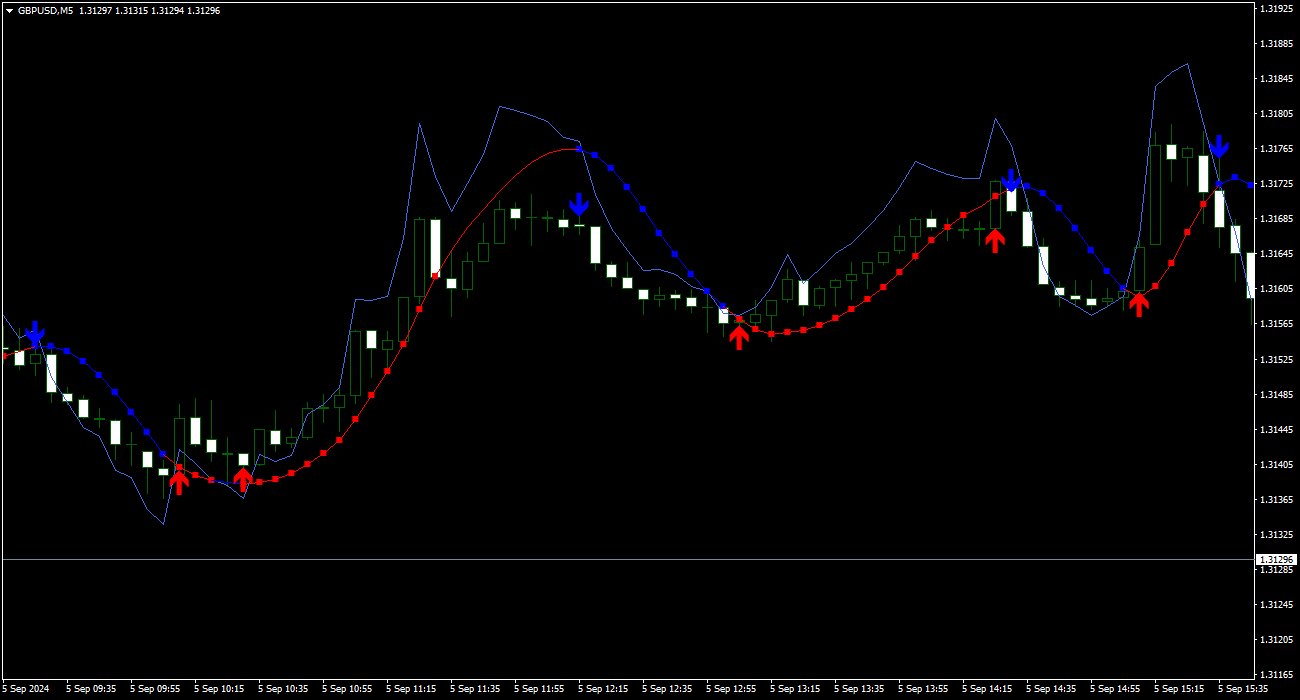
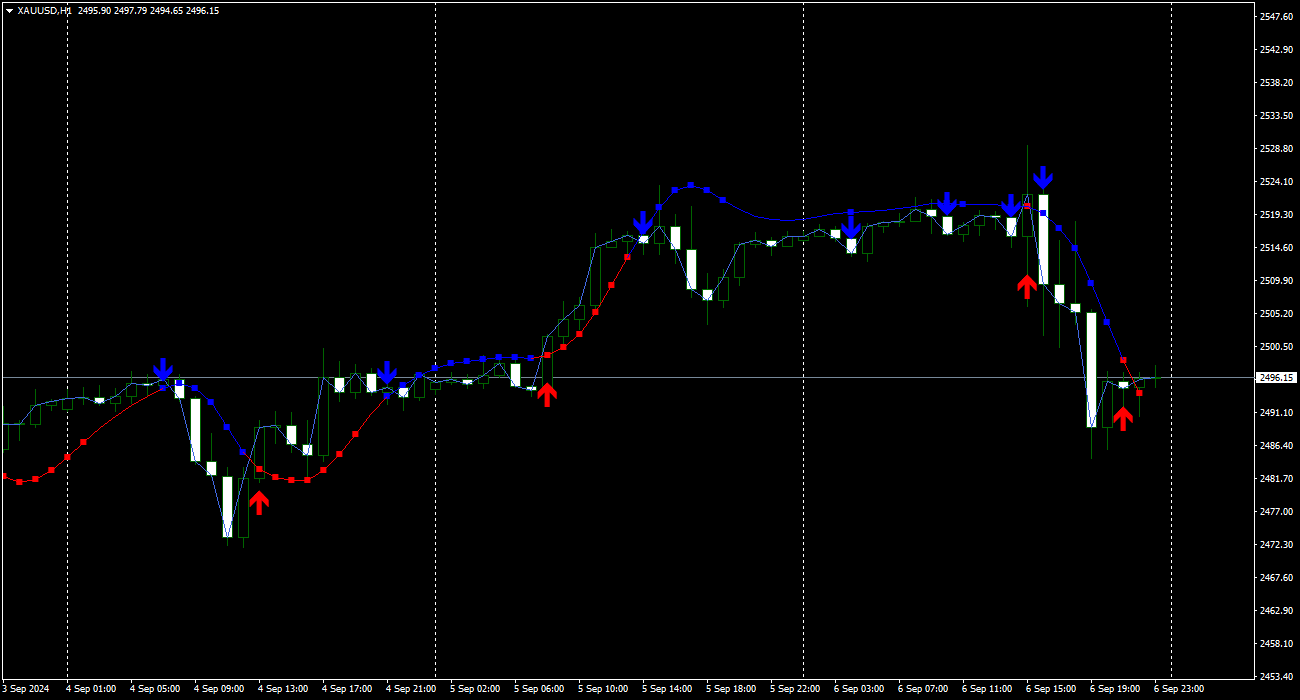
- L'indicateur comprend une ligne de guidage bleue, bleue ou rouge selon la direction de la ligne.
- Pour que l'indicateur fonctionne correctement, vous devez configurer correctement le premier paramètre « Adjustment for volatility », la valeur par défaut est 1, il convient aux principales devises : EURUSD, GBPUSD et quelques autres. Pour l'EURJPY, vous devez définir 4, pour GOLD 5, vous pouvez utiliser une volatilité réduite. pour les autres instruments de trading, vous devez sélectionner indépendamment le niveau de volatilité afin que l'indicateur ressemble à l'EURUSD.
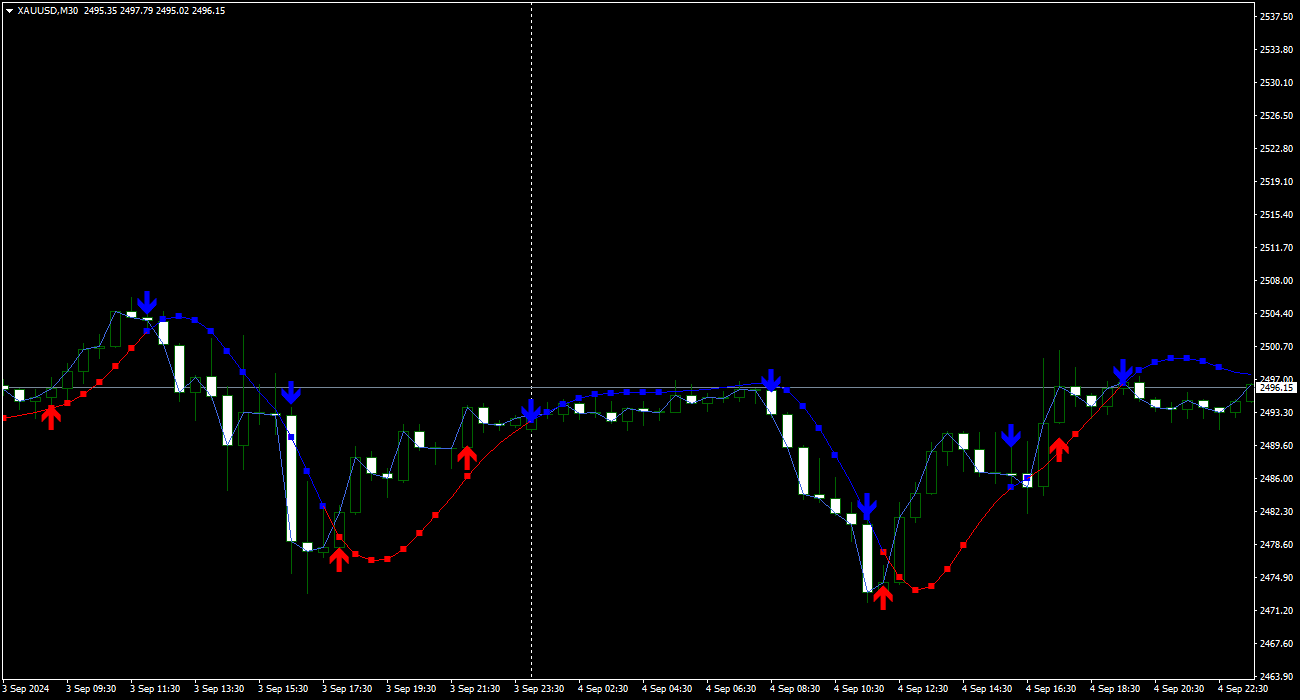
- Le paramètre « Smoothed line period » modifie la douceur et la durée des lignes rouges et bleues. Changez lorsque vous passez d’une période à l’autre, utilisez un nombre plus grand pour les plus jeunes et un nombre plus petit pour les plus âgés.
- Le paramètre « Signal sensitivity » régule la formation de la flèche du signal et la durée du signal qui la suit ; pour le scalping, sélectionnez un nombre plus petit et pour le trading intrajournalier, un nombre plus grand.
- Les paramètres d'entrée vous permettent de configurer l'indicateur pour n'importe quel instrument de trading et période.
- Les flèches de signalisation fonctionnent sans repeindre et disposent de plusieurs types d'alertes.