• Aperçu
  • Avis
  • Commentaires

Reversal Up Down Arrows MT5

Un ensemble d’indicateurs qui reconnaissent les points tournants. Détecte les hauts et les bas des combinaisons de chandeliers après les avoir soustraits de deux MA. Applicable aux systèmes de trading lors de l'utilisation d'entrées anticipées. Peut être utilisé le long de la tendance pour le scalping et le trading intrajournalier, et pour détecter les inversions de tendance dès les premiers stades.


Possibilités
  1. Les paramètres fournissent des paramètres flexibles pour tous les délais et instruments de trading.
  2. Il existe plusieurs types d'alertes pour les signaux.
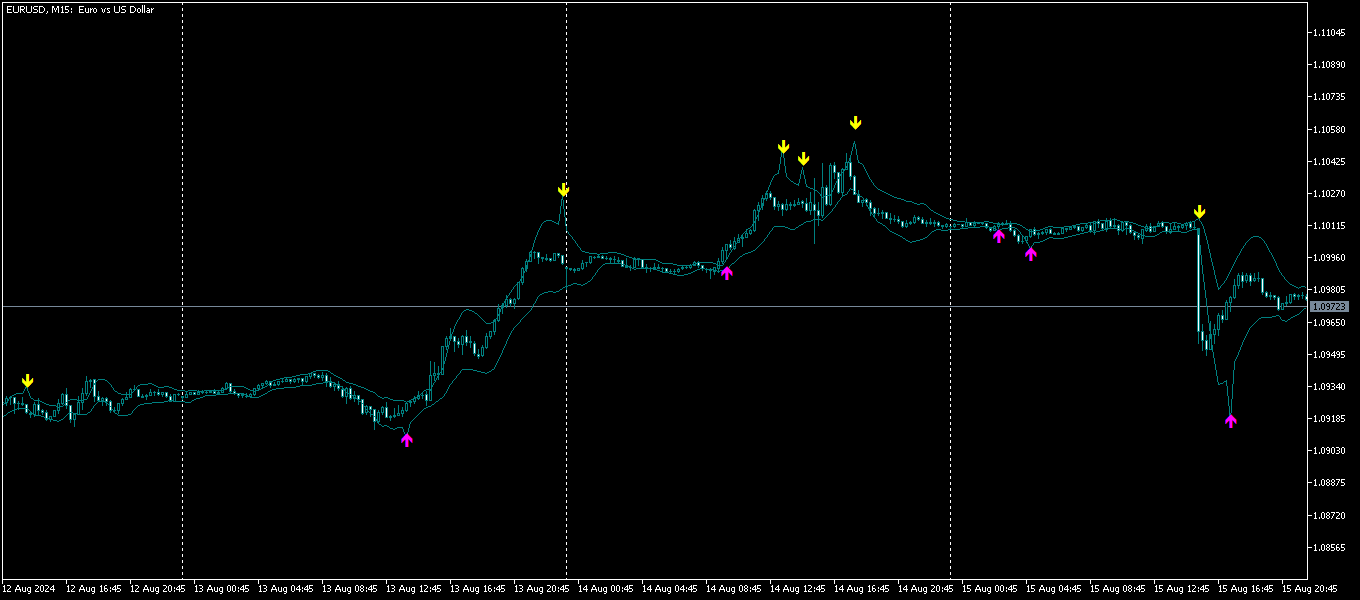
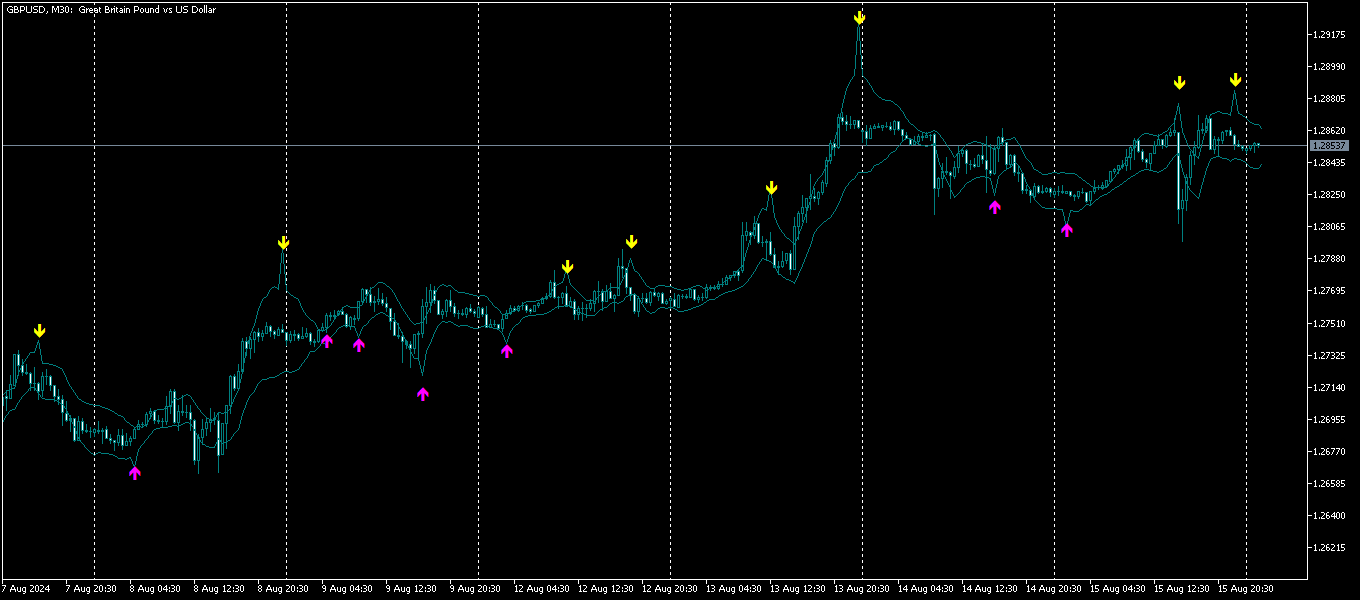
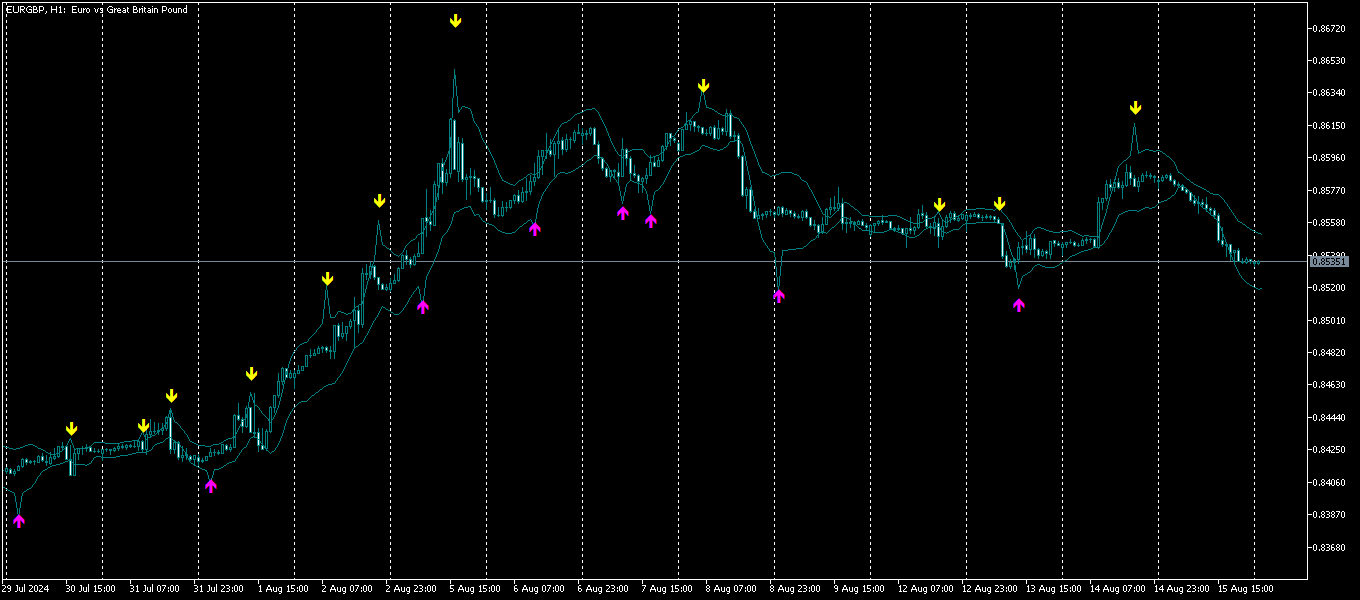
  3. Flèche jaune - Sell signal , flèche rose - Buy signal .
  4. Le calcul optimisé de l'indicateur permet de l'ouvrir sur plusieurs graphiques sans épuiser le processeur.
  5. L'indicateur n'est jamais redessiné, tous les signaux ne le sont que lorsque la bougie se ferme.

Paramètres d'entrée

  • First Line - Première période MA pour le calcul des signaux
  • Second Line - La période du deuxième MA pour calculer les signaux (il est recommandé de la régler 2 à 4 fois plus longue que la période du premier MA)
  • Play Sound / Display Pop -up Message / Send Push Notification / Send Email - Utiliser des notifications lorsque des flèches de signal et des arrêts apparaissent.
  • Sound for Signals - Fichier sonore pour les signaux.

Produits recommandés
Cet indicateur de tableau de bord d'offre et de demande à plusieurs périodes et à plusieurs symboles envoie des alertes lorsque le prix a atteint une zone d'offre/demande. Il est également possible de l'utiliser pour être alerté des doubles hauts/bas réguliers au lieu des zones. Il peut être utilisé avec toutes les plages horaires de M1 à MN.       Un maximum de 9 périodes peuvent être affichées dans le tableau de bord en même temps.   Il est possible d'utiliser des filtres RSI, divergence (MACD
DYNAMIC SR TREND CHANNEL Dynamic SR Trend Channel is a simple indicator for trend detection as well as resistance/support levels on the current timeframe. It shows you areas where to expect possible change in trend direction and trend continuation. It works with any trading system (both price action and other trading system that use indicators) and is also very good for renko charting system as well. In an uptrend, the red line (main line) serves as the support and the blue line serves as the
Seasonal Pattern Trader
Dominik Patrick Doser
Disclaimer : Keep in mind that seasonal patterns are not always reliable. Therefore, thoughtful risk management is crucial to minimize losses.  Seasonal patterns in the financial world are like a well-guarded secret that successful investors use to their advantage. These patterns are recurring price movements that occur during specific periods or around special events. Additionally, there are also intraday patterns that repeat. For example, Uncle Ted from Forex Family suggests examining previou
Descriptions A point point is a technical analysis indicator, or calculations, used to determine the overall trend of market over different time frames. This indicator calculate the highest or lowest pivots among left x and right y bars and show the high/low level during that period.   From that, you could clearly see the top resistance & bottom support level and how market goes break out. Instructions pivotLeft - pivot left bar count pivotRight - pivot right bar count pivotHighColor - c
Drawing Pack MT5
John Louis Fernando Diamante
This indicator provides several drawing tools to assist in various methods of chart analysis. The drawings will keep their proportions (according to their handle trendline) across different chart scales, update in real time, and multiple drawings are supported. # Drawing Option Description  1 Grid box draggable boxed grid, user defines rows x colums, diagonal ray option  2 Grid partial or fullscreen grid, sized by handle line  3 Grid flex a diagonal grid, sized and sloped by handle line
【Super Scanner】Indicator Introduction : The color of the Super Scanner which is green and climbing up means that the price trend is going up.The color of the Super Scanner is red and going down means that the price trend is going down. It is very simple to use it to judge the market trend! What's even better is that the open parameters of the indicators allow investors to adjust. You can adjust【Super Scanner】according to your needs. Adjust it faster to be closer to short-term market fluctuati
This indicator let user clearly see Buy/Sell signals. When a bar is closed and conditions meet, arrow signal will come up at Close Price, up is Buy and down is Sell. It works on all Timeframes. And you can set sound alert when signals come up.
INDICATEUR basé sur l'INTELLIGENCE ARTIFICIELLE qui génère d'éventuelles entrées d'achat et de vente pour les options binaires. l'indicateur fonctionne sur 3 stratégies différentes : 1) en lisant les volumes, il envoie un signal lorsque le prix doit s'inverser 2) à travers la divergence entre prix et volume, il envoie un signal lorsque la tendance doit se poursuivre ou s'inverser 3) grâce à la convergence entre le prix et le volume, il envoie un signal lorsque la tendance doit se poursu
A useful scanner/dashboard that shows the RSI values for multiple symbols and Time-frames. It can be easily hidden/displayed with a simple click on the scanner man top left of the dashboard. You can input upper and lower RSI values and the colours can be set to show when above/below these values. The default values are 70 and 30. There are also input colours for when the RSI is above or below 50 (but not exceeding the upper/lower levels Symbols and time-frames are input separated by commas.
ROC acceleration-deceleration is the manual system for medium-term scalping. Indicator based on custom ROC system which defines bullish/bearish market and especially  acceleration-deceleration of tendention in the market's main direction. Buy arrow is plotted during bearish market when current trend decelerates and sell  arrow is plotted during bullish market when current trend decelerates. Main Indicator's Features Signals are not repaint,non-late or disappear(exept cases when system recalculat
** All Symbols x All Time frames scan just by pressing scanner button ** *** Contact me  to send you instruction and add you in "Harmonic Scanner group" for sharing or seeing experiences with other users. Introduction Harmonic Patterns are best used to predict turning point. Harmonic Patterns give you high win rate and high opportunities for trade in during one day. This indicator detects the best and successful patterns based on Harmonic Trading concepts . The   Harmonic Patterns   Scanner   Sc
Alert Up Down MT5
William Oswaldo Mayorga Urduy
ALERT UP - DOWN FOR METATRADER 5 This indicator generates an alert when the price leaves the zone between the UP and DOWN lines. You can generate alerts of various types such as: > Sound > Message box > Message in the expert box > Mail (previously configured) > PUSH notifications (previously configured) The lines must be configured from the indicator properties and not from the lines properties, since if it is done from the lines properties, the finonacci may be affected.
Aliens dougkang de moviles
Cesar Juan Flores Navarro
Tomamos 5 medios móviles las unimos en una la cual suavizamos y volvemos a suavizar, resultando un mega suavizador de medios móviles suavizadas. Indicador de mql5 funciona en cualquier broker y para todos los tiempos, siendo el mas optimo el de 5, 15 a mas. Funciona mejor en grupo consigo misma osea poner uno de 14 y otro de 50 y 400,, así se observa mejor su desempeño.
A fully automated trading system based on trend analysis and consisting of two interdependent bots: one works when the market rises (Buy-bot), the second - when the market falls (Sell-bot). Link to the second bot (Sell-bot):  https://www.mql5.com/ru/market/product/78678?source=Site+Market+Product+Page The system works on a "set it and forget it" principle. The client does not need to do anything except ensure the round-the-clock operation of the trading terminal. The developer assumes obligation
L'indicateur aide à entrer dans un commerce en suivant la tendance, en même temps, après une certaine correction. Il trouve de forts mouvements de tendance d'une paire de devises sur un nombre donné de barres, et trouve également des niveaux de correction à cette tendance. Si la tendance est suffisamment forte et que la correction devient égale à celle spécifiée dans les paramètres, l'indicateur le signale. Vous pouvez définir différentes valeurs de correction, les valeurs de 38, 50 et 62 (nive
BS Time Band是一个很好的波段交易指示器,这个指标可以单独使用,但是最好是配合 StartPoint 一起使用效果更好,适用于任何时间框架,非常适合喜欢做波段交易的朋友。它能很好的体现出一个波段的完整信息,你可以很快的从这个指示器上寻找到最佳的预警区域,然后配合 StartPoint 找到最佳的buy位置和最佳的sell位置,也能很好根据指示器去坚守自己的持仓定订单。指标不含有未来函数,不会重新绘制,不仅能够应用到自己的手动交易过程中,还能完全可以写入到自己的EA中。(如果你感觉到这个指标能够帮助你进行更准确的交易,请帮忙给个好评,希望我的作品能够帮助更多有需要的人) =================参考使用方法=================== 此指标可以适用于任何交易品种。 做波段建议参数 timeFame:M5 如果配合 StartPoint 建议 StartPoint 的参数为(240,60)
AdvancedCandleWrapper
Douglas Mbogo Ntongai
Draw as many custom candles as possible on a single chart with this special indicator. Your analysis skill will never be the same again for those who know the power that having a hawkeye view of all price action at once provides. Optimized for performance and allows customization on the appearance of candle bodies and wicks. This is an integral part of analysis at our desks, we hope it will never leave your charts too once you can use it to its full potential.
Découvrez RSIScalperPro - un indicateur innovant basé sur le RSI pour MetaTrader 5, optimisé pour le scalping sur des graphiques d'une minute ! Avec RSIScalperPro, vous aurez entre vos mains un puissant outil vous fournissant des signaux d'entrée et de sortie précis. RSIScalperPro utilise deux indicateurs RSI différents pour fournir des signaux clairs pour les niveaux de surachat et de survente. Vous pouvez ajuster les périodes et les valeurs limites des deux RSI selon votre stratégie de tradin
My Point MT5
Claudia Ramona Angerer
Diagnosis of major and minor pivot Trend detection with many signals Can be used in all symbols Can be used in all time frames Settings: Back Show: The number of candles it displays If you need any adjustments, or have any questions or suggestions, message me How to trade: Blue: sell signal Red: buy signal Blue and red at the same time: no signal Exit signal: Opposite signal
The indicator determines a special pattern of Joe Dinapoli. It gives very high probability buy and sell signals. Indicator does not repaint. Indicator Usage Buy Signal ''B'' Entry : Market buy order at signal bar close Stop : Low of signal bar Take Profit : First swing high Sell Signal ''S'' Entry : Market sell order at signal bar close Stop : High of signal bar Take Profit : First swing low Indicator Parameters Fast EMA : External Parameter (should be kept as default) Slow EMA: External Param
Impulse fractals indicator - is counter-trend oriented complex market fractal pattern.  Market creates bull/bear impulse, trend starts, fractals on impulsed wave are an agressive pullback signals. Buy arrow is plotted when market is bearish and it's impulse showed up-side fractal, and sell arrow is plotted when market is bullish and it's impulse showed dn-side fractal. Main indicator's adjustable inputs : impulsePeriod - main period of impulse histogram  filterPeriod  - smoothes impulse accordi
A fully automated trading system   based on trend analysis and consisting of two interdependent bots: one works when the market rises (Buy-bot), the second - when the market falls (Sell-bot). Link to the second bot (Buy-bot):  https://www.mql5.com/ru/market/product/78152?source=Site+Market+Product+Page The system works on a "set it and forget it" principle.   The client does not need to do anything except ensure the round-the-clock operation of the trading terminal. The developer assumes obligat
Nouvel Indicateur d'Enthousiasme de la Tendance (TEI), l'outil ultime pour maximiser les profits sur les marchés. Cet indicateur innovant combine la puissance de l'analyse des tendances avec l'excitation du sentiment du marché, offrant aux traders un avantage unique sur les marchés financiers en constante évolution. Le TEI utilise des algorithmes avancés pour analyser la tendance sous-jacente d'un instrument financier et l'enthousiasme des traders pour identifier les opportunités de profit
Man Trend
Ivan Simonika
Man Trend uses at its core the process of identifying the rate of change in price growth and allows you to find entry and exit points from the market. The indicator was created on the basis of the original indicators for searching for extreme points, the indicator is well suited for determining a reversal or a large sharp jerk to one of the sides, thanks to it you will know when this happens, it will notify you with the appearance of a blue dot to buy red to sell. This is a fundamental tech
XFlow
Maxim Kuznetsov
XFlow shows an expanding price channel that helps determine the trend and the moments of its reversal. It is also used when accompanying transactions to set take profit/stop loss and averages. It has practically no parameters and is very easy to use - just specify an important moment in the history for you and the indicator will calculate the price channel. DISPLAYED LINES ROTATE - a thick solid line. The center of the general price rotation. The price makes wide cyclical movements around the
Stochastic Profesional
Ignacio Agustin Mene Franco
Stochastic Professional 3 in 1! It is an indicator programmed to operate professionally! and very easy to use where it gives you alerts, marks sales and purchases, sending you alerts at any time, where you reconfirm the entry with green and red arrows for sale and purchase very effective for scalping and lengths! suitable for Forex and synthetic indices! Good profit! World Investor.
This indicator is based on a mathematical formula which gives you the possibility to seek and find the right frequency of the movement, and to determine its key level; just adjust the frequency parameter! Simple and highly effective; using this indicator you can easily predict the next support and  resistance    levels of the day. Also, this indicator determines the range and the next two importants levels of the movement outside this range so far. SGFL3 and RGFL3  are levels with high certainty
[ MT4 Version ]  [ Kill Zones ]  [ SMT Divergences ] How to trade using Order Blocks:  Click here User Interface Performance:  During testing in the strategy tester, the UI may experience lag. Rest assured, this issue is specific to the testing environment and does not affect the indicator's performance in live trading. Elevate your trading strategy with the  Order Blocks ICT Multi TF  indicator, a cutting-edge tool designed to enhance your trading decisions through advanced order block analysis
This indicator is a perfect wave automatic analysis indicator for practical trading! 黄金实战 案例... The standardized definition of the band is no longer a wave of different people, and the art of man-made interference is eliminated, which plays a key role in strict analysis of the approach.=》Increase the choice of international style mode, (red fall green rise style) The  purchase discount is currently in progress! Index content: 1.Basic wave: First, we found the inflection point of the ba
The EA opens trades based on Fractals indicator signals and uses smart averaging and position volume calculation. Unlike most grid expert advisors, Double Grid Pro opens averaging positions only on signals. The Fractals indicator is considered the most effective in this case. The expert Advisor can be configured for an aggressive and conservative trading style. The key parameter in the strategy is the CorrectionValue parameter, it indicates the size of the correction at which we close the ent
Les acheteurs de ce produit ont également acheté
TPSpro RFI Levels MT5
Roman Podpora
4.73 (11)
INSTRUCTIONS       RUS   -   ANGLAIS       Il   est recommandé de l'utiliser avec un indicateur       -       TPSpro   TENDANCE PRO -   Version MT4         Un élément clé du trading est constitué par les zones ou les niveaux à partir desquels les décisions d'achat ou de vente d'un instrument de trading sont prises. Malgré les tentatives des principaux acteurs de dissimuler leur présence sur le marché, ils laissent inévitablement des traces. Notre tâche était d'apprendre à identifier ces traces
TPSproTREND PrO MT5
Roman Podpora
4.89 (9)
TPSpro TREND PRO  - is a trend indicator that automatically analyzes the market and provides information about the trend and each of its changes, as well as giving signals for entering trades without redrawing! The indicator uses each candle, analyzing them separately. referring to different impulses - up or down impulse. Exact entry points into transactions for currencies, crypto, metals, stocks, indices!  Version MT4               DETAILED DESCRIPTION               R ecommended to use with an
Tout d'abord, il convient de souligner que ce système de trading est un indicateur non repeint, non redessiné et non retardé, ce qui le rend idéal pour le trading manuel et automatisé. Cours en ligne, manuel et téléchargement de préréglages. Le "Système de Trading Smart Trend MT5" est une solution de trading complète conçue pour les traders débutants et expérimentés. Il combine plus de 10 indicateurs premium et propose plus de 7 stratégies de trading robustes, ce qui en fait un choix polyvalent
Atomic Analyst MT5
Issam Kassas
4.42 (19)
Tout d'abord, il convient de souligner que cet indicateur de trading n'est ni repainting, ni redrawing et ne présente aucun délai, ce qui le rend idéal à la fois pour le trading manuel et automatisé. Manuel de l'utilisateur : réglages, entrées et stratégie. L'Analyste Atomique est un indicateur d'action sur les prix PA qui utilise la force et le momentum du prix pour trouver un meilleur avantage sur le marché. Équipé de filtres avancés qui aident à éliminer les bruits et les faux signaux, et à
Quantum Trend Sniper
Bogdan Ion Puscasu
4.8 (49)
Présentation       Quantum Trend Sniper Indicator   , l'indicateur révolutionnaire MQL5 qui transforme la façon dont vous identifiez et négociez les inversions de tendance ! Développé par une équipe de traders expérimentés avec une expérience commerciale de plus de 13 ans,       Indicateur Quantum Trend Sniper       est conçu pour propulser votre parcours de trading vers de nouveaux sommets grâce à sa manière innovante d'identifier les inversions de tendance avec une précision extrêmement élevée
TrendMaestro5
Stefano Frisetti
note: this indicator is for METATRADER4, if you want the version for METATRADER5 this is the link:  https://www.mql5.com/it/market/product/108106 TRENDMAESTRO ver 2.4 TRENDMAESTRO recognizes a new TREND in the bud, he never makes mistakes. The certainty of identifying a new TREND is priceless. DESCRIPTION TRENDMAESTRO identifies a new TREND in the bud, this indicator examines the volatility, volumes and momentum to identify the moment in which there is an explosion of one or more of these data a
Ce tableau de bord affiche les derniers   modèles harmoniques   disponibles pour les symboles sélectionnés, ce qui vous permettra de gagner du temps et d'être plus efficace /   version MT4 . Indicateur gratuit:   Basic Harmonic Pattern Colonnes de l'indicateur Symbol :   les symboles sélectionnés apparaissent Trend   :   haussière ou baissière Pattern :   type de motif (gartley, papillon, chauve-souris, crabe, requin, cypher ou ABCD) Entry:   prix d'entrée SL:   prix du stop loss TP1:   1
FX Power MT5 NG
Daniel Stein
5 (5)
Obtenez votre mise à jour quotidienne du marché avec des détails et des captures d'écran via notre Morning Briefing ici sur mql5 et sur Telegram ! FX Power MT5 NG est la nouvelle génération de notre très populaire indicateur de force des devises, FX Power. Et qu'est-ce que ce compteur de force de nouvelle génération offre ? Tout ce que vous avez aimé de l'original FX Power PLUS Analyse de la force de l'OR/XAU Des résultats de calcul encore plus précis Périodes d'analyse configurables individuel
Blahtech Supply Demand MT5
Blahtech Limited
4.54 (13)
Was: $299  Now: $99   Supply Demand uses previous price action to identify potential imbalances between buyers and sellers. The key is to identify the better odds zones, not just the untouched ones. Blahtech Supply Demand indicator delivers functionality previously unavailable on any trading platform. This 4-in-1 indicator not only highlights the higher probability zones using a multi-criteria strength engine, but also combines it with multi-timeframe trend analysis, previously confirmed swings
Top indicator for MT5   providing accurate signals to enter a trade without repainting! It can be applied to any financial assets:   forex, cryptocurrencies, metals, stocks, indices .  Watch  the video  (6:22) with an example of processing only one signal that paid off the indicator! MT4 version is here It will provide pretty accurate trading signals and tell you when it's best to open a trade and close it. Most traders improve their trading results during the first trading week with the help of
FxaccurateLS
Shiv Raj Kumawat
WHY IS OUR FXACCCURATE LS MT5 THE PROFITABLE ? PROTECT YOUR CAPITAL WITH RISK MANAGEMENT Gives entry, stop and target levels from time to time. It finds Trading opportunities by analyzing what the price is doing during established trends. POWERFUL INDICATOR FOR A RELIABLE STRATEGIES We have made these indicators with a lot of years of hard work. It is made at a very advanced level. Established trends provide dozens of trading opportunities, but most trend indicators completely ignore them!
AT Forex Indicator MT5
Marzena Maria Szmit
5 (4)
The AT Forex Indicator MT5 is a sophisticated trading tool designed to provide traders with a comprehensive analysis of multiple currency pairs. This powerful indicator simplifies the complex nature of the forex market, making it accessible for both novice and experienced traders. AT Forex Indicator uses advanced algorithms to detect trends, patterns and is an essential tool for traders aiming to enhance their forex trading performance. With its robust features, ease of use, and reliable signal
Advanced Supply Demand MT5
Bernhard Schweigert
4.5 (14)
La meilleure solution pour tout commerçant débutant ou expert ! Cet indicateur est un outil de trading unique, de haute qualité et abordable car nous avons intégré un certain nombre de fonctionnalités propriétaires et une nouvelle formule. Avec cette mise à jour, vous pourrez afficher des zones à double horaire. Vous pourrez non seulement afficher un TF plus élevé, mais afficher les deux, le graphique TF, PLUS le TF supérieur : AFFICHAGE DES ZONES NICHÉES. Tous les traders Supply Demand vont ado
TPA True Price Action indicator reveals the true price action of the market makers through 100% non-repainting signals strictly at the close of a candle! TPA shows entries and re-entries, every time the bulls are definitely stronger than the bears and vice versa. Not to confuse with red/green candles. The shift of power gets confirmed at the earliest stage and is ONE exit strategy of several. There are available now two free parts of the TPA User Guide for our customers. The first "The Basics"
XQ Indicator MetaTrader 5
Marzena Maria Szmit
3 (2)
Step into the realm of Forex trading with confidence and precision using XQ, a cutting-edge Forex indicator designed to elevate your trading game to unprecedented heights. Whether you're a seasoned trader or just stepping into the world of currency exchange, XQ Forex Indicator empowers you with the insights and signals needed to make informed trading decisions. The signal conditions are a combination of three indicators, and XQ Forex Indicator only display  medium and long-term trends . The ind
PZ Swing Trading MT5
PZ TRADING SLU
5 (4)
Protect against whipsaws: revolutionize your swing trading approach Special Offer: Purchase now to receive free bonuses worth $135! (Read more for details) Swing Trading is the first indicator designed to detect swings in the direction of the trend and possible reversal swings. It uses the baseline swing trading approach, widely described in trading literature. The indicator studies several price and time vectors to track the aggregate trend direction and detects situations in which the market i
Trade smarter, not harder: Empower your trading with Harmonacci Patterns Special Offer: Purchase now to receive free bonuses worth $165! (Read more for details) This is arguably the most complete harmonic price formation auto-recognition indicator you can find for the MetaTrader Platform. It detects 19 different patterns, takes fibonacci projections as seriously as you do, displays the Potential Reversal Zone (PRZ) and finds suitable stop-loss and take-profit levels. [ Installation Guide | Up
FX Volume MT5
Daniel Stein
4.93 (14)
Obtenez votre mise à jour quotidienne du marché avec des détails et des captures d'écran via notre Morning Briefing ici sur mql5 et sur Telegram ! FX Volume est le PREMIER et SEUL indicateur de volume qui fournit un VRAI aperçu du sentiment du marché du point de vue d'un courtier. Il fournit des informations impressionnantes sur la façon dont les acteurs institutionnels du marché, comme les courtiers, sont positionnés sur le marché des changes, bien plus rapidement que les rapports COT. Voir c
Noize Absorption Index - is the manual trading system that measures the difference of pressure between bears forces and bulls forces. Green line - is a noize free index that showing curent situation. Zero value of index shows totally choppy/flat market.Values above zero level shows how powerfull bullish wave is and values below zero measures bearish forces.Up arrow appears on bearish market when it's ready to reverse, dn arrow appears on weak bullish market, as a result of reverse expectation.
Unlock key market insights with automated support and resistance lines Special Offer: Purchase now to receive free bonuses worth $75! (Read more for details) Tired of plotting support and resistance lines? This is a multi-timeframe indicator that detects and plots supports and resistance lines in the chart with the same precision as a human eye would. As price levels are tested over time and its importance increases, the lines become thicker and darker, making price leves easy to glance and ev
Gold Trend 5
Sergei Linskii
5 (1)
Gold Trend - il s'agit d'un bon indicateur technique boursier. L'algorithme de l'indicateur analyse le mouvement du prix d'un actif et reflète la volatilité et les zones d'entrée potentielles. Les meilleurs signaux de l'indicateur: - Pour la VENTE = histogramme rouge + pointeur SHORT rouge + flèche de signalisation jaune dans la même direction. - Pour l'ACHETER = histogramme bleu + pointeur LONG bleu + flèche de signalisation aqua dans la même direction. Avantages de l'indicateur: 1
Ce tableau de bord découvre et affiche les zones   d'offre   et de   demande   sur le graphique, à la fois en mode scalping et à long terme, en fonction de votre stratégie de trading pour les symboles sélectionnés. En outre, le mode scanner du tableau de bord vous permet de vérifier tous les symboles souhaités en un coup d'œil et de ne manquer aucune position appropriée /   Version MT4 Indicateur gratuit:   Basic Supply Demand Caractéristiques Permet de visualiser les opportunités de tr
The Price Action Finder Multi indicator is an indicator of entry points that searches for and displays Price Action system patterns on dozens of trading instruments and on all standard time frames: (m1, m5, m15, m30, H1, H4, D1, Wk, Mn). The indicator places the found patterns in a table at the bottom of the screen. By clicking on the pattern names in the table, you can move to the chart where this pattern is located. Manual (Be sure to read before purchasing) | Version for MT4 Advantages 1. Pa
Gold ATR MTF - il s'agit d'un bon indicateur technique boursier. L'algorithme de l'indicateur ATR (Average True Range) analyse l'évolution du prix de l'actif et reflète la volatilité en dessinant les niveaux correspondants dans des pourcentages spécifiés (%) du prix d'ouverture de la période spécifiée (D1). Les indicateurs (rouge et/ou bleu D1 H4) de la direction du mouvement des prix du symbole et les signaux fléchés sont des aides supplémentaires et essentielles pour un trading intrajournalie
Automated Trendlines MT5
Georgios Kalomoiropoulos
Les lignes de tendance sont l'outil d'analyse technique le plus essentiel dans le trading forex. Malheureusement, la plupart des commerçants ne les dessinent pas correctement. L'indicateur Automated Trendlines est un outil professionnel pour les traders sérieux qui vous aide à visualiser le mouvement de tendance des marchés. Il existe deux types de lignes de tendance, les lignes de tendance haussières et les lignes de tendance baissières. Dans la tendance haussière, la ligne de tendance
Was: $249  Now: $99   Market Profile defines a number of day types that can help the trader to determine market behaviour. A key feature is the Value Area, representing the range of price action where 70% of trading took place. Understanding the Value Area can give traders valuable insight into market direction and establish the higher odds trade. It is an excellent addition to any system you may be using. Inspired by Jim Dalton’s book “Mind Over Markets”, this indicator is designed to suit the
Order Block Hunter MT5
Noha Mohamed Fathy Younes Badr
5 (1)
Order block hunter indicator is the best indicator for  hunt the order blocks that area where there has been a large concentration of limit orders waiting to be executed Order blocks are identified on a chart by observing previous price action and looking for areas where the price experienced significant movement or sudden changes in direction .This indicator does that for you by using very complicated codes and helps you to take the best areas To buy and sell because it make marks at the best a
MetaForecast M5
Vahidreza Heidar Gholami
5 (2)
MetaForecast prédit et visualise l'avenir de n'importe quel marché en se basant sur les harmoniques des données de prix. Bien que le marché ne soit pas toujours prévisible, s'il y a un motif dans les prix, MetaForecast peut prédire l'avenir aussi précisément que possible. Comparé à d'autres produits similaires, MetaForecast peut générer des résultats plus précis en analysant les tendances du marché. Paramètres d'entrée Past size (Taille passée) Spécifie le nombre de barres que MetaForecast uti
Golden Spikes Premium
Kwaku Bondzie Ghartey
Golden Spikes Detector Acknowledgement and Dedications:  The name of this indicator was Inspired by an Original; Mr Grant Koopman; a Knowledgeable and experienced Synthetics trader. I dedicate this indicator to Mr Grant.  Overview: The Golden Spikes Premium is a groundbreaking trading indicator meticulously crafted for the Boom and Crash indices on the Deriv market. Tailored to meet the needs of discerning traders, this powerful tool operates exclusively on the one-minute timeframe, providin
Market Overview MT5
Mehran Sepah Mansoor
Optimisez vos décisions de trading avec notre indicateur de force et de sentiment du marché et ne tradez plus à contre-courant! Méticuleusement conçu pour les traders sérieux qui apprécient les informations précises et opportunes, notre indicateur fournit une vue d'ensemble des 28 paires principales d'une manière très simple. Cet outil est capable de classer les paires de devises en fonction de leur popularité, de la force de la tendance haussière ou baissière et du pourcentage d'acheteurs et
Plus de l'auteur
Volatility Trend System - un système de trading qui donne des signaux pour les entrées. Le système de volatilité donne des signaux linéaires et ponctuels dans le sens de la tendance, ainsi que des signaux pour en sortir, sans redessiner ni retarder. L'indicateur de tendance surveille la direction de la tendance à moyen terme, montre la direction et son changement. L'indicateur de signal est basé sur les changements de volatilité et montre les entrées sur le marché. L'indicateur est équipé de
Candle Binary Scalper est un produit d'analyse technique pour le forex et les options binaires. Comprend plusieurs indicateurs techniques combinés dans un système commercial. Convient pour le trading manuel dans une tendance, pour le scalping et les options binaires. Fonctionne sur tous les délais et instruments de trading. Les délais recommandés pour le trading M15, M30, H1 et H4, M5 et M1 doivent être utilisés en cas de forte volatilité. Il existe plusieurs types d'alertes. Comment utili
L'indicateur " ZigZag on Trend " est un assistant pour déterminer la direction du mouvement des prix, ainsi qu'un calculateur de barres et de pips. Il se compose d'un indicateur de tendance qui surveille la direction du prix avec une ligne de tendance présentée sous la forme d'un zigzag et d'un compteur qui calcule le nombre de barres passées dans le sens de la tendance et le nombre de points sur une échelle verticale. (Les calculs sont effectués par l'ouverture de la barre) L'indicateur n'est p
Level Breakout Indicator est un produit d'analyse technique qui fonctionne à partir des limites supérieure et inférieure, ce qui peut déterminer la direction de la tendance. Fonctionne sur la bougie 0 sans redessin ni retard. Dans son travail, il utilise un système de différents indicateurs dont les paramètres ont déjà été configurés et combinés en un seul paramètre - « Scale », qui effectue la gradation des périodes. L'indicateur est facile à utiliser, ne nécessite aucun calcul, à l'aide d'un
Channel Cluster
Vitalyi Belyh
5 (1)
Cluster indicator working in the price channel. For operation, the indicator builds a channel line - (dashed line). Inside the channel, cluster sections are determined that determine the direction of the price movement - (histograms in two directions), start with large arrows. Small arrows are plotted above / below each histogram - indicator increase volatility. The indicator does not redraw the values. Works on any tools and timeframes. Entrances are made when large arrows appear, inside s
Indicateur de trading manuel et d'analyse technique pour le Forex. Il se compose d'un indicateur de tendance avec le niveau d'ouverture du jour de bourse et d'un indicateur de flèche pour déterminer les points d'entrée. L'indicateur ne se recolore pas ; il fonctionne lorsque la bougie se ferme. Contient plusieurs types d'alertes pour les flèches de signalisation. Peut être configuré pour fonctionner sur n’importe quel graphique, instrument de trading ou période. La stratégie de travail
Volatility Trend System - est un système commercial qui fournit des signaux pour les entrées. Le système de volatilité donne des signaux linéaires et ponctuels dans le sens de la tendance, ainsi que des signaux pour en sortir, sans redessin ni délai. L'indicateur de tendance surveille la direction de la tendance à moyen terme, montre la direction et son changement. L'indicateur de signal est basé sur les changements de volatilité et montre les entrées sur le marché. L'indicateur est équipé
Wave Reversal Indicator - determines the direction of trend waves and price reversals. The indicator shows wave movements and trend directions. It gives recommendations where to follow the trader, helps to follow the trading strategy. It is an addition to an intraday or medium-term strategy. Almost all parameters are selected for each time frame and are changed automatically, the only parameter for manual adjustment is the wavelength. Works on various trading instruments and timeframes, rec
FREE
Scalping Entry Points - est un système de trading manuel qui peut s'adapter aux mouvements de prix et donner des signaux pour ouvrir des trades sans redessiner. L'indicateur détermine la direction de la tendance par le niveau central de support et de résistance. L'indicateur de point fournit des signaux pour les entrées et les sorties. Convient pour le trading intrajournalier manuel, le scalping et les options binaires. Fonctionne sur tous les délais et instruments de trading. L'indicateur donn
Scalping and Binary Signal Detector - Indicateur de scalping qui donne des signaux directionnels pour l'ouverture de positions le long de la tendance. L'indicateur est un système de trading complet qui peut être utilisé pour le Forex et les options binaires. Le système d'algorithmes vous permet de reconnaître des mouvements de prix intenses sur plusieurs barres consécutives. L'indicateur fournit plusieurs types d'alertes pour les flèches. Fonctionne sur tous les instruments de trading et dél
Un ensemble d’indicateurs qui reconnaissent les points tournants. Détecte les hauts et les bas des combinaisons de chandeliers après les avoir soustraits de deux MA. Applicable aux systèmes de trading lors de l'utilisation d'entrées anticipées. Peut être utilisé le long de la tendance pour le scalping et le trading intrajournalier, et pour détecter les inversions de tendance dès les premiers stades. Possibilités Les paramètres fournissent des paramètres flexibles pour tous les délais et i
Zig-Zag indicator with additional signals for inputs. Visually easy to use: The red zig-zag line is an uptrend. The blue zig-zag line is a downward trend. Arrows in the form of additional signals. Works on any trading pairs. On any timeframe. Not redrawn. Input parameters Zig-Zag Period - Zig-zag period (from 5) Signal Period - period of signal arrows (from 3) Alerts for signals Play sound - Sound alert Display pop-up message - Notification by message on the screen Send push not
FREE
Candle Power Signals est un indicateur de tendance qui utilise une stratégie de recherche de signaux volatils potentiels pour prendre des décisions commerciales. En analysant le marché, l'indicateur identifie les zones de volatilité accrue et diminuée au sein du mouvement de tendance directionnelle. Les principaux paramètres de génération de signal ont déjà été configurés, les réglages et périodes restants sont indexés en 2 paramètres pour une configuration manuelle : 1. "Candle calculation
Level Breakout Indicator est un produit d'analyse technique qui fonctionne à partir des limites supérieure et inférieure, ce qui peut déterminer la direction de la tendance. Fonctionne sur la bougie 0 sans redessin ni retard. Dans son travail, il utilise un système de différents indicateurs dont les paramètres ont déjà été configurés et combinés en un seul paramètre - « Scale », qui effectue la gradation des périodes. L'indicateur est facile à utiliser, ne nécessite aucun calcul, à l'aide d'un
Max Min Reversal Arrows MT5 - an arrow reversal indicator for predicting price movement. The indicator is built on the support and resistance levels at the local lows and highs of the price. Product features Arrows appear on the current candle. The indicator does not redraw. Can be used on all time frames and trading instruments. Recommended timeframes to use M30, H1, H4. The dotted lines are the support and resistance levels within the signal. Price movement from these levels means a reve
Le système de négociation technique des flèches de renversement de BB a été développé pour prédire les points inversés pour prendre des décisions de vente au détail. La situation actuelle du marché est analysée par l'indicateur et structurée pour plusieurs critères: l'attente des moments d'inversion, des tournants potentiels, des signaux d'achat et de vente. L'indicateur ne contient pas d'informations excédentaires, a une interface visuelle compréhensible, permettant aux commerçants de prend
Indicateur cyclique pour le trading et la prévision de l'orientation du marché. Montre le comportement cyclique du prix sous la forme d'un oscillateur. Donne des signaux pour l'ouverture des transactions lorsqu'il y a un rebond des limites supérieure et inférieure de l'oscillateur. Sous forme d'histogramme, il montre la force lissée de la tendance.  Complètera toute stratégie de trading, du scalping à l'intraday.  L'indicateur n'est pas redessiné.  Convient pour une utilisation sur tous les
Indicateur du canal de prix et générateur de point d'arrêt à l'intérieur. Il donne une idée de la position du prix par rapport à la durée d'utilisation. Il contient des lignes de rebond de tendance lissées construites le long des frontières du canal et des points de rebond qui déterminent les moments d'entrée et de sortie. Fonctionne sur divers instruments de trading et délais. Comment travailler avec l'indicateur Suivez la ligne de rupture de canal, la ligne bleue est en haut des entrées
A trend indicator showing the strength of bulls and bears in a trading range. Consists of two lines: The green line is a balanced overbought/oversold condition. The red line is the direction of trading activity. Does not redraw calculations. Can be used on all Symbols/Instruments/Time Frames. Easy to use and set up. How to use the indicator and what it determines. The basic rule is to follow the direction of the red line: if it crosses the green line from the bottom up, the market i
FREE
Smoothed oscillator based on basic DeMarker indicators. Shows the volatility of the price direction. Can be used to determine intraday entry and exit points from the market. Suitable for use on all time frames and trading instruments. It is recommended to use on M5, M15 and M30. The green line shows the price direction up, the blue line shows the price direction down. The red line is a smoothed representation of the price. Input parameters      Period - Period of the main indicator DeMarker
FREE
Un indicateur technique conçu spécifiquement pour le scalping qui peut identifier les impulsions de volatilité et montrer leur durée. Il dispose de paramètres flexibles pour les réglages manuels, vous permettant d'appliquer la fonctionnalité de l'indicateur à n'importe quel instrument de trading. Les délais recommandés à utiliser sont M5, M15, M30, H1 et H4. Il existe plusieurs types d'alertes. Tous les signaux ne changent ni ne se recolorent jamais à la fermeture de la bougie. L'indicate
Lines Channel Pro
Vitalyi Belyh
5 (1)
The "Lines Channel Pro" indicator determines price reversals from the High/Low channel. Contains a built-in trend finder, signal lines, entry and exit points. The recommended timeframe for M15 to work is D1. For each timeframe and trading instrument, depending on the volatility, it is necessary to select individual settings. Does not redraw calculations. Input parameters Use Channel trend filter - Turn on/off the trend filter Channel trend period - Trend filter period (from 8 and abov
Arrow indicator with trend filter. Generates trend input without delays or delays - on the emerging candle. Suitable for use on any trading tools and timeframes. Easy to use, contains the direction of the trend in the form of a histogram lines and signal generator. Input parameters Period Trend Line - Period of the Histogram Line Signal Generator Period - If the period is longer, then the arrows are less Play sound Display pop-up message Send push notification Send email Sound file signal -
An indicator that determines the point levels of price resistance. The arrows indicate price bounces in the indicated directions. Arrows are not redrawn formed on the current candle, shown on the previous candle for convenience.      It has one setting - the formation intensity: If the parameter is smaller, most of the signals are formed in a wide trend. If the parameter is larger, signals are formed in a narrower trend. Input parameters Formation Intensity - Arrow Formation Intensity Num
A technical indicator that calculates its readings based on trading volumes. It has an oscillatory line that follows the change in volumes. Large arrows on the line indicate reversal values. A channel is built around the line with small arrows showing the strengthening of price movement in the direction of increasing volumes. The indicator does not redraw values. Works on any instrument and timeframe. It can complement any trading strategy by finding a trend or make entries in the direction of
Max Min Reversal Arrows - an arrow reversal indicator for predicting price movement. The indicator is built on the support and resistance levels at the local lows and highs of the price. Product features Arrows appear on the current candle. The indicator does not redraw. Can be used on all time frames and trading instruments. Recommended timeframes to use M30, H1, H4. The dotted lines are the support and resistance levels within the signal. Price movement from these levels means a reversal.
Scalping Entry Points - est un système de trading manuel qui peut s'adapter aux mouvements de prix et donner des signaux pour ouvrir des trades sans redessiner. L'indicateur détermine la direction de la tendance par le niveau central de support et de résistance. L'indicateur de point fournit des signaux pour les entrées et les sorties. Convient pour le trading intrajournalier manuel, le scalping et les options binaires. Fonctionne sur tous les délais et instruments de trading. L'indicateur donn
Un outil de tendance pour le trading et l'analyse et la prévision de la situation du marché. L'indicateur comprend une ligne directrice qui sert de guide aux vagues de tendance, quotidiennes ou hebdomadaires. Et un oscillateur spécial qui analyse les volumes de trading. Il montre les périodes de marchés de surachat et de survente et détermine les points d'entrée au début d'un mouvement de prix potentiel. L'indicateur ne se redessine pas et ne traîne pas. Fonctionne sur tous les instruments e
Binary Lines est un indicateur d'analyse technique pour les devises, les matières premières, les crypto-monnaies, les actions, les indices et tous les instruments financiers. Peut être utilisé pour les options binaires ou le scalping Forex. Affiche les points d'entrée et de sortie à intervalles fixes et fournit commerçants les informations nécessaires sur les résultats d'éventuelles transactions. Les points d'entrée se forment au tout début de la bougie, dans le sens de la ligne MA, durée les tr
Un indicateur technique qui calcule ses lectures sur les volumes de transactions. Sous forme d'histogramme, il montre l'accumulation de la force de mouvement de l'instrument de trading. Il dispose de systèmes de calcul indépendants pour les directions haussières et baissières. Fonctionne sur tous les instruments de trading et délais. Peut compléter n’importe quel système commercial. L'indicateur ne redessine pas ses valeurs, les signaux apparaissent sur la bougie actuelle. Il est facile à util
Filtrer:
Aucun avis
Répondre à l'avis