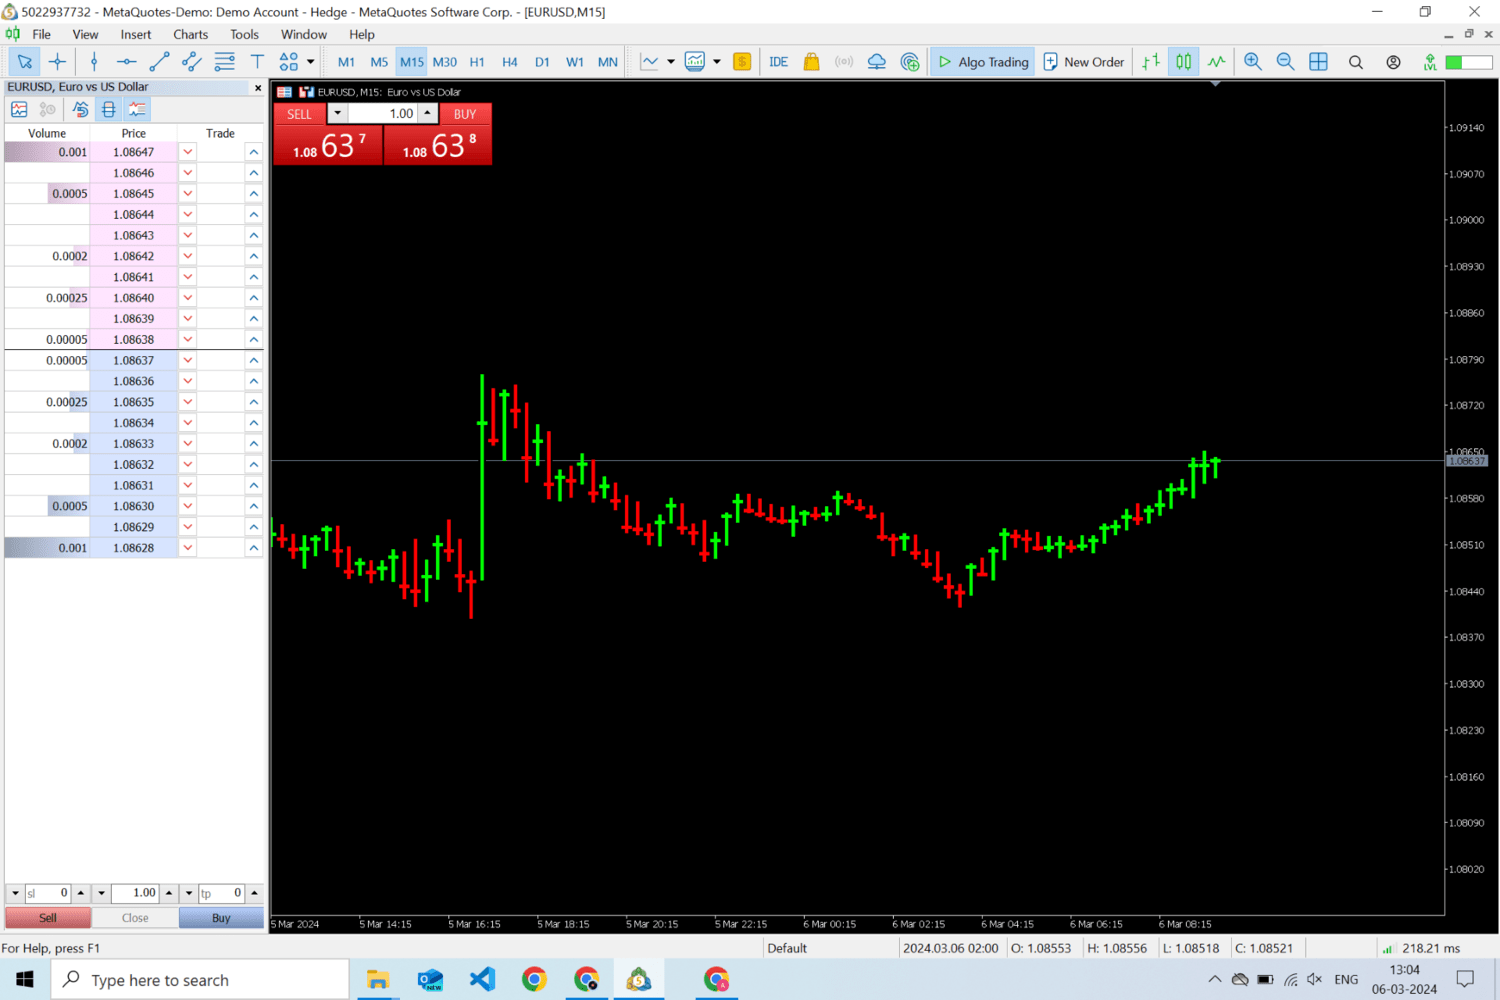
High Low Close chart with thick wicks
- Indicateurs
- Amin Alisher Shaikh
- Version: 1.0
- Activations: 5
Remarque - vous devez masquer votre type de graphique existant, vous pouvez le faire en changeant les couleurs du graphique, si vous ne savez pas comment le faire, regardez cette vidéo - https://youtu.be/-4H6Z5Z4fKo
ou contactez-moi à priceaction9@outlook.com
Il s'agit d'un type de graphique qui sera affiché à la place de votre graphique, et il montre uniquement le haut, le bas et la clôture, et il comporte des mèches épaisses. Il vous aide à mieux comprendre chaque bougie en réduisant le bruit introduit par les prix d'ouverture sur chaque bougie.
Par exemple sur une échelle de 1 à 10 si la bougie s'ouvre à 5 et se ferme à 8, et fait un minimum de 1 alors elle forme un corps de 3 points et aura des mèches pour le reste des points, et donc parfois il est difficile de faire le sens.
Dans ce graphique, si le même scénario se produit, le point de clôture sera affiché à 8 et en le regardant, vous aurez une idée immédiate, qu'il est passé de 1 à 8 dans le sens positif et de 10 à 8 dans le sens négatif et donc vous savez que c'est le cas. une bougie haussière.
Si vous avez des questions, faites-le moi savoir ici priceaction9@outlook.com