UT Bot Simple
- Indicateurs
- Bartlomiej Tadeusz Tomaja
- Version: 1.1
- Activations: 10
**Features:**
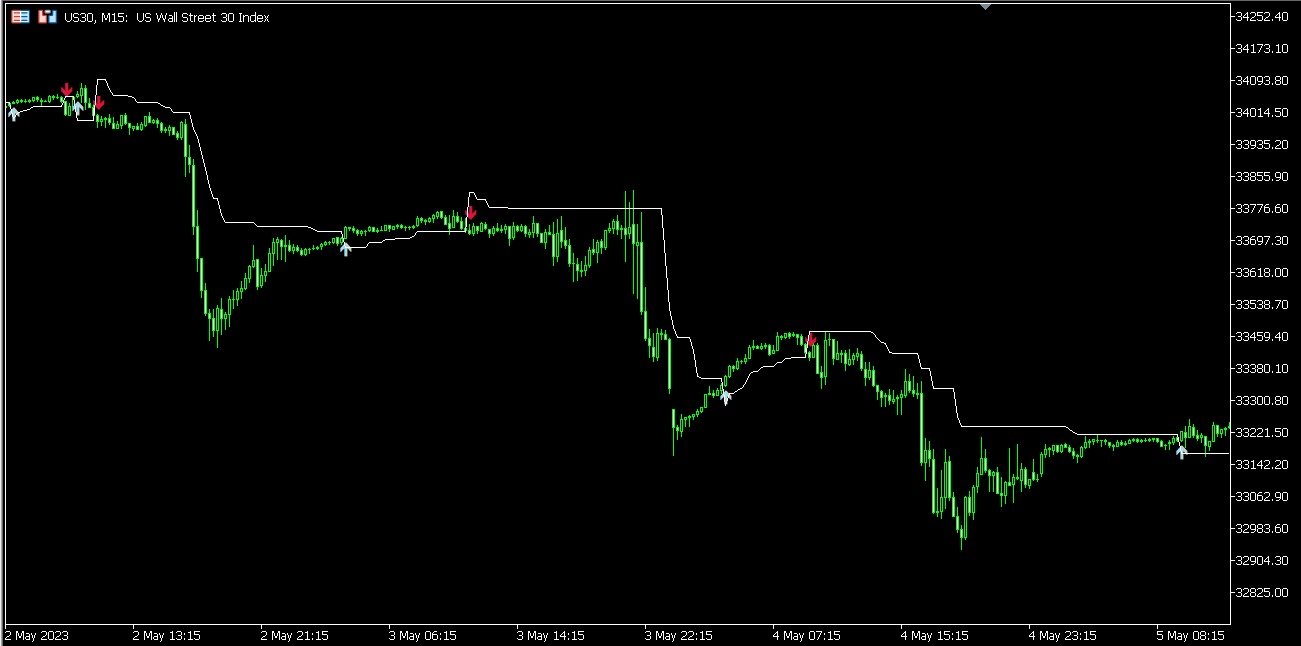
1. **Innovative Trend Tracking:** The UT BOT Simple Indicator leverages the power of the Average True Range (ATR), a renowned volatility measure, to calculate precise trailing stop values, providing unparalleled insights into market trends.
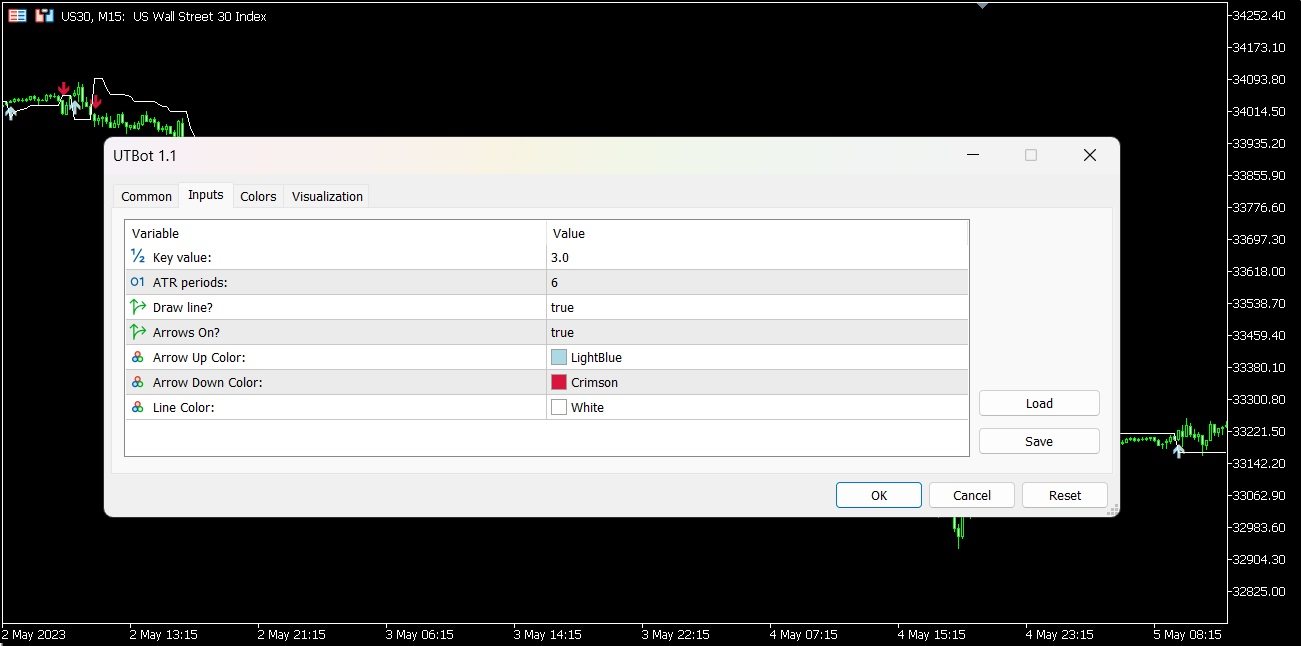
2. **Customizable Settings:** Flexibility is paramount in any trading strategy. With this in mind, our indicator allows you to adjust the ATR periods and other key parameters to tailor the tool to your trading style and strategy.
3. **Real-time Trend Change Alerts:** Stay proactive, not reactive, with our immediate and accurate trend-change notifications. With our tool, you're always ahead of the game, ready to act as soon as the market shifts.
4. **Reliable Performance:** UT BOT Simple Indicator has been rigorously tested and proven to deliver consistent, dependable results, making it a highly valuable addition to any trading toolkit.
5. **ATR Line Visualization:** For added clarity, the indicator allows for the ATR line to be displayed directly on your chart. This enhances your understanding of the market's sensitivity and assists in determining accurate Stop Loss levels tailored to current volatility. Upgrade your trading arsenal with the UT BOT Simple Indicator, and start making more informed and profitable trades today!