Regardez les tutoriels vidéo de Market sur YouTube
Comment acheter un robot de trading ou un indicateur
Exécutez votre EA sur
hébergement virtuel
hébergement virtuel
Test un indicateur/robot de trading avant d'acheter
Vous voulez gagner de l'argent sur Market ?
Comment présenter un produit pour qu'il se vende bien
Expert Advisors et indicateurs gratuits pour MetaTrader 5 - 22

This version is 30 usd
British Fakeout EA is a trading strategy for GBPUSD. Strategy aims to catch fake movements and make a profit from them. For this purpose, it opens lots, these lots can be made with Fixed, Martigale or Equity Based Lot calculation. You can adjust the distance between lots with the GRID DISTANCE option. Live Signal
-Recommended Time Frame: 4H -Currency: GBPUSD -Recommended fixed lots for 1000 USD is 0.02 -Recommended equity lots for 50x leverage = 200 -Recommended equit
FREE

Normal Parabolic SAR with label of long or short state. Tells also "Parabolic long" and "short". Can be used in multitimeframe layouts together with Swiss HolyGrail indicator or in different timeframes. So, if all the indicators show "long" or "short" you can be sure that the risk of a wrong direction is small. The standard values for Parabolic SAR are 0.02 for step and 0.2 for maximum. You may experiment with changing the maximum to get smother curves. Note that changes in parabolic SAR are la
FREE
Э ксперт создан для скальпирования на открытии торгов ММВБ ( начинает работу через несколько секунд после 10=00) и продолжает скальпировать на открытии каждого бара.. Является продолжением продукта Morgen Open https://www.mql5.com/ru/market/product/47596 Эксперту желательно работать на часовом или M30 таймфрейме. Эксперт работает на указанное пользователем целое количество лотов, проверка минимальна, мартингейл не предусмотрен!!!. Эксперт при начале работы выставляет 2 отложенных ордера
FREE

Many traders use Price Action as entry and exit signal. Since the beginning of chart analysis, traders have found several candlestick patterns that can indicate possible "behaviors" of the market. Candlestick Pattern indicator is an indicator for MetaTrader platform that can detect many of these patterns and show them on screen or to alert traders about them. though they detect slightly different sets of candle patterns. Candlestick Pattern indicator also has a more modern look compared
FREE

At first, I got my teeth into Dragon Ultra Expert Advisor. Take your time to test demo. You should be always perfectly familiar with your Expert Advisor before a live trading. Based on the statistics, you are more likely to succeed if you learn from experience to use this. Dragon Lite is a free version for you to understand how the bot works. Parameter Trading Mode: Change to UNLIMITED. You should use the Dragon Training proficiently before using the Dragon Ultra .
The Forex T
FREE

Технический индикатор Trend Moving Average позволяет определить глобальное направление рынка. Данный технический индикатор создан для того, чтобы определить «линию наименьшего сопротивления» рынка и понять в какую сторону направлен тренд. Помимо классического использования МА, индикатор позволяет понять направленность рынка на основе динамики его значений. Так, если значение индикатора демонстрируют переход с нисходящего значения в восходящее (и наоборот) - это является дополнительным торговым с
FREE

This indicator demonstrates the probable dynamic support and resistance levels of EMA, Ichimoku lines, and Key OHLC levels for different timeframes on one chart. This can drastically reduce the time and effort needed for switching between different timeframes.
EMA and Ichimoku Levels are drawn for the M1, M5, M15, M30, H1, H4, and D1 timeframes, and the Key OHLC levels of the last periods are drawn for the H4, D1, W1, and MN1 timeframes.
FREE

Индикатор для синхронизации и позиционировании графиков на одном и более терминалах одновременно. Выполняет ряд часто необходимых при анализе графиков функций: 1. Синхронизация графиков локально - в пределах одного терминала при прокрутке, изменении масштаба, переключении периодов графиков, все графики делают это одновременно. 2. Синхронизация графиков глобально - тоже самое, но на двух и более терминалах, как МТ5, так и МТ4. 3. Позиционирование графика на заданном месте при переключении периодо
FREE

The VPS Sentinel Expert Advisor will be your ally to protect your trading capital and keep you updated of the status of your trading terminal (MT5) running on your remote VPS (Virtual Private Server). With the VPS Sentinel running on your terminal, you will have a first line of defence against any problem that could occur. You will also be able to: Define a Global Stop level (Stop-Out), decide if you want to receive notifications and also enable an automatic closing of working positions an
FREE

This indicator calculates the difference between the SELL aggression and the BUY aggression that occurred in each Candle, plotting the balance of each one graphically. Note: This indicator DOES NOT WORK for Brokers and/or Markets WITHOUT the type of aggression (BUY or SELL).
Be sure to try our Professional version with configurable features and alerts: Delta Agression Volume PRO
Settings
Aggression by volume (Real Volume) or by number of trades (Tick Volume) Start of the Aggression De
FREE

Qstick is a way to objectively quantify candlestick analysis and improve the interpretation of candlestick patterns. Qstick was developed by Tushar Chande and published in his book " The New Technical Trader - Boost Your Profit by Plugging Into the Latest Indicators (1994) ". Qstick is built based on a moving average of the difference between the Open and Close prices. The basis of the idea is that the Opening and Closing prices are the heart of candlestick analysis. We strongly recommend the re
FREE

This simple indicator paints with a darker color on the volume bar when the quantity traded is above the average of select number of periods of the volume itself, highlighting the moments when there was a large volume of deals above the average. It is also possible to use a configuration of four colors where the color tone shows a candle volume strength. The indicator defaults to the simple average of 20 periods, but it is possible to change to other types of averages and periods. If you like
FREE

Indicator developed in order to notify the user when the RSI enters and leaves the overbought and oversold regions, the information is shown in the form of audible and text alerts. Notifications can be disabled at any time. The indicator period can be changed by the user, and it is possible to insert the RSI indicator in the graph through the alerts. Aurélio Machado
FREE
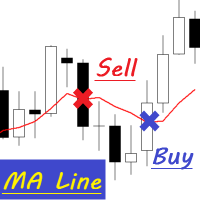
A cross between the candlestick and the moving average line.
MA Line is Expert Advisor which is very simple by working as below: Buy Condition 1. Perivious open candle bellow MA Line 2. Previous close candle above MA Line Sell Condition 1. Perivious open candle above MA Line 2. Previous close candle below MA Line
EA Parameter - Time Filter - Lot - MA Period - MA Method - Stop Loss - Take Profit - Trailing Start - Trailing Step - Trailing Stop - Magic Number
FREE

Visualize seu histórico de negociações de forma estruturada e detalhada, com taxas de acertos e lucro separados por dia, semana, mês e total, além de detalhes sobre o ativo, horário do servidor e posições/ordens em andamento. Este painel foi criado visando o uso em contas do tipo HEDGE, porém pode ser utilizado em contas do tipo NETTING sem nenhum problema. Na versão PREMIUM deste Painel você tem opção de utilizar uma micro boleta com botões para facilitar o tratamento e execução de ordens em an
FREE

Description :
Combination MT5 is a professional indicator based on the Stochastic Oscillator and Average True Range (ATR) technical indicators, thus, you can use it with any currency pair and any timeframe.Trade signals from Combination MT5 are drawn on the main chart in the form of arrows. When a blue arrow appears, then this is a signal to buy, when the red one appears then this is a signal to sell. You can set the alerts on/off. The Stochastic Oscillator and Average True Range (ATR) technic
FREE

This indicator displays Point & Figure charts (PnF charts) in the indicator window. PnF charts show only price movements that are bigger than the specified box size. It helps to eliminate noise and allows focusing on main trends. Time is not a factor here. Only price movements are taken into account. That is why PnF chart is not synchronized with the main chart it is attached to. More about PnF charts: http://stockcharts.com/school/doku.php?id=chart_school:chart_analysis:pnf_charts Indicator wor
FREE

The indicator High Trend Lite monitors 5 symbols in up to 3 timeframes simultaneously and calculates the strength of their signals. The indicator notifies you when a signal is the same in different timeframes. The indicator can do this from just one chart. Therefore, High Trend Lite is a multicurrency and multitimeframe indicator. With the High Trend Pro , available at this link , you will have an unlimited number of symbols, 4 timeframes, a colourful chart of the primary MACD indicator, several
FREE

Introducing our Gold Premia Robot—a cutting-edge, automated system leveraging Bollinger Bands, Ichimoku, and RSI to strategically buy gold on Fridays. Capitalizing on major funds adjusting positions, it minimizes weekend risk for enhanced trading precision and potential returns. Experience market advantage with our innovative algorithm.
– fixed lot to 0.01 – No martingale, no grid – No excessive consumption of CPU resources – timeframe is D1 – User-friendly settings – All settings optimized
FREE
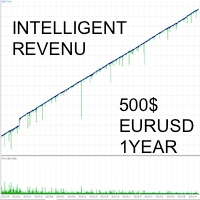
La stratégie INTELLIGENT REVENU est une combinaison d'indicateurs personnalisés et d'un algorithme de Trading très avancé. Il a été testé avec des ticks réels, et a passé avec succès le test de résistance avec glissement se rapprochant des conditions réelles du marché sur une période de 5 ans.
INTELLIGENT REVENU EA EST FAIT POUR CEUX QUI :
- N'ONT PAS DE CONNAISSANCE POUSSER EN TRADING - SOUHAITENT AVOIR UN REVENU PASSIF TOUS LES JOURS - SOUHAITENT VAQUER À D'AUTRES OCCUPATIONS - SOUHAITEN
FREE

The TRIXe Indicator is the combination of the TRIX indicator (Triple Exponential Moving Average) with the addition of an EMA (Exponential Moving Average) signal. It provides signs of trend continuity and the start of a new trend.
The entry and exit points of operations occur when the indicator curves cross.
It performs better when combined with other indicators.
FREE

Highly configurable OBV indicator.
Features: Highly customizable alert functions (at levels, crosses, direction changes via email, push, sound, popup) Multi timeframe ability Color customization (at levels, crosses, direction changes) Linear interpolation and histogram mode options Works on strategy tester in multi timeframe mode (at weekend without ticks also) Adjustable Levels Parameters:
OBV Timeframe: You can set the lower/higher timeframes for OBV. OBV Bar Shift: Y ou can set the offs
FREE

ToolBot Advisor Indicator (RSI, ATR, ADX, OBV) FREE An effective indicator for your negotiations
The toolbot indicator and advisor brings leading (OBV) and lagging (RSI, ATR, ADX) indicators so that you have more security in your negotiations. In addition, it informs you of possible up and down trends as well as providing you with incredible advisors who will give you information about trading opportunities.
With this indicator you will have more security and speed in your decision making
FREE

Analyse de trading précise à portée de main : Logiciel d'analyse de trading de nouvelle génération Les logiciels d'analyse de trading grand public disponibles sur le marché ne fournissent souvent que des statistiques de ratios de profits et pertes horaires ou hebdomadaires, ce qui ne répond pas au besoin d'une analyse de trading plus précise. Cependant, sur le marché réel du trading, chaque jour présente des circonstances uniques. Les lundis sont calmes, les mercredis sont actifs avec un triple
FREE

NOW FREE!!
Introducing RichRush EA, This expert advisor, armed with cutting-edge trading strategies, can assist on your path to navigating the forex market. Optimized specifically for EURUSD, RichRush EA operates on moving averages, and calculated lot sizes to manage risks. The EA interprets market movements, adjusts to volatility, and aims to identify entry points. As part of our commitment to providing top-tier trading tools, we invite you to explore our range of premium products designed t
FREE

Veuillez laisser une note de 5 étoiles si vous aimez cet outil gratuit ! Merci beaucoup :) La collection Expert Advisor « Assistant de gestion des risques » est une suite complète d'outils conçus pour améliorer les stratégies de trading en gérant efficacement les risques dans diverses conditions de marché. Cette collection comprend trois éléments clés : des conseillers experts en matière de moyenne, de commutation et de couverture, chacun offrant des avantages distincts adaptés à différents scé
FREE

ScriptBot is a multi-strategy robot developed to be practical and robust, with ScriptBot you are able to create different strategies of your own, install up to 51 indicators of your liking and build your own trigger using simple logic expressions. AVISO: Versão brasileira: mql5.com/pt/market/product/67311 Below we will tell you a little about the structure: Indicators: ScriptBot does not have indicators in its coding, this means that you have full control of which indicators you want to
FREE
The USDJPY Trader EA is an automated trend following system that is always in the market and trades using sell stop and buy stop orders with trailing stop losses to capture large movements in the market. It also includes a money management feature which calculates lot size based on account size and risk with an option to set a maximum draw down at which the EA will stop trading. This is a long term strategy combined with money management and will work on any pair but works best on USDJPY M15. Vi
FREE

The indicator displays trend slowdown or possible end of trend and price reversal. The indicator has no parameters. When red bars appear and when they become shorter, we can talk about the approaching end of the downtrend. When green bars become shorter, we can expect the approaching end of the uptrend.
FREE

High of the Day and Low of the day Time and Price Fractal Studies is an indicator that will help you identify certain patterns that tend to repeat themseleves at certail times of the day or at certain prices.
It is used to study Daily Highs ad Lows in relation to time and price.
You will get to answer certail questions like:
At what time of day does this market usually turn around. At what price does the market turn. Is it at round numbers etc
FREE

Swiss InsideOutsideBar Imortance of Inside- and Outside Bars Inside bars are completely engulfed by its previous bar. The pattern is also known as "harami" (pregnant). Outsidebars engulf the previous bar. Inside bars might mark situations before an outbreak. They are a condensed form of a symmetrical triangle. Symmetrical triangles represent a battle between bulls and bears. There can be an outbreak to either side, mostly the outbreak is in direction of the main trend. The combination of inside
FREE

Day Points
Indicadtor that shows the points considered important for X days. (Open,Close, High, Low) Used a lot by those who do day trade. These points can be used for decision making by a trader. You will choose the amount of days ago for it to show.
Settings High/Low/Close/Open Show - True/False. Days - Number of days that will show on the chart. Color - Line Color. Style - Line Style.
FREE
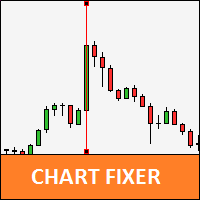
Utility that allows you to set a specific date on the chart. You set a reference point through a vertical line and it is done! When changing timeframes, the reference point is always positioned at the center of the chart. That way you can analyze a specific date at different timeframes easily, without losing the reference point or scrolling the chart to it.
This is a product developed by Renato Fiche Junior and available to all MetaTrader 5 users!
Partners: "Águia Traders" team ( Eagle Trad
FREE

Higher Timeframe Chart Overlay will display higher timeframe candles, including the number of candles high/low you specify.
You no longer need to switch timeframes to check the candles. Everything can be shown in one chart. Get Full Version - https://www.mql5.com/en/market/product/115682 Please feel free Contact me if you have any questions regarding this tool.
FREE

Harness the Power of Donchian Channels for Trend Trading
The Donchian Channel Indicator may your key to precision trading. With Donchian channels, you'll gain insights into market volatility, breakouts, and overbought/oversold conditions. This winning strategy is named after its developer, Richard Donchian.
How Does the Donchian Strategy Work? The upper band represents the previous period's highest high; The lower band represents the previous period's lowest Low; The centre band refle
FREE

This Indicator is based on Mr. Dan Valcu ideas.
Bodies of candles(open-close) are the main component used to indicate and assess trend direction, strength, and reversals.
The indicator measures difference between Heikin Ashi close and open.
Measuring the height of candle bodies leads to extreme values that point to trend slowdowns. Thus quantifies Heikin Ashi to get earlier signals.
I used this indicator on Heiken Ashi charts but, it's possible to choose to calculate Body size based on
FREE

About. This indicator is the combination of 3 Exponential Moving averages, 3,13 and 144. it features Taking trades in the direction of trend, and also helps the trade to spot early trend change through Small moving averages crossing Big Moving averages Product features 1. Have built in Notification system to be set as the user desires (Alerts, Popup notification and Push Notification to Mobile devices) so with notification on, you do not need to be at home, or glued to the computer, only set and
FREE

Daily Monitoring : The indicator automatically calculates and displays the daily drawdown on your trading chart, allowing you to see how well you're performing on a daily basis. Risk Management : By monitoring daily drawdown, traders can better manage their risk. It helps to keep daily losses within acceptable limits. Real-Time Information : Daily drawdown is updated in real-time, providing accurate and up-to-date information about your trading performance. How to Use: Activate the "Daily Drawd
FREE

Trend Fibonacci is a unique indicator that combines a power of Fibonacci sequences and ranges. Channel Group: Click Here
How to read:
- There are three zones --> red, gold and green
- Red candlestick = downtrend
- Green candlestick = uptrend
- Gold candlestick = no established trend
Inputs: Per = number of bars used for calculations FirstRatio = first Fibonacci ratio (Or use any ratio you want) SecondRatio = second Fibonacci ratio (Or use any ratio you want)
!! IF YOU PURCHASE TH
FREE

Simple indicator to calculate fibonacci retracement levels on time. Add to chart and move trend line to set the fibonacci retracement levels. Inputs Levels - levels for which to calculate values, separated by space, default are fibonacci levels Show time - if true, time will be shown on levels Show date - if true, date will be shown on levels Show fibonacci level - if true, value of levels will be shown Fibonacci lines color - color of levels Trend line color - color of trend line which de
FREE
La version de Kali IndicOptimizer pour Metatrader 5. Cet outil n'est pas seulement un Expert Advisor , il sert pour optimiser vos indicateurs, pour concevoir votre propre Expert Advisor, analyser les buffers de vos indicateurs sans avoir accès au code source. J'ai chercher pendant pas mal de temps comment je pouvais optimiser mes indicateurs sans a chaque fois devoir programmer ou modifier un expert. Avec cet outil, tout le monde peut se lancer dans la conception de stratégie ou même avoir son
FREE

DONCHIAN CHANNEL DC Il s'agit d'un indicateur de tendance développé par “Richard Donchian”, composé de 3 couches, le canal supérieur, le canal inférieur et le canal intermédiaire. Il est créé sur le canal Donchian en traçant les prix les plus élevés et les plus bas atteints au cours de la période précédente sur le graphique des prix. Il est également utilisé pour mesurer la volatilité du marché, car il s'agit d'un canal d'expansion/contraction en fonction de l'augmentation/diminution de la volat
FREE

This is a simple tool to display the maximum lot size permitted for any asset based on the size of your account (or more accurately the free margin), and the leverage. It will display the max lot size allowed, and then the script will naturally exit after 3 seconds which gives you enough time to see the information. When you have an active position, it will calculate the maximum number of lots that are left while a position of a certain lot size is already running. Before the script terminat
FREE

Es un indicador que no se repinta y que muestra la tendencia a corto plazo. contiene lo siguiente: Visual Mode MA Period MA Method MA Price
ATR Period Volatility Factor Offset Factor Use Break Use Envelopes Use Alert
cualquier sugerencia hagamelo saber en los comentarios y también colocar estrellas para postear más contenido, indicadores y advisor actualizadas
FREE

Versión Beta El indicador técnico Non Lag MA MTF (Non-Lagged Moving Average Multi-Time Frame) es una versión avanzada del Non Lag MA que permite visualizar la media móvil en varios marcos temporales simultáneamente. Pros: - Visión integral: Proporciona una visión más completa al mostrar la media móvil en diferentes marcos temporales en un solo gráfico. - Anticipación de tendencias: Ayuda a anticipar cambios de tendencia al observar la convergencia o divergencia de las medias móviles en distint
FREE
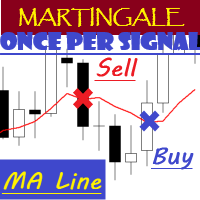
EA "MA Line" with martingale feature
EA will open position once per signal
To see how EA works, please watch the video below. In the video, I perform parameter optimization and do a backtest. The parameters that are optimized are: - MA Period - Stop Loss - Take Profit
For the future, I will try to optimize and test EA, especially the expert advisors in the mql5 community. hopefully it can be useful for colleagues in the mql5 community.
FREE

Necessary for traders: tools and indicators Waves automatically calculate indicators, channel trend trading Perfect trend-wave automatic calculation channel calculation , MT4 Perfect trend-wave automatic calculation channel calculation , MT5 Local Trading copying Easy And Fast Copy , MT4 Easy And Fast Copy , MT5 Local Trading copying For DEMO Easy And Fast Copy , MT4 DEMO Easy And Fast Copy , MT5 DEMO
Can set the cycle for other varieties of K line graph covered this window, fluctuations obse
FREE

(Grafici di criptovaluta)
Salva tutti i simboli di Binance Future in simboli personalizzati.
Aggiunge il prefisso "F" ai simboli in Binance Future.
Crea l'infrastruttura in cui è possibile seguire i simboli in Binance Future.
Dovresti consentire WebRequest dal menu Strumenti >> Opzioni >> Consulenti esperti e aggiungere l'URL: https://fapi.binance.com
basta fare doppio clic sullo script.
Hai l'intera lista in pochi secondi.
vedere il prodotto nel link https://www.mql5.com/en/m
FREE

ScriptBot é um robô multi estratégia desenvolvido para ser prático e robusto, com o ScriptBot você é capaz de criar diferentes estratégias próprias, instale até 51 indicadores do seu gosto e monte o seu próprio gatilho utilizando uma expressões lógica simples.
WARN: English version: mql5.com/en/market/product/67941 Abaixo contaremos um pouco sobre a estrutura: Indicadores: ScriptBot não possui indicadores na sua codificação, isso significa que você tem total controle de quais indicadores
FREE

ForexBob Candle Timer Is an amazing countdown time indicator which shows the time remaining for next candle to open. It can be used on any timeframe. It helps to plan your next trading action.
Inputs are simple Color - To change the color of displaying time. Size - To set the size of font Next for settings are used to set the location of time Font - To change the font type.
Please check my other products here https://www.mql5.com/en/market/my
FREE

Explorer les limites du marché et saisir chaque opportunité est l'essence de la stratégie ZenithNadir Blueprint. ZenithNadir Blueprint est une stratégie de trading unique, spécialement conçue pour les investisseurs courageux qui cherchent des opportunités au plus bas niveau du marché et qui se retirent résolument lorsque le marché est au plus bas. Inspirée de la stratégie classique de martingale, elle vise à maximiser le rendement des investissements grâce à des méthodes d'entrée et de sortie s
FREE
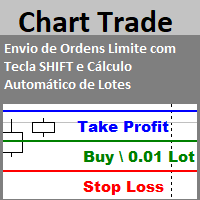
Envio de Ordens Limite com Tecla SHIFT (Cálculo Automático de Lotes) Funcionalidades: Definição de Níveis: Estabeleça os níveis de Stop Loss, Take Profit e o preço da ordem utilizando a tecla SHIFT e cliques do mouse. Cálculo Automático de Lotes: Os lotes são calculados automaticamente com base no risco da conta.(A opção também para usar volume fixo) Gerenciamento de Posições: Botão para fechar todas as posições abertas enviadas pelo EA. Botão para cancelar todas as ordens pendentes enviadas pe
FREE

The Martinware Manual Trading Helper indicator is aimed at helping people start their lives in manual trading. It can be used to display both some generic images at the right side of the graph, where custom operational remarks may be displayed or just a blank rectangle hiding the chart while backtesting. Moreover, it can periodically play a list of sounds. To show a blank rectangle, let the first image name input field empty and select the desired color. To show one or more custom images inste
FREE

BreakdownX — это передовой торговый робот для MT5. Он использует стратегию определения уровней поддержки и сопротивления, чтобы выявлять оптимальные точки входа и выхода на рынке. Особенности: Автоматизированная Стратегия Определения Уровней : Наш советник анализирует рынок, используя [заданное число] последних свечей, чтобы точно определить уровни поддержки и сопротивления. Динамический Расчет Размера Позиции : Встроенный механизм оптимизации размера лота на основе текущего баланса и уровня рис
FREE

Indicator alerts for Dual Relative strength index rsi. Large rsi preset at 14 is below 30 small rsi preset at 4 is below 10 for buy bullish signals .
Large rsi preset are 14 is above 70 small rsi preset at 4 is above 90 for sell bearish signals . Includes mobile and terminal alerts. draws lines when alerts.
This indicator can help identify extremes and then the tops or bottoms of those extremes .
FREE

It so happened that it is no longer necessary to write about the principles of operation of indicators of this type. The presented indicator redraws the trend direction until it changes to the opposite. whether this is right or not is up to you to judge. It works well together with SM trend Cloud, which is implemented in the SMak ZigZag EA and Pyramid EA Expert Advisor code. When these two indicators work together, it is possible to determine the further trend movement with a high degree of pr
FREE

Preferred pair for USDCAD trading
Conditions for purchases of the trading system "Ozy_M15":
1) The price is above the moving average SMA 48. 2) Price correction starts down, but the moving average within this correction should not be crossed by the candle body. 3) At the same time, the correction itself should be at least as deep as the bottom line of the Ozymandias indicator. 4) After this, as soon as the closing price of the next candle is higher than the upper line of the Ozymandias indic
FREE

Main: Not martingale, not a grid; Working on all symbols;
Signals: There is a good rational algorithm. Work of two indicators: Envelopes and Moving Average (you can set a separate Timeframe for each indicator)
Stop Loss/Take Profit: There is a good money management system (there are several type for trailing stop loss); There is virtual levels of Stop Loss / Take Profit; There is smart lot (percent by risk) or fix lot
Important: EA can work on closed candles, and on current candles; Quick
FREE

Что такое CCI индикатор? Стандартный Индикатор CCI (Commodity Channel Index) – это осциллятор, который измеряет силу, стоящую за тем или иным движением цены. Он помогает определить, кто находятся у руля: быки или медведи. Как и многие осцилляторы импульса, CCI работает, сравнивая текущую цену с предыдущими показателями, и на основе этого сравнения он решает, насколько сильное движение цены вверх/вниз.
Как рассчитать CCI? Метод расчета стандартного индикатора представляет собой оригинальн
FREE

Auto Levels is a technical analysis indicator designed to automatically identify and draw support and resistance levels on price charts. The robot is capable of automatically identifying support and resistance levels based on historical price patterns, eliminating the need for manual analysis. You can set the maximum number of lines that the indicator plots as a parameter
FREE

TG Ponto de Cobertura (Coverage Trade)
This Indicator checks your trading results on the day relative to the asset on the chart and adds a line at the price corresponding to the coverage point for the open position, considering the entry price and lot size. The coverage point will be recalculated after new entries, based on the average price of the open operation and the lot size.
If the result for the day is zero, a line will be displayed at the price of the current trade.
If the day's r
FREE

Unlock the power of trend analysis with the Candle Trend Bars Indicator – your go-to tool for identifying and understanding market trends like never before. This innovative indicator transforms traditional candlestick charts into a dynamic and visually intuitive representation of market trends. Key Features: Trend Clarity: Gain a clear and concise view of market trends with color-coded bars that instantly convey the direction of price movements. User-Friendly Design: The indicator is designed wi
FREE

The Point-Percent Price Channel (PPPC or PP Price Channel) indicator is designed to display on the chart a channel whose width is specified both as a percentage of the current price and in points. Its appearance is presented on slide 1. When the market moves up, the upper border of the channel is built at the price of High candles. In this case, the lower boundary follows the upper one at a strictly specified distance. When the price touches the lower border of the channe
FREE

The Supertrend indicator is a very versatile and and accurate trend detection system. It can also be used an an reversal indicator. Therefor you can use it either as entry or as an exit signal. Depending on your settings it is also good for trend confirmation. This version is slightly enhanced from the original version from mladen. The Supertrend of Averages Histogram Version contains: 11 different price options Averaging period
18 different averaging types ATR period and ATR multiplier Shows r
FREE

This is addition of Effective SV squeeze momentum that add bolliger band and Keltner channel to chart window. Squeeze momentum introduced by “John Carter”, the squeeze indicator for MT5 represents a volatility-based tool. Regardless, we can also consider the squeeze indicator as a momentum indicator, as many traders use it to identify the direction and strength of price moves. In fact, the Tradingview squeeze indicator shows when a financial instrument is willing to change from a trending ma
FREE

As a seller, I have a unique Expert Advisor on the MQL5 Market which I would like to offer. Even though I cannot guarantee success with this product, I can assure that it works and that it will help the consumer pass their Prop Firm challenges. It can be successfully used with 1H time frame and on the GBPCHF currency pairs but it can also be applied to other symbols and time frames.
Moreover, I am offering a free risk management EA as an GIFT with this expert advisor. It will help users detec
FREE

BOT SMILES EA IS MADE OUT OF LOVE AND EMPOWERMENT. ONLY FOR FEW BUYERS THAT IS THE REASON OF THE PRICE . BOT SMILES EA is an aggressive multi-cycle scalper designed for EURUSD M1 . Each cycle is independent. it uses a sequence of orders and has its own TP and SL . It uses a martingale system.
This EA is using strong recurrences of the past to take position and achieve a high success rate . MODELLING :- 1 minute OHLC
INPUTS:- Buy default........... Check Drawdown Then BUY
FREE

The most sensitive indicator you've ever seen . . .
POscillator is a sensitive indicator to find each trend direction change in every timeframe. It shows price variations and reveals up or down trends. POscillator makes a price curve based on frequency filters. The procedure makes two price functions by using high-frequency and low-frequency filters separately. Then it adds them together to create a smoothed price curve. The final stage of the indicator converts this smoothed curve to an osci
FREE

Volume Projection Indicator The Volume Projection Indicator is a specialized tool designed for traders who focus on the relationship between volume and price action. This intuitive indicator projects the expected volume for the ongoing candle, aiding in decision-making during live market conditions. The indicator presents volume data in a histogram format directly on the chart for quick analysis. Features: Bullish Volume Representation : Each green bar in the histogram signifies the volume for a
FREE

This indicator is a volume indicator it changes the color of the candles according to a certain number of ticks, and this number of ticks can be informed by the user both the number of ticks and the color of the candles, this indicator works in any graphical time or any asset, provided that the asset has a ticker number to be informed.
This indicator seeks to facilitate user viewing when analyzing candles with a certain number of ticks.
FREE
Savez-vous pourquoi MetaTrader Market est le meilleur endroit pour vendre des stratégies de trading et des indicateurs techniques ? Pas besoin de publicité ou de protection logicielle, pas de problèmes de paiement. Tout est fourni dans le MetaTrader Market.
Vous manquez des opportunités de trading :
- Applications de trading gratuites
- Plus de 8 000 signaux à copier
- Actualités économiques pour explorer les marchés financiers
Inscription
Se connecter
Si vous n'avez pas de compte, veuillez vous inscrire
Autorisez l'utilisation de cookies pour vous connecter au site Web MQL5.com.
Veuillez activer les paramètres nécessaires dans votre navigateur, sinon vous ne pourrez pas vous connecter.