Tâche terminée
Spécifications
Target Indicator Using Sell Example of NZDUSD today on Daily Chart to plot Table Targets on the chart including parameters to
- Adjust location
- Font size and colour
- Protection in form of account number (optional) and expiry date.
- Must work for buy and sell
- Must work on all pairs including Yen pairs
- Need only calculate pips and not points so with say AUDUSD needs only be 4 decimals
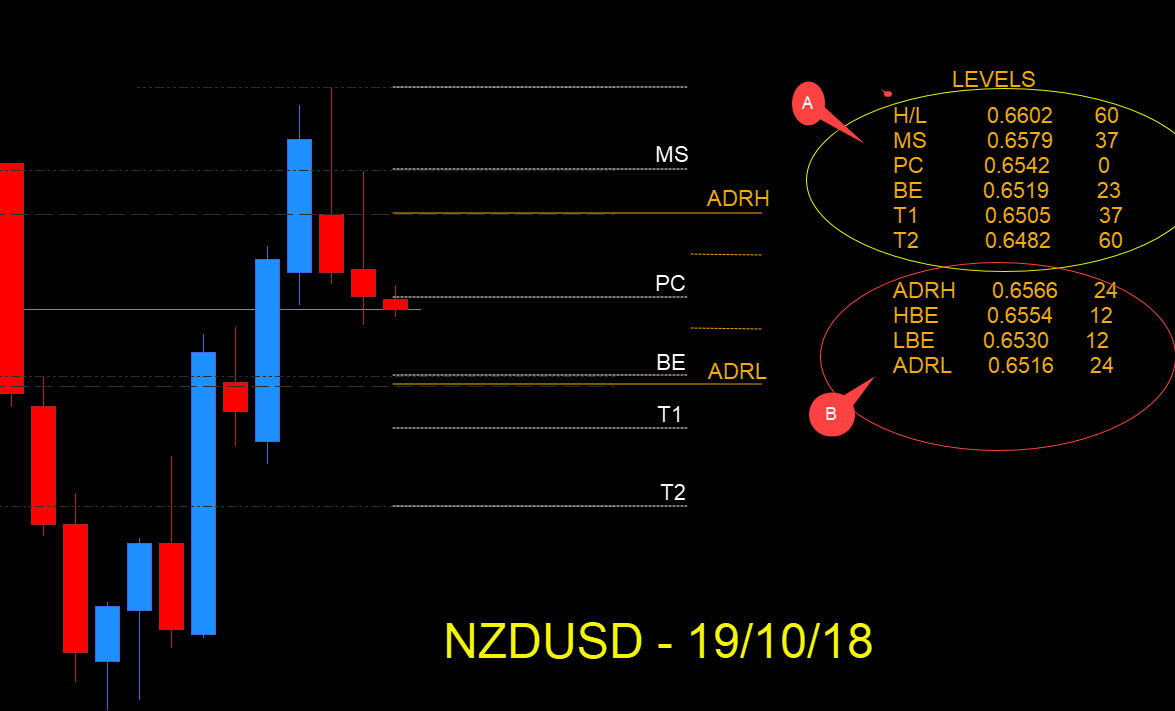
Known levels
· SH/L is “Swing High/Low” === 0.6602 must manually be put indicator as a parameter
· PC is Previous Day (bar) Close === 0.6542 Indicator should be able to read that
Calculate levels Part 1
· MS (level) = SH-((SH-PC)/0.382)*14.6% ===== 0.6602-((0.6602-0.6542)/0.382)*0.146=0.6579
· BE (level) = SH-((SH-PC)/0.382)*14.6% ===== 0.6602-((0.6602-0.6542)/0.382)*0.528=0.6519
· T1 (level) = SH-((SH-PC)/0.382)*14.6% ===== 0.6602-((0.6602-0.6542)/0.382)*0.618=0.6505
· T2(level) = SH-((SH-PC)/0.382)*14.6% ===== 0.6602-((0.6602-0.6542)/0.382)*0.764=0.6482
· Actual pips should addition/subtraction from PC
So parameters in indicator for Part 1 need to be
1. SH price
2. MS multiplier (in example) 0.146
3. BE multiplier (in example) 0.528
4. T1 multiplier (in example) 0.618
5. T2 multiplier (in example) 0.764
6. PC which is previous bar close indicator should know automatically
Calculate levels Part 2 Using Average Daily Range
In example using 10 ADR ( Combined Range of previous 10 days/10) = 48
· ADRH (pips) = ADR (10)/2 = 24
· ADRL (pips) = ADR (10)/2 = 24
· HBE (pips) = (ADR (10)/2)*0.5 = 12 where 0.5 is the multiplier
· LBE (pips) = (ADR (10)/2)*0.5 = 12 where 0.5 is the multiplier
· The price levels then should be able to calculated BUT MUST BE FROM PC (Previous Day/bar Close)
So additional parameters in indicator need to be
1. ADR (days)
2. HBE/LBE multiplier
If it is possible to plot lines on the chart that would be terrific
Thanks