Tâche terminée
Spécifications
I would like to build an indicator that will give me a signal based on the other 3 indicators which I will provide.
The indicator must work on all time frames.
I would like this indicator be named “F C”.
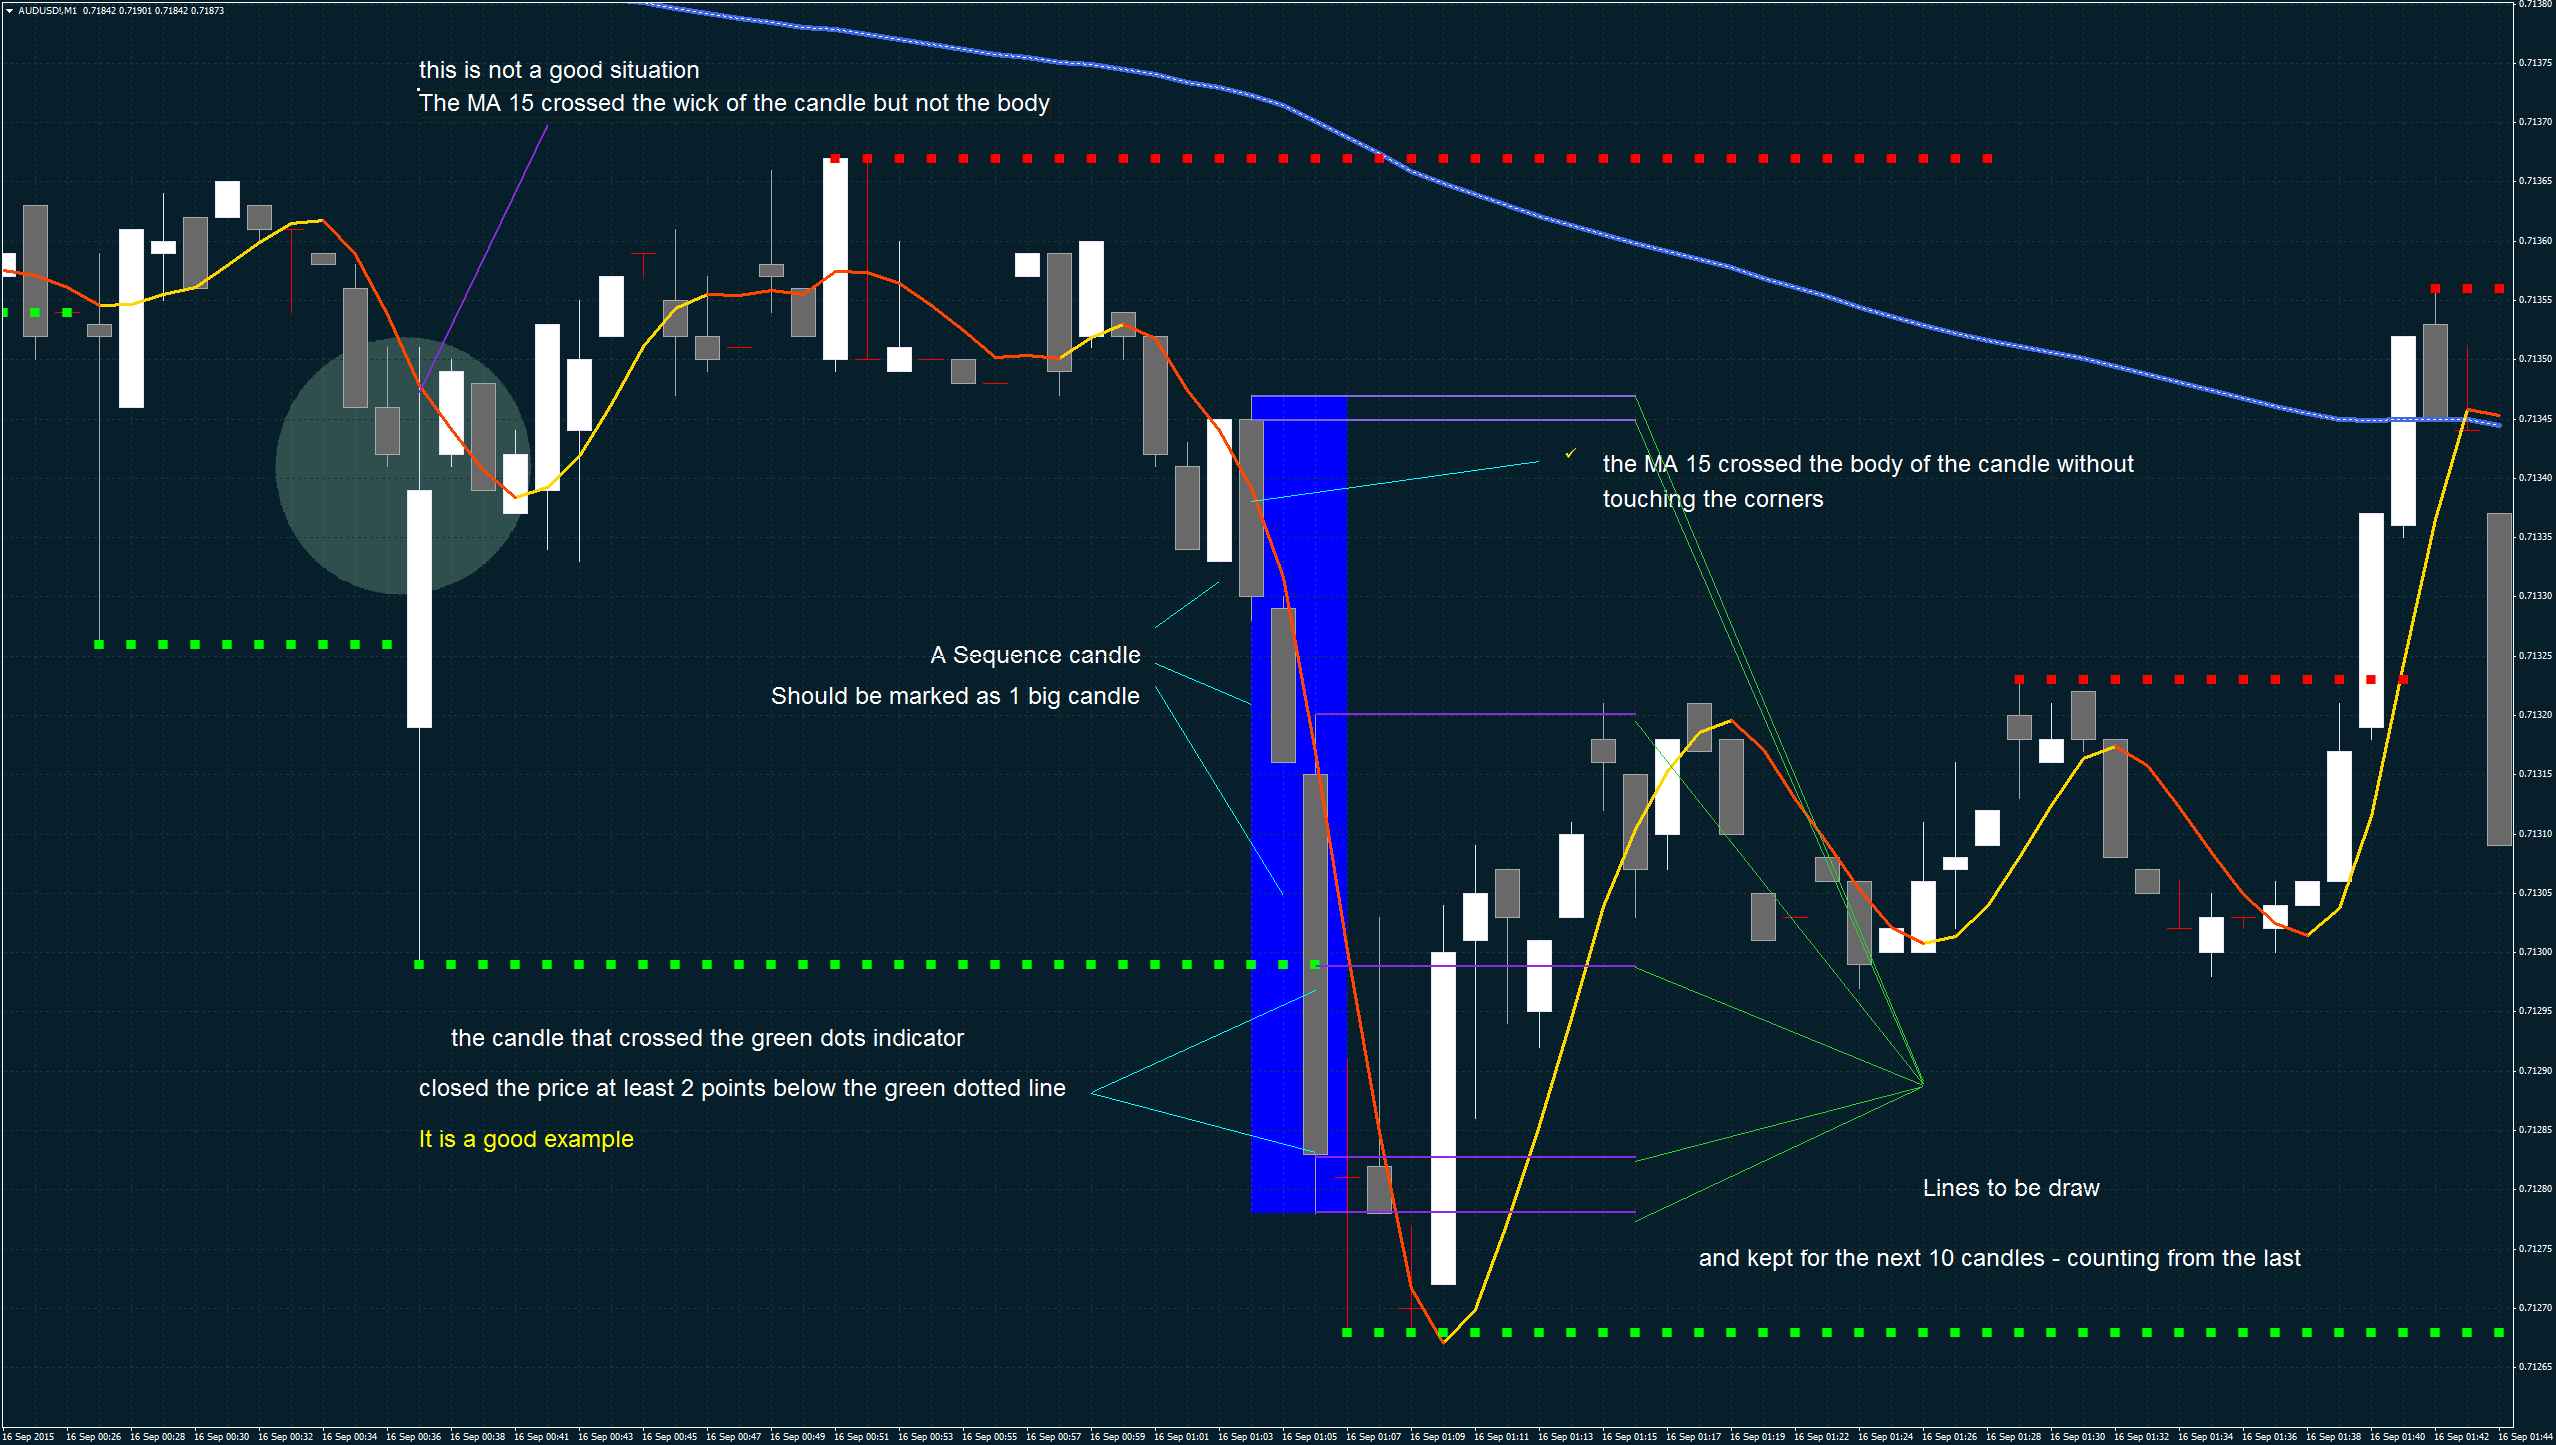
This indicator should mark one or a sequence of the same color candles when it / they break my indicator - support and resistance.
Indicator will have to mark only candle or a sequence of candles with a color box (option to choose color) that Break Green lines (support resistance indicator) only when the action takes place below Moving Average.
Indicator will have to mark only candle or a sequence of candles with a different color box (option to choose color) that Break Red lines (support resistance indicator) only when the action takes place above MA.
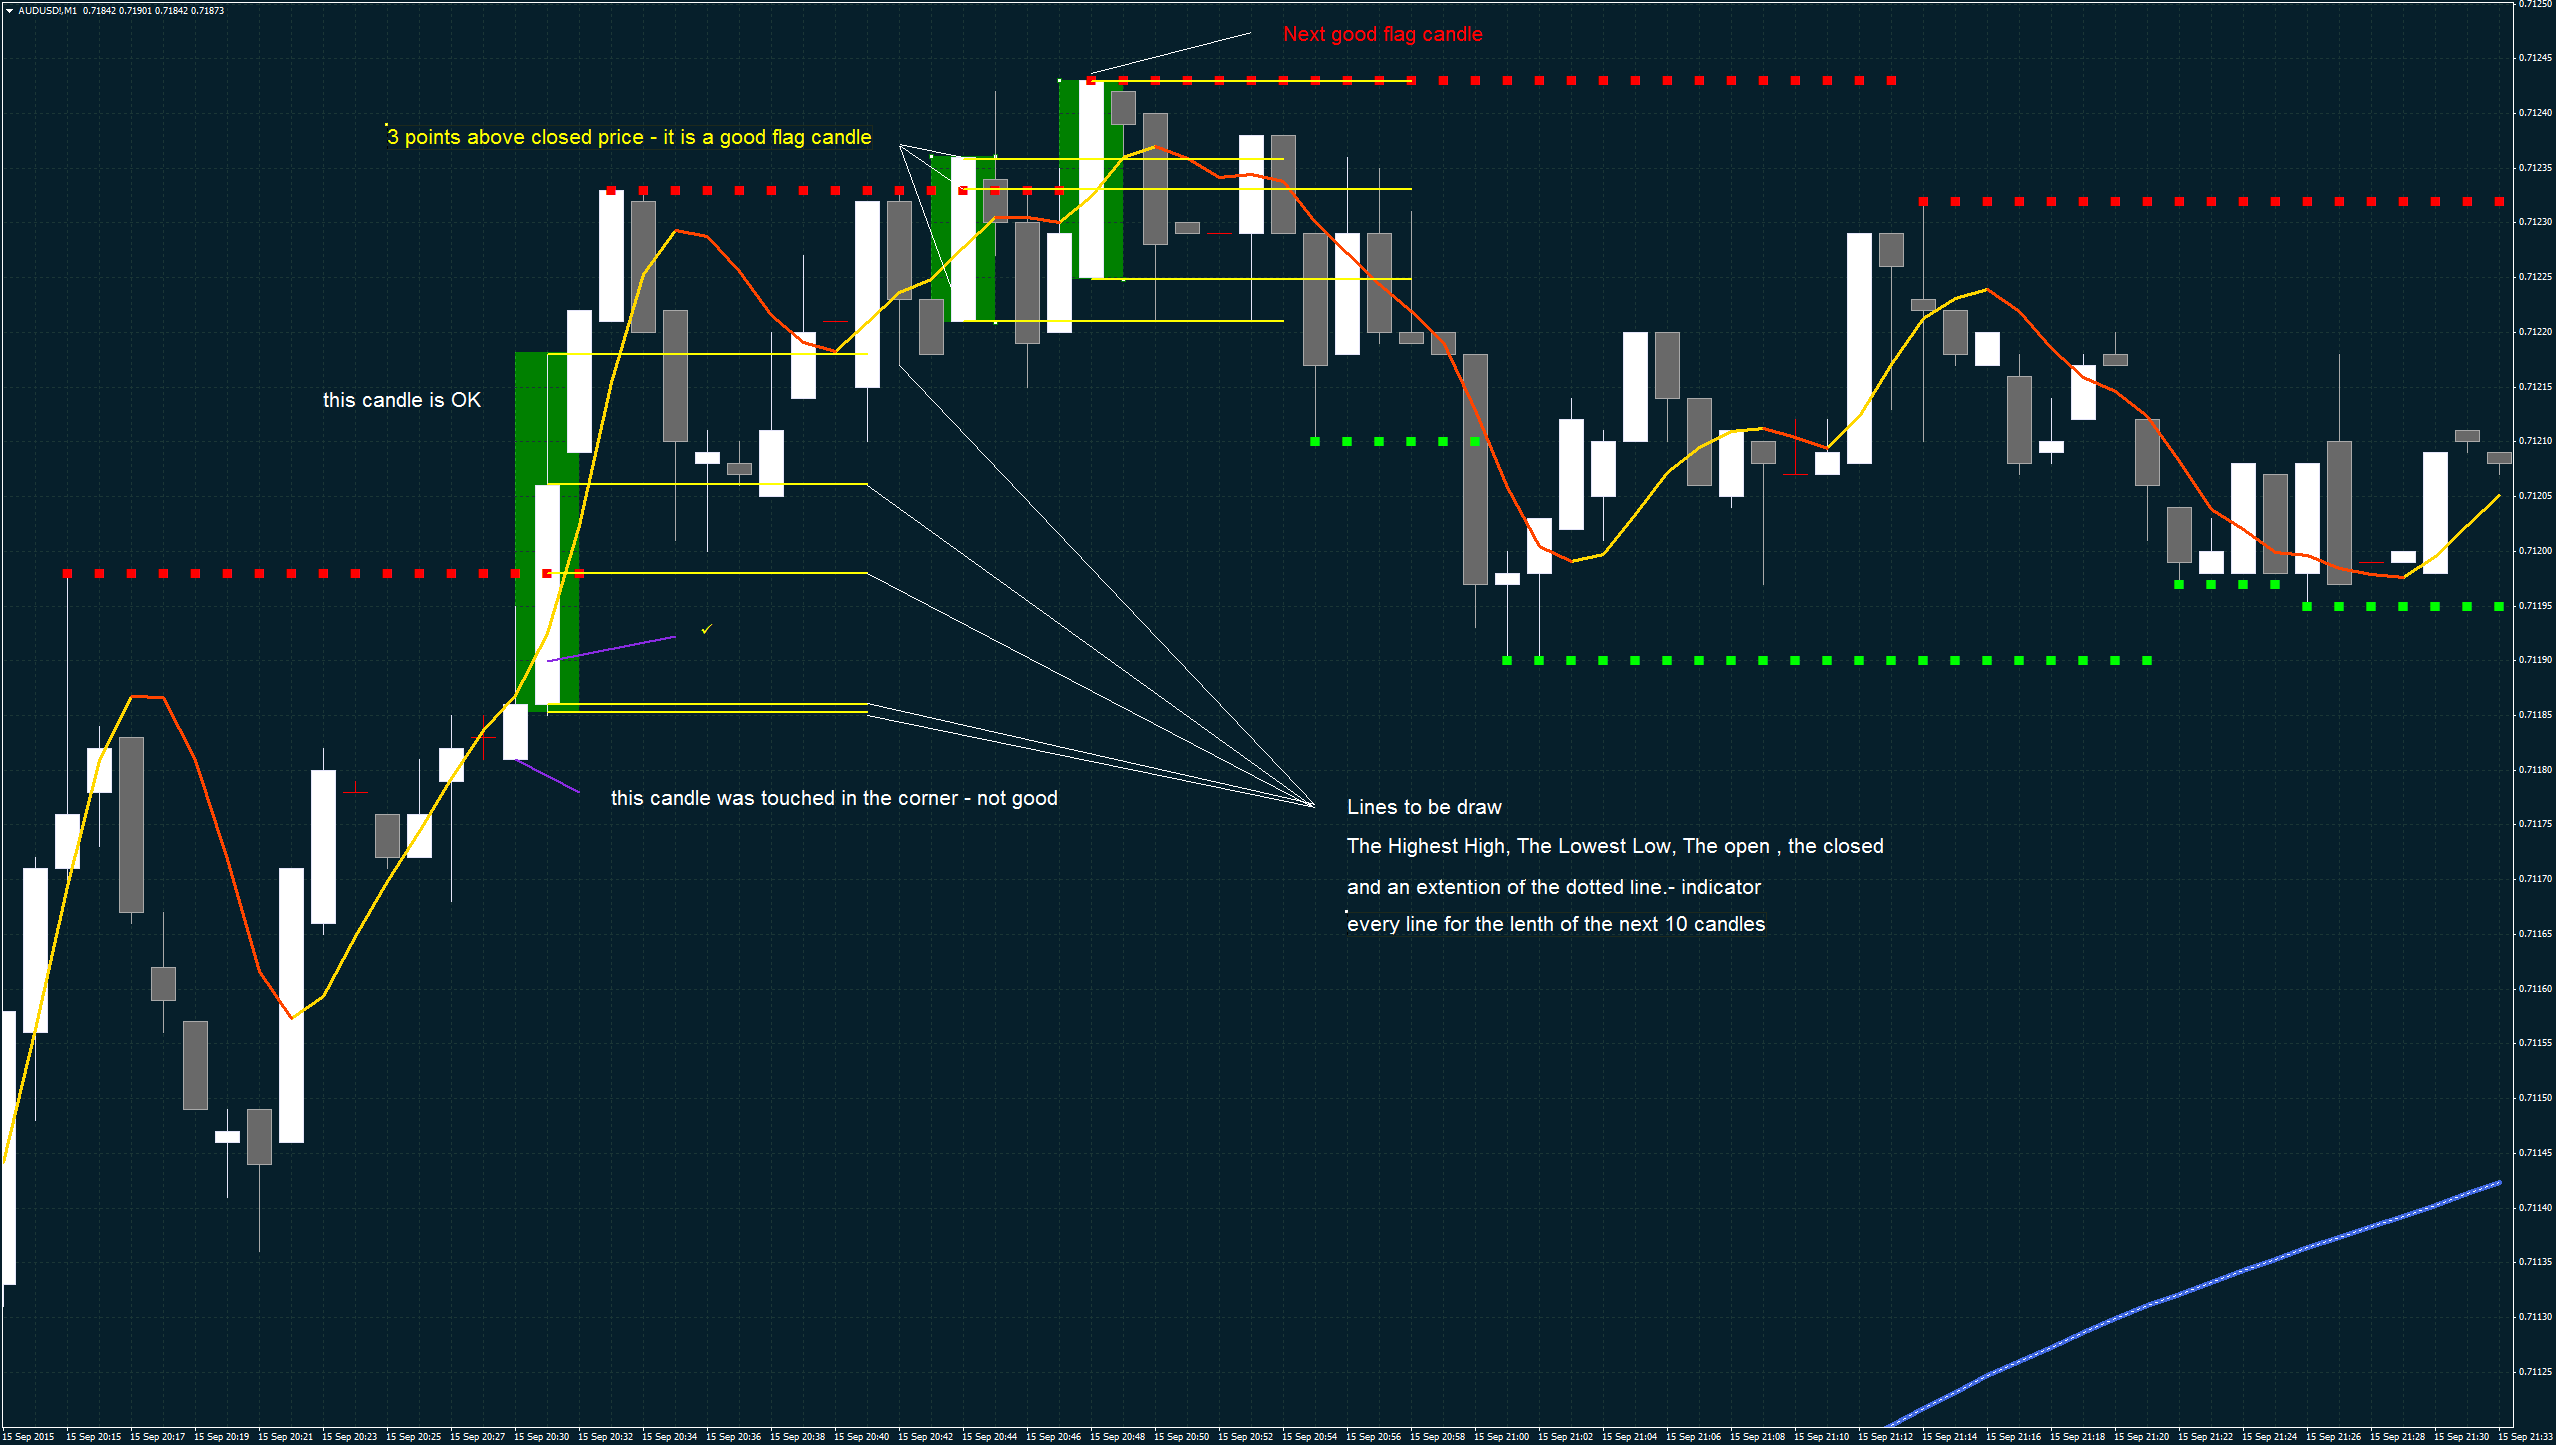
The candle or a sequence of candles must cross 1st - MA and the Moving Average cannot touch any corner of the crossed candle. Please look at the attached pictures.
The candle must break the green or red line -and the candle must close at least 2 point (0.2 pip) above or below that indicator (Green or Red lines). Please add to the menu option to change the value in points (not in pips) For example - I would like to change the value to 1 point or 15 points.
The F C indicator should mark the candle or candles with a box, different color, (option to choose) and draw a few lines.
When there is only 1 candle that was first crossed by the MA and then the candle crossed the Green or Red lines (support and resistance indicator) , a few lines should be draw and kept for the next 10 candles to the right side. Please add in the menu an option to change the number of candles to the right.
The lines should indicate and be on the levels of: the open price, closed price, highest high, lowest low and an extension of the dotted line.
If there is a sequence of candles the lines should be draw as one big candle. The open price, closed price, highest high, lowest low and an extension of the dotted line also kept for the next 10 candles.
When the candle or a sequence of candles crosses “the support and resistance indicator” (green or red dots) and the price of the candle that crossed that indicator did not close yet, the indicator F C should mark the candle or candles immediately with the color box and send a pop up alert with a message (possible F C) {Before the candle will close}
BUT if it happens that the candle that is supposed to cross “the support resistance indicator” was a pin candle or doji, and has only pierced “the dotted line” and did not close below / above at least 2 points = 0.2 pip, the marked box should disappear when the price of that candle closes.
BUT when the price of that Flag Candle is closed, as I suggested - at least 2 points (0.2 pip), the lines should be added immediately (the open price, closed price, highest high and lowest low and an extension of the dotted line).
The F C indicator - should have an alert option – True False by a pop up and / or an alert signal - True False.
Regarding the lines: color and size, please make an option in the menu that I can choose from.
The indicator must work on the Strategy Tester – for Indicators in MT4.
More pictures and indicators to the selected programmer.