MR Sentiments by volumes 4
- Indicadores
- Sergey Khramchenkov
- Versión: 1.4
- Actualizado: 19 abril 2023
- Activaciones: 20
"Sentiments of traders" in the financial markets is a topic that has been of interest to us for a long time. In time, we could not find the right formula to define these sentiments. We went through many stages in the search for the right methodology - from taking data from external sources to calculate open positions of buyers and sellers to calculating tick volumes, but still we were not satisfied with the results. The calculation of open positions of buyers and sellers from external sources had several problems - it was a sample of the registered traders in the external source, this sample could not be tracked over time and tested, although the external source was highly rated, there was no clarity how they process the data they provide. On the other hand, the calculation of tick volumes takes a lot of resources and the methodology of the calculation has many controversial moments. Over the course of a year, all of our losses were concentrated in the ranges. We knew that 90% of the time financial markets are in a "Range". We had to create our own indicator ("MR-Range Breakouts") to show our understanding of the ranges and the volumes in them. We were able to cut our losses but we wanted more and more. In the end, we wanted an indicator that would show "Sentiments of traders" in the areas that were problematic for us. We wanted to know in which direction the range will end and the new impulse movement of the price will begin. We thought our wish was "Mission Impossible"!!!
A year ago we came across a wonderful explanation and example for volumes in financial markets...
"
Example of Volume of Trade - https://www.investopedia.com/terms/v/volumeoftrade.asp
Suppose a market consists of two traders, trader 1 and trader 2. The first trader buys 500 shares of stock ABC and sells 250 shares of XYZ. The other trader sells those 500 shares and buys the 250 shares of stock XYZ to the first trader. The total volume of trade in the market is 750 (500 shares of ABC +250 XYZ shares). This is because we do not double-count the volume - when trader 1 buys 500 ABC shares from trader 2, only 500 shares are counted. Likewise, only 250 shares of XYZ would be recorded on the volume tally.
"
This was enough to realize that the volumes in a bars indicate the intentions in fact - of sellers or buyers. The sum of these volumes for a certain section of the chart of a financial instrument can largely satisfy our need to understand which of these two groups of market participants have the upper hand at a given moment. Of course, we immediately thought of the classic indicator "On Balance Volume" (OBV in short) indicator. The indicator was developed by Joe Granville in the 1960s and was a revolutionary indicator in those days, and today many professional traders in the financial markets use this indicator for analysis and trading. We studied its calculation formula in detail and found that there are a few points that need to be corrected, but this indicator could be a very good basis for our indicator.
All of this was adjusted in our formula for calculating the imbalance between buyers and sellers. In this way, the "MR Sentiments by volumes" indicator is an upgrade of the classic "On Balance Volume" indicator.
What advantages our indicator gives:
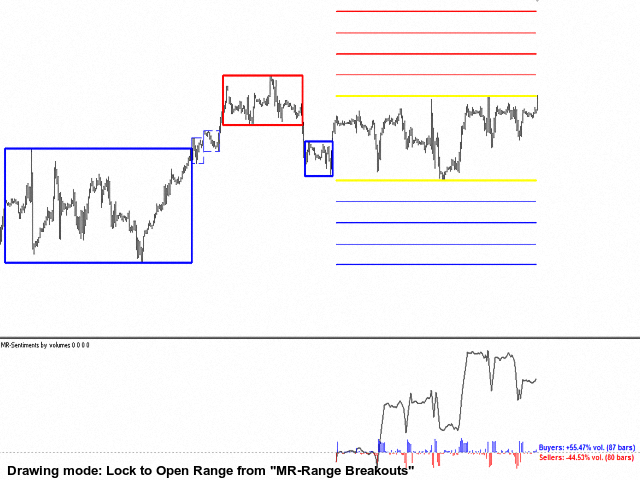
Show to "Expansion" of the Open Range - Shows the imbalance of volumes for "Expansion" of sellers or buyers, if the indicator "MR Range Breakouts" is loaded on the screen. This option works for all selection types of the indicator drawing modes.
Time Frame from "MR-Range Breakouts" - Here you need to specify what time frame you are using in the "MR Range Breakouts" indicator. By default it is "H4". If you use another time frame in the "MR Range Breakouts" indicator and do not specify it here, then the imbalance of volumes for the "Open Range" and "Expansion" will not be displayed.
Section "Visual Settings"
Color of Control Line(s) - You can choose a color for the control line(s).
Line style - You can select the drawing style for the control line(s).
Line width - You can select the drawing width for the control line(s).
Line(s) color of the Imbalance Volumes - You can choose the color of the imbalance of volumes line(s).
Color of Buyers Volumes - You can choose the color of the buyers volumes in the histogram.
Color of Sellers Volumes - You can choose the color of the sellers volumes in the histogram.
Section "Volume Data Text Settings"
Show Volumes Data information - Show or not show the text of information about the imbalance volumes.
Direction to show the information - You can choose on which side of the histogram to display text with information about the imbalance of buyers and sellers. Since the place for displaying the information is limited on the right, when there is also "Expansion" the information is displayed in an abbreviated form.
Text color of Buyers Volumes - You can choose the color of the text for buyers.
Text color of Sellers Volumes - You can choose the color of the text for sellers.
Points in 1 Pip - You can choose the number of Points in 1 Pip.
Volume Data Text position in Pips - You can choose the position in pips for displaying data text.
Volume Data Text font size - You can choose the data text size.
A year ago we came across a wonderful explanation and example for volumes in financial markets...
"
Example of Volume of Trade - https://www.investopedia.com/terms/v/volumeoftrade.asp
Suppose a market consists of two traders, trader 1 and trader 2. The first trader buys 500 shares of stock ABC and sells 250 shares of XYZ. The other trader sells those 500 shares and buys the 250 shares of stock XYZ to the first trader. The total volume of trade in the market is 750 (500 shares of ABC +250 XYZ shares). This is because we do not double-count the volume - when trader 1 buys 500 ABC shares from trader 2, only 500 shares are counted. Likewise, only 250 shares of XYZ would be recorded on the volume tally.
"
This was enough to realize that the volumes in a bars indicate the intentions in fact - of sellers or buyers. The sum of these volumes for a certain section of the chart of a financial instrument can largely satisfy our need to understand which of these two groups of market participants have the upper hand at a given moment. Of course, we immediately thought of the classic indicator "On Balance Volume" (OBV in short) indicator. The indicator was developed by Joe Granville in the 1960s and was a revolutionary indicator in those days, and today many professional traders in the financial markets use this indicator for analysis and trading. We studied its calculation formula in detail and found that there are a few points that need to be corrected, but this indicator could be a very good basis for our indicator.
1. The "On Balance Volume" indicator is calculated for all bars available on the chart of the financial instrument. This means that towards the last bar of the chart, we have an accumulation of data that is well above or below the zero from which the indicator calculation starts. This skews the imbalance data between buyers and sellers to the most recent and current bar on the chart.
2. When there is a "Gap", the volumes of the next bar are added to the volumes of the previous bar. This way, it does not matter whether the bar belongs to sellers or buyers.
3. When the "Open" price is equal to the "Close" price, the volumes in the bar are not added. Since the indicator was created in the 1960s and Japanese candlesticks were rediscovered in the 1980s, we had to make adjustments to our formula for calculating the indicator to account for the meaning of the "Doji" candles and their meaning in "Price Actions" method of analysis.
All of this was adjusted in our formula for calculating the imbalance between buyers and sellers. In this way, the "MR Sentiments by volumes" indicator is an upgrade of the classic "On Balance Volume" indicator.
What advantages our indicator gives:
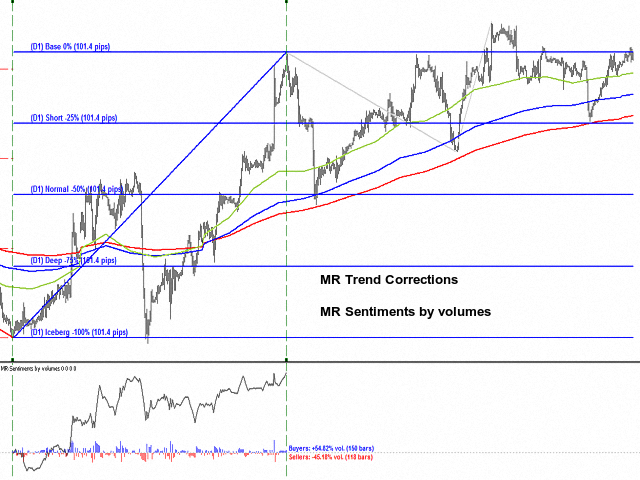
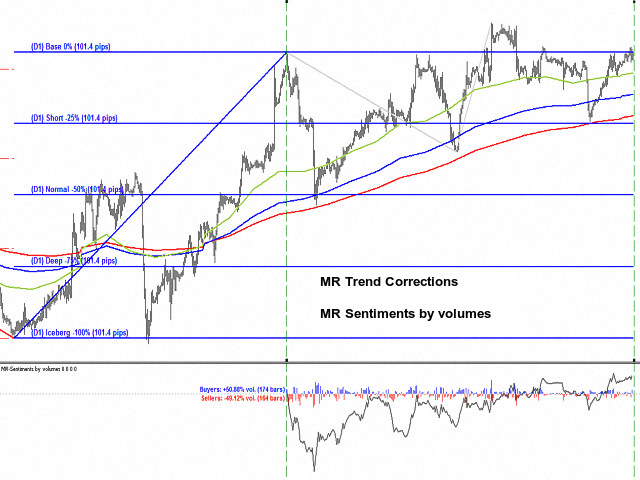
- The indicator shows in the form of a curve the imbalance between sellers and buyers relative to "0", from which it starts to be calculated.Buyers volumes are added with a "+" sign and sellers volumes are added with a "-" sign. The summed difference between the two groups of market participants determines the direction of the curve relative to zero.
- The percentage ratio between buyers and sellers and how many bars are distributed between them is shown in text form.
- The percentage ratio between buyers and sellers and how many bars are distributed between them is shown in text form.
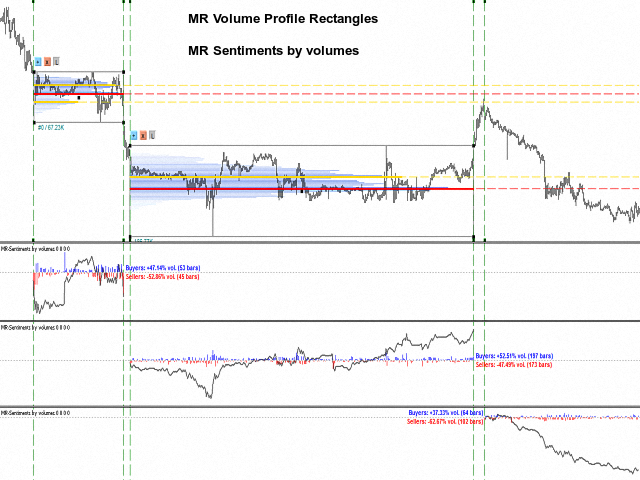
- In the form of a histogram, you can see which volumes belong to the buyers and which belong to the sellers.
- We have found that our indicator gives the best results for around 150-200 bars. After that, information begins to be distorted as a result of the accumulation of data.
- Through the various options in the indicator, you can explore what the "Sentiments" and attitudes of market participants have been for a selected section of the chart.
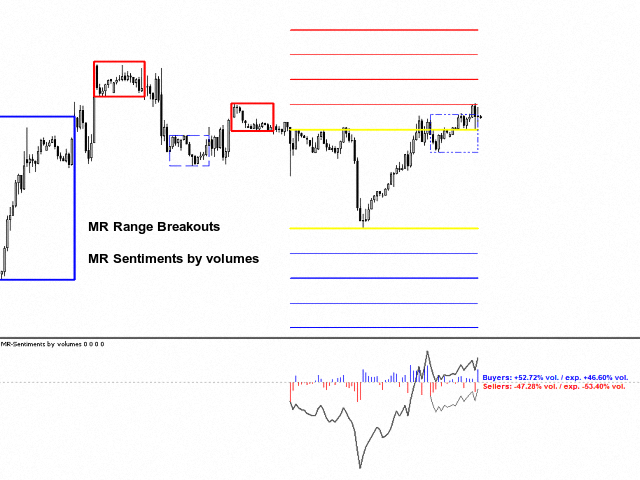
- In combination with the "MR Range Breakouts" indicator, you can see the "Sentiments" inside the range. When we also have an "Expansion" of the sellers or the buyers, you can see the imbalance of all participants in the range to those in the "Expansion".
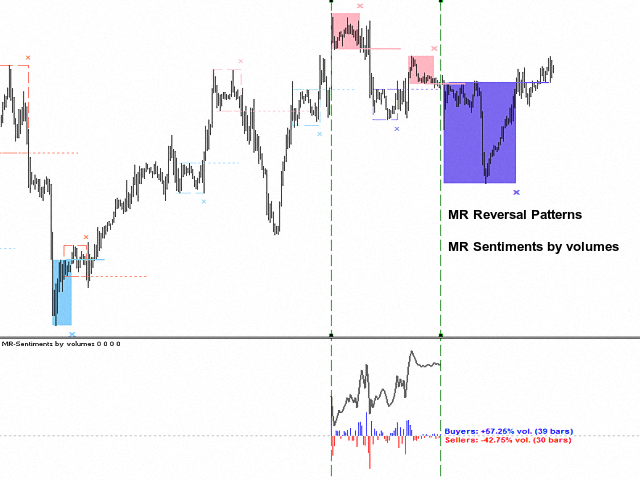
- In combination with the "MR Reversal Patterns" indicator, you can see when the imbalance of volumes have weight when "Reversal patterns" appear and their combinations between them.
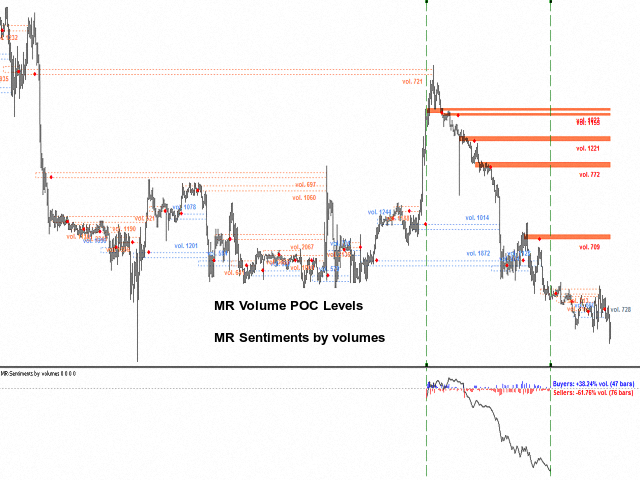
- In combination with the "MR Volume POC Levels" indicator, you can see when the volumes are used in the direction of the price movement and when the true reversal of the price movement occurs.
- In combination with the "MR Volume Profile Rectangles" indicator, you can see the imbalance of volumes in the volume profile.
- Combined with the "MR Trend Corrections" indicator, you can track how long the imbalance between buyers and sellers is in favor of the "Impulsive" price movement and when there is a rearrangement between them at the beginning and at the end of "Corrections".
- The indicator shows with great accuracy the "Sentiments of traders" before the occurrence of financial news.
If you liked the indicator, please support our work by giving 5 stars!!!
For MetaTrader 5 https://www.mql5.com/en/market/product/97142
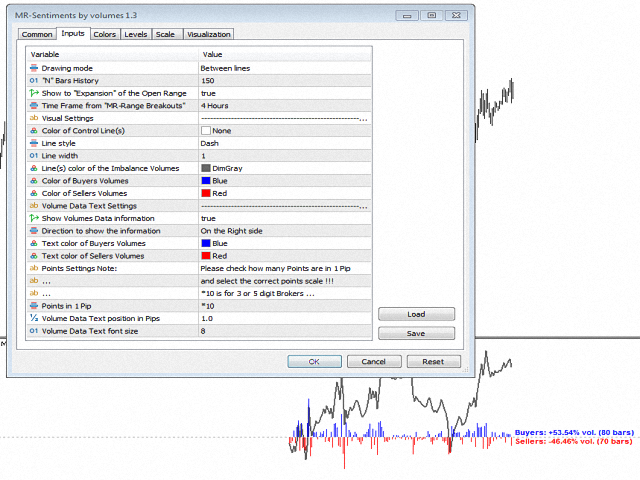
Indicator settings:
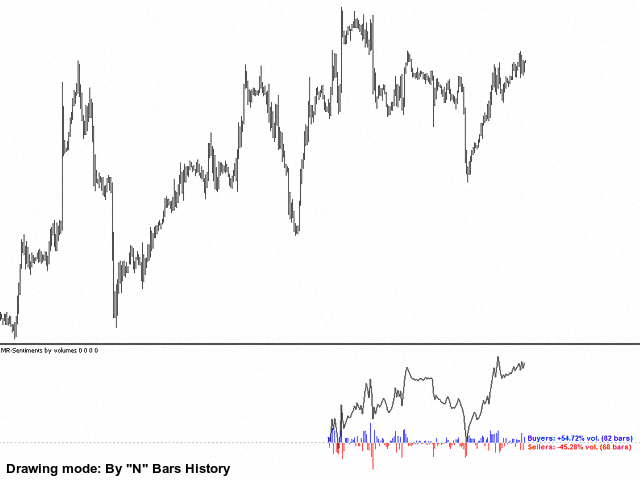
Drawing mode - You can choose the drawing mode of the indicator. The drawing modes are as follows:
- By "N" Bars History - Shows the imbalance of volumes for the last "N" number of bars you specified in the settings. By default, 150 bars are selected.
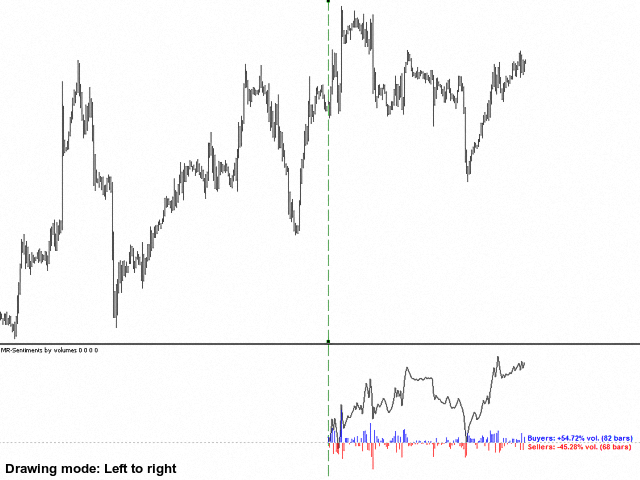
- Left to right - Shows the imbalance of volumes from the control line on the right.
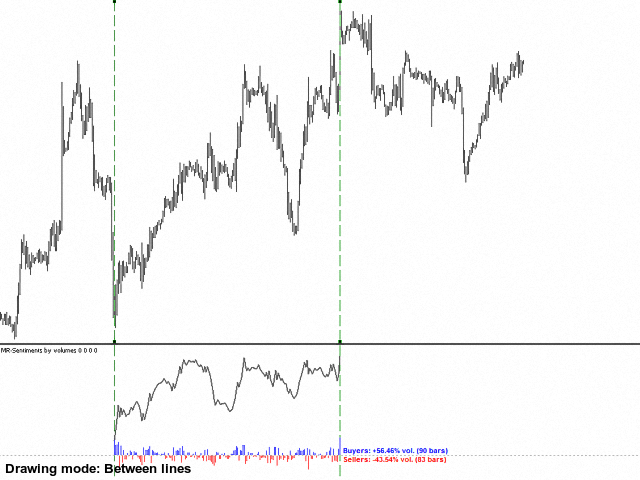
- Between lines - Shows the imbalance of volumes from between two control lines. In this way, you can examine the imbalance of volumes for a selected part of the chart.
- Lock to Open Range from "MR-Range Breakouts" - Shows the imbalance of volumes in the "Open Range" as well as for the "Expansion" of sellers or buyers.
Show to "Expansion" of the Open Range - Shows the imbalance of volumes for "Expansion" of sellers or buyers, if the indicator "MR Range Breakouts" is loaded on the screen. This option works for all selection types of the indicator drawing modes.
Time Frame from "MR-Range Breakouts" - Here you need to specify what time frame you are using in the "MR Range Breakouts" indicator. By default it is "H4". If you use another time frame in the "MR Range Breakouts" indicator and do not specify it here, then the imbalance of volumes for the "Open Range" and "Expansion" will not be displayed.
Section "Visual Settings"
Color of Control Line(s) - You can choose a color for the control line(s).
Line style - You can select the drawing style for the control line(s).
Line width - You can select the drawing width for the control line(s).
Line(s) color of the Imbalance Volumes - You can choose the color of the imbalance of volumes line(s).
Color of Buyers Volumes - You can choose the color of the buyers volumes in the histogram.
Color of Sellers Volumes - You can choose the color of the sellers volumes in the histogram.
Section "Volume Data Text Settings"
Show Volumes Data information - Show or not show the text of information about the imbalance volumes.
Direction to show the information - You can choose on which side of the histogram to display text with information about the imbalance of buyers and sellers. Since the place for displaying the information is limited on the right, when there is also "Expansion" the information is displayed in an abbreviated form.
Text color of Buyers Volumes - You can choose the color of the text for buyers.
Text color of Sellers Volumes - You can choose the color of the text for sellers.
Points in 1 Pip - You can choose the number of Points in 1 Pip.
Volume Data Text position in Pips - You can choose the position in pips for displaying data text.
Volume Data Text font size - You can choose the data text size.