Average Daily Range MQL5
- Indicadores
- Tatiana Zvereva
- Versión: 1.3
- Actualizado: 24 septiembre 2022
- Activaciones: 5
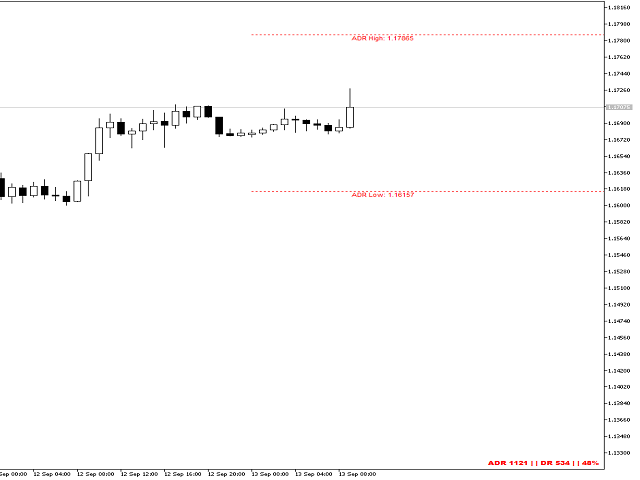
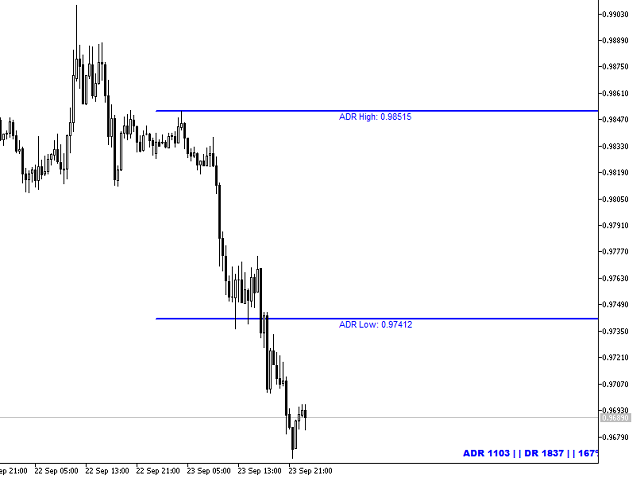
The Average Daily Range (ADR) is an indicator that shows how far a currency pair can move in a day.
Automatically displays the upper and lower ADR levels.
Automatically calculates the percentage and distance of ADR achieved by the currency pair for the day.
Changes the color and thickness of the ADR line when the price reaches it.
The payment is made in 14 days.
It is displayed on timeframes from M1 to M30.