• Información general
  • Comentarios
  • Discusión

TradeArray Scalping

Un indicador comercial profesional con opciones de doble entrada. Valiosas líneas de canal suave en la ventana separada, líneas de tendencia en la ventana principal y flechas de entrada y ventana separadas. Bueno para operar con scalping en los marcos de tiempo más bajos. Incluso también puede funcionar y proporcionar señales en los marcos de tiempo más altos para períodos de negociación a más largo plazo.

AJUSTES DEL INDICADOR:

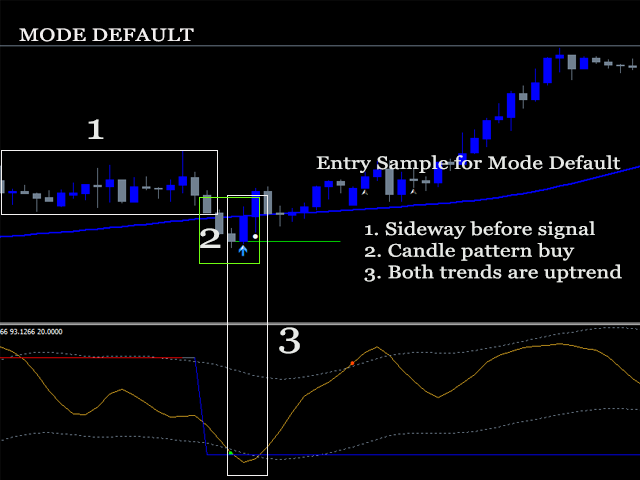
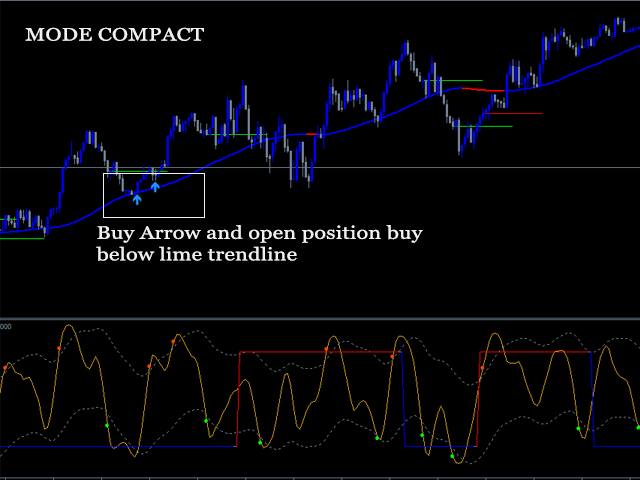
1. Modo de señal. Hay 2 opciones: Predeterminado y Compacto. Si es predeterminado, proporcionará 3 códigos de flecha diferentes en la ventana principal. Esta opción es buena para los comerciantes experimentados que desean obtener más oportunidades de entrada. Las líneas de tendencia cortas y las flechas en el gráfico son las pistas de las áreas comerciales. Puede combinar sus experiencias, como patrones de gráficos o niveles de Fibonacci. De lo contrario, seleccione Signal Mode: Compact y siga las alertas. Compacto significa la combinación de esas 3 flechas con la configuración adecuada.

2. Período de tendencia. Este es el período de la tendencia principal en la ventana principal y la tendencia en la ventana separada.

3. Método de tendencia. Seleccione el método de tendencia aquí. Son pesos simples, exponenciales, suavizados y lineales. Haga doble clic para seleccionarlos.

4. Precio Tendencia Aplicada. Haga doble clic para seleccionar el Precio Aplicado de la Tendencia aquí.

5. Filtro de tendencias. Un valor más bajo será más suavizado y viceversa

6. Período del Canal. Este es el período de la línea del canal en la ventana separada.

7. Método de línea de canal. Este es el método de la línea del canal. (Línea vara de oro)

8. Método del canal. Método del canal ( Dot y SlateGray Lines)

9. Filtro de canales. El filtro de canal. Un valor más bajo será más suavizado y viceversa.

10. Desviación del canal. La desviación del canal.

11. Utilice el máximo de barras. Barras totales máximas para que el indicador muestre los búferes en el gráfico. Si es verdadero, defina el valor a continuación, de lo contrario, el indicador mostrará búferes en todas las barras. Esto puede hacer que mt4 se ralentice en caso de que lo adjunte en varios gráficos.

12. Barras máximas. Defina las barras totales como se menciona en el punto 11 anterior.

13. Alertas de canal superior/inferior de cruce de línea. Si es verdadero, enviará alertas cada vez que las líneas crucen el canal.

14. Alerta emergente. Si es verdadero, aparecerán alertas en el gráfico.

15. Alerta de notificación móvil. Si es cierto, enviará alertas a mt4 mobile. Es necesario configurar una alerta móvil.

16. Alerta por correo electrónico. Si es verdadero, enviará alertas al correo electrónico. No olvide configurar correctamente el correo electrónico.


CÓMO NEGOCIAR

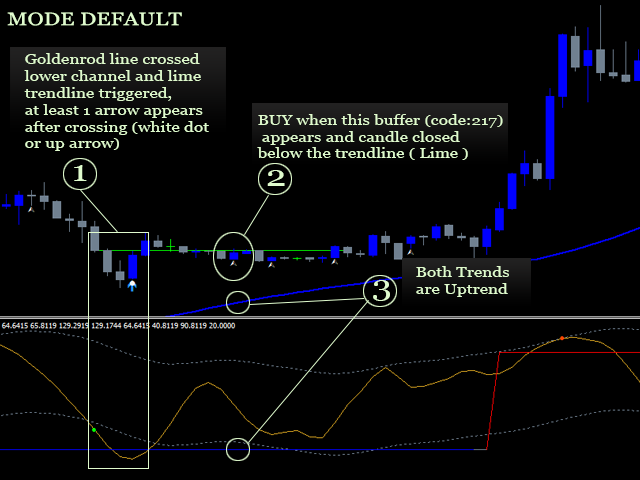
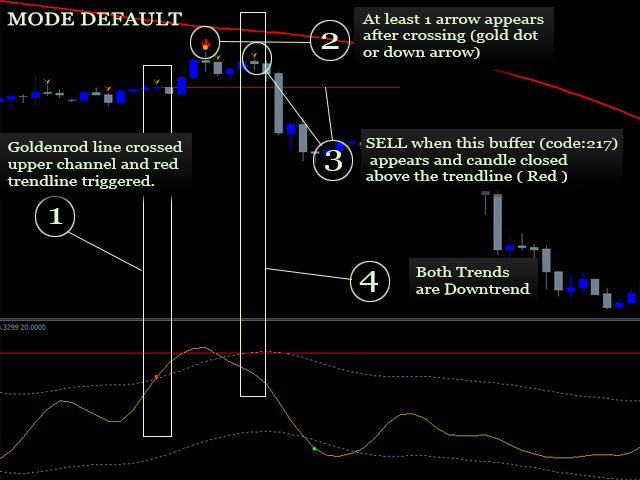
Valores predeterminados de modo:

El indicador dibujará líneas de tendencia cortas en la ventana principal cuando la línea Goldenrod en la ventana separada cruce los canales inferior/superior (Rojo = Sobrecompra y Lima = Sobreventa). Esperando a que aparezcan las flechas en este momento (punto o flecha arriba/abajo). Asegúrese de que la tendencia de la ventana separada y la tendencia de la ventana principal estén en la misma dirección (rojo = tendencia bajista y azul = tendencia alcista). Verifique los patrones de velas más altos o los patrones de gráficos principales o los niveles de Fibonacci, luego abra la posición si se activa la flecha 217 y la vela se cerró por debajo de la línea de tendencia lima para comprar o la vela se cerró por encima de la línea de tendencia roja para vender. Ver imagen para más detalles.

Modo Compacto:

Simplemente defina el Modo de señal = Compacto y siga las alertas.


SUGERENCIAS:

1. La sesión de Asia/Europa es el mejor momento para operar.

2. Evite operar en los eventos de noticias muy altos o 2-3 horas antes del cierre del mercado o alrededor de la brecha extrema de la vela.

3. La tendencia continúa o el mercado lateral (pequeñas velas) después del cambio de tendencia son las mejores condiciones de entrada.


Note: The description above is translated by google. There might be a translation error. Please contact us in english if you have any questions related with indicator.

Productos recomendados
FiboZag
Andriy Sydoruk
Indicator FiboZag - transfer the indicator to the chart and the Fibonacci levels will be built automatically on the last ZigZag turn. The main advantage lies in the correct construction of Fibonacci levels and markup of price levels. Simple, visual and effective use. The indicator is not redrawn and does not lag. Works on all currency pairs and on all timeframes.
Supply Demand Zone Pro Indicator works with all products and timeframes. It is using a new calculation method, and now you can select the desired zone on any timeframe! Strongest Zones are already enabled by default This is a great advantage in trading.This indicator has a built in backtester enabled by default, just move the chart. Supply and Demand ? Supply is a price zone where sellers outnumbered buyers and drove the price lower. Demand is a price zone where buyers outnumbers sellers and
Year2Year
Stanislav Korotky
This indicator shows price changes for the same days in past years. D1 timeframe is required. This is a predictor indicator that finds D1 bars for the same days in past 8 years and shows their relative price changes on the current chart. Parameters: LookForward - number of days (bars) to show "future" price changes; default is 5; Offset - number of days (bars) to shift back in history; default is 0; ShowAverage - mode switch; true - show mean value for all 8 years and deviation bounds; false - s
FREE
Classic Fractals indicator for MT4, with additional Trendlines connecting the latest couples of fractals ( fractals are showing highest high, and lowest low on each period) Rules for trendlines: -if new top fractal is below the last one = new resistance line -if new bot fractal is above the last one = new support line -Trendlines can be hidden -Fractals can be hidden Fractal Period = can be both even or uneven number, as it is setting for half (one side) of the bars sequence
This is a unique multi-currency trading strategy developed for trading on H1 timeframe, which allows you to determine the global market entry points and obtain the maximum profit for each transaction. The market entry point is calculated using a variety of author equations and algorithms. We recommend using the indicator simultaneously on several trading instruments . A huge advantage of Big Deals System is an information panel in which the user can see the current information on potential entry
Добрый День уважаемые трейдеры!  Вашему вниманию индикатор созданный и работающий на базе трендовика ADX,  для торговли на смене направления движения который учитывает коррекцию и даёт возможность на ней заработать.  Применяю этот индикатор для скальпинга. Рекомендую таймфреймы от 15 ти минутного(М15) до часового (Н1) периодов.  Красный кружок сигнал на продажу- Sell) Зелёный кружок  сигнал на покупку Buy) Чем меньше ваш таймфрейм тем меньше пунктов вы зарабатываете.   Важно выставлять стопы! !В
MetaTrend M4
Vahidreza Heidar Gholami
Meta Trend Indicator is an efficient way to forecast and detect the trend in any market. It reveals the trend, support and resistance levels, volatility and the maximum potential target, all in one indicator. To adapt to the price and to decrease consecutive trend failures, the internal trend detector algorithm studies the market and dynamically chooses the right values for the internal parameters. This indicator is a perfect trend filter for any strategy or expert advisor. Features Super Adapti
Reversals typically refer to large price changes, where the trend changes direction. Small counter-moves against the trend are called pullbacks or consolidations.When it starts to occur, a reversal isn't distinguishable from a pullback. A reversal keeps going and forms a new trend, while a pullback ends and then the price starts moving back in the trending direction. Difference Between a Reversal and a Pullback A reversal is a trend change in the price of an asset. A pullback is a counter-move w
Retroceso de Fibonacci & Herramientas de Dibujo de Líneas Extendidas Retroceso de Fibonacci & Herramientas de Dibujo de Líneas Extendidas son aptos para la plataforma MT4 y para operadores que emplean el método de negociación de puntos y la negociación de sección áurea. Ventajas: Sin líneas excusadas ni las excesivamente largas, y es fácil de observar y descubrir oportunidades de negociación. Versión de prueba: https://www.mql5.com/zh/market/product/35884 Funciones principales: 1.
BSA Indicator
Ahmet Metin Yilmaz
BSA indicator is a ZigZag based indicator. This indicator is used to find the reversal level of the price. You can use the existing risk ratio and calculation timeframe in the entries by optimizing them according to your usage preference.  In lower time frames, the indicator can repaint. For healthier results, you can detect the least repainting by observing for a while according to the graphic you will apply.
PZ ABCD Retracement
PZ TRADING SLU
4 (5)
Este indicador encuentra los patrones de retroceso AB = CD. El patrón de retroceso AB = CD es una estructura de precios de 4 puntos en la que el segmento de precios inicial está parcialmente retrocedido y seguido de un movimiento equidistante desde la finalización del retroceso, y es la base básica de todos los patrones armónicos. [ Guía de instalación | Guía de actualización | Solución de problemas | FAQ | Todos los productos ] Tamaños de patrones personalizables Relaciones de CA y BD pe
Average Daily Range SR
William Jidekene Igwe
5 (1)
Average Daily Range (ADR) SR is an indicator which shows how far a currency pair can move in a day. It can be used to find hidden support and resistance levels (SR), estimate effective profit and stop loss targets, and provide short term trade signals from the hidden SR levels. Features Automatically plots on the chat, the top and bottom of the ADR value (i.e. a horizontal channel) which acts as Support and Resistance Levels Automatically calculates the percentage of the ADR reached by the curr
Scalper Inside PRO
Alexey Minkov
4.73 (56)
An exclusive indicator that utilizes an innovative algorithm to swiftly and accurately determine the market trend. The indicator automatically calculates opening, closing, and profit levels, providing detailed trading statistics. With these features, you can choose the most appropriate trading instrument for the current market conditions. Additionally, you can easily integrate your own arrow indicators into Scalper Inside Pro to quickly evaluate their statistics and profitability. Scalper Inside
Atomic Analyst
Issam Kassas
5 (2)
En primer lugar, vale la pena enfatizar que este Indicador de Trading no repinta, no redibuja y no se retrasa, lo que lo hace ideal tanto para el trading manual como para el automatizado. Manual del usuario: configuraciones, entradas y estrategia. El Analista Atómico es un Indicador de Acción del Precio PA que utiliza la fuerza y el impulso del precio para encontrar una mejor ventaja en el mercado. Equipado con filtros avanzados que ayudan a eliminar ruidos y señales falsas, y aumentan el poten
Atrade
Victor Golovkov
Totalmente automático. No requiere ajustes técnicos. Funciona en todos los pares de divisas. El indicador tiene un filtro en zigzag incorporado que limita las repeticiones de señales unidireccionales (es decir, después de una señal de compra, la siguiente será una señal de venta y viceversa). Para facilitar la visualización, el indicador proporciona configuraciones para el tipo de íconos, su color y tamaño: Size Arrow  Code Arrow Buy Color Arrow Buy  Code Arrow Sell Color Arrow Sell Las s
This indicator works on MT4 and is very easy to use. When you receive a signal from it, you wait for that candle with the signal to close and you enter your trade at the beginning of the next new candle . A red arrow means sell and a green arrow means buy. All arrows comes with Alert  like for easy identification of trade signal. Are you okay with that? 1 minute candle 1 minute expire
Real Magic Trend
Muhammed Emin Ugur
This   Real Magic Trend   indicator is designed for signal trading. This indicator generates trend signals. It uses many algorithms and indicators to generate this signal. It tries to generate signals from the points with the highest trend potential. This indicator is a complete trading product. This indicator does not need any additional indicators. The indicator is never repainted. The point at which the signal is given does not change.      Features and Recommendations Time Frame
DoAid
Samuel Akinbowale
5 (1)
DoAid DoAid indicator is a simple channel indicator with an advance timeframe correlation board. DoAid indicator: can be used with any instrument provided by your broker and MetaTrader, be it Currency , Commodity ,Stock, or Cryptocurrencies. DoAid indicator   can be used for swing, scalping and day trading. DoAid indicator   is also a multi time-frame indicator {MTF}. DoAid indicator can be used with any timeframe. It does not repaint.It does not repaint. When To Buy if the market
The Breaker Blocks with Signals indicator aims to highlight a complete methodology based on breaker blocks. Breakout signals between the price and breaker blocks are highlighted and premium/discount swing levels are included to provide potential take profit/stop loss levels. This script also includes alerts for each signal highlighted.   SETTINGS   Breaker Blocks Length: Sensitivity of the detected swings used to construct breaker blocks. Higher values will return longer te
Set TP and SL like Financial Institutions Traders' TP expectations do not often occur and their SL often hits when they only rely on primitive indicators like pivot-points and Fibonacci or classic support or resistance areas. There are a variety of indicators for support/resistance levels, whereas they are seldom accurate enough. Classical support/resistance indicators, often present miss levels and are not noteworthy based on current market volatility dynamic. Fibonacci is good but not enou
Perfect for one minutes high trading and scalping. This indicator is very effective for trading on one minutes, in the hour. A combination of moving averages and STOCHASTICS calculation to produce a very convincing signal every hour. Blue colour signals a buy opportunity. Follow the X signs for possible buy points. The Blue average line serves as possible trend direction and support. Red colour signals a sell opportunity. Follow the X signs for possible sell points. The Red average line serves a
VR Cub
Vladimir Pastushak
VR Cub es un indicador para obtener puntos de entrada de alta calidad. El indicador fue desarrollado para facilitar los cálculos matemáticos y simplificar la búsqueda de puntos de entrada a una posición. La estrategia comercial para la cual se diseñó el indicador ha demostrado su eficacia durante muchos años. La simplicidad de la estrategia comercial es su gran ventaja, que permite que incluso los operadores novatos negocien con éxito con ella. VR Cub calcula los puntos de apertura de posiciones
Credible Cross System   indicator is designed for signal trading. This indicator generates trend signals. It uses many algorithms and indicators to generate this signal. It tries to generate a signal from the points with the highest trend potential. The indicator works based on instant price movements. This indicator is a complete trading product. This indicator does not need any additional indicators. The indicator certainly does not repaint. The point at which the signal is given does not
Key level wedge pro
Presley Annais Tatenda Meck
5 (1)
We have combined all of our beloved indicators the likes of: Key level order block , Key level supply and demand , Key level liquidity grab and Key level wedge into one single indicator and dashboard. Whats new Dashboard : There is an easy access dashboard for all your needs. Multi-timeframe button : There is now a multi-timeframe option for Order Blocks and Supply and demand zones, making it easy to see higher timeframe zones easily on the current timeframe by just clicking the desired timefr
Binary Options Support Resistance Indicator This indicator is designed for binary options trading and effectively shows retracements from support and resistance levels. Signals appear on the current candle. A red arrow pointing downwards indicates a potential selling opportunity, while a blue arrow pointing upwards suggests buying opportunities. All that needs adjustment is the color of the signal arrows. It is recommended to use it on the M1-M5 timeframes as signals are frequent on these timef
Provides instant signals on the chart in panel form. Equipped with signal description and trading analysis tools such as drawing auto trendlines, support/resistance area, regression channel, Fibonacci levels, Pivot levels and current signal price, signal time, signal expiry and stoploss recommendation. Also sending alert messages to all available mt4 alert tool. A detailed description panel provides information about where the signal comes from and what indicators are behind the signal. Includin
YK-Fibo Pivot Indicator: Trade Smarter with Fibonacci Pivot Points The YK-Fibo Pivot Indicator is a powerful technical analysis tool that combines the precision of Fibonacci retracements with the insights of Pivot Points. Whether you're a novice or seasoned trader, this indicator empowers you to spot profitable opportunities in the market with ease. Why Choose YK-Fibo Pivot? Pinpoint Support & Resistance: By calculating Fibonacci levels based on the previous day's high, low, and close prices, y
The   True Magic Oscillator   indicator is designed for signal trading. This indicator generates trend signals. It uses many algorithms and indicators to generate this signal. It tries to generate signals from the points with the highest trend potential. This indicator is a complete trading product. This indicator does not need any additional indicators. The indicator is never repainted. The point at which the signal is given does not change.         Features and Recommendations Wor
Promotion $66 lifetime for you. The principle of this indicator is very simple: detecting the trend with Moving Average, then monitoring the return point of graph by using the crossing of Stochastic Oscillator and finally predicting BUY and SELL signal with arrows, alerts and notifications. The parameters are fixed and automatically calculated on each time frame. Example: If you install indicator on EURUSD, timeframe M5: the indicator will detect the main trend with the Moving Average on this
Apollo BuySell Predictor es un sistema comercial profesional que incluye varios módulos. El indicador proporciona al operador zonas de ruptura de precios, niveles de soporte y resistencia basados ​​en Fibonacci, una línea de inversión de tendencia, señales de volumen, retrocesos y otras características útiles que cualquier operador necesita a diario. El sistema funcionará con cualquier par. Los marcos de tiempo recomendados son M30, H1, H4. Aunque el indicador puede funcionar con otros marcos de
Los compradores de este producto también adquieren
Enigmera
Ivan Stefanov
5 (3)
ENIGMERA: El núcleo del mercado https://www.enigmera.com Introducción Este indicador y sistema de negociación es un enfoque extraordinario de los mercados financieros. ENIGMERA utiliza los ciclos fractales para calcular con precisión los niveles de soporte y resistencia. Muestra la auténtica fase de acumulación y proporciona dirección y objetivos.  Un sistema que funciona tanto si estamos en una tendencia como en una corrección.  ¿Cómo funciona? ENIGMERA consta de tres líneas: la línea de s
TPSpro RFI Levels
Roman Podpora
4.82 (22)
INSTRUCCIONES      RUSO  -  ING     Se recomienda utilizar con un indicador.   -    TPSpro   TENDENCIA PRO -   Versión MT5 Un elemento clave en el trading son las zonas o niveles desde los que se toman las decisiones de compra o venta de un instrumento de trading. A pesar de los intentos de los principales actores de ocultar su presencia en el mercado, inevitablemente dejan rastros. Nuestra tarea era aprender a identificar estos rastros e interpretarlos correctamente. Funciones principales: ¡Mo
Dynamic Forex28 Navigator: la herramienta de trading de Forex de última generación. ACTUALMENTE CON UN 49 % DE DESCUENTO. Dynamic Forex28 Navigator es la evolución de nuestros indicadores populares de larga data, que combina el poder de tres en uno: Indicador avanzado Currency Strength28 (695 reseñas) + Indicador avanzado Currency IMPULSE con ALERT (520 reseñas) + Señales combinadas CS28 (bonificación). Detalles sobre el indicador https://www.mql5.com/en/blogs/post/758844 ¿Qué ofrece el i
TPSproTREND PrO
Roman Podpora
4.79 (19)
TPSpro TREND PRO   es un indicador de tendencia que analiza automáticamente el mercado y proporciona información sobre la tendencia y cada uno de sus cambios, además de dar señales para ingresar operaciones sin volver a dibujar. El indicador utiliza cada vela, analizándolas por separado. refiriéndose a diferentes impulsos: impulso hacia arriba o hacia abajo. ¡Puntos de entrada exactos a transacciones de divisas, criptomonedas, metales, acciones e índices! Versión MT5                   DESCRIPCI
FX Power MT4 NG
Daniel Stein
5 (13)
Obtenga su actualización diaria del mercado con detalles y capturas de pantalla a través de nuestro Morning Briefing aquí en mql5 y en Telegram ! FX Power MT4 NG es la nueva generación de nuestro popular medidor de fuerza de divisas, FX Power. ¿Y qué ofrece este medidor de fuerza de nueva generación? Todo lo que le encantaba del FX Power original PLUS Análisis de fuerza de ORO/XAU Resultados de cálculo aún más precisos Períodos de análisis configurables individualmente Límite de cálculo persona
¡Actualmente 20% OFF ! ¡La mejor solución para cualquier novato o trader experto! Este software funciona con 28 pares de divisas. Se basa en 2 de nuestros principales indicadores (Advanced Currency Strength 28 y Advanced Currency Impulse). Proporciona una gran visión general de todo el mercado de divisas. Muestra los valores de Advanced Currency Strength, la velocidad de movimiento de las divisas y las señales para 28 pares de divisas en todos los (9) marcos temporales. Imagine cómo mejorar
MetaBands M4
Vahidreza Heidar Gholami
5 (2)
MetaBands utiliza algoritmos potentes y únicos para dibujar canales y detectar tendencias para que pueda proporcionar a los traders puntos potenciales para entrar y salir de operaciones. Es un indicador de canal junto con un potente indicador de tendencia. Incluye diferentes tipos de canales que se pueden fusionar para crear nuevos canales simplemente utilizando los parámetros de entrada. MetaBands utiliza todos los tipos de alertas para notificar a los usuarios sobre eventos del mercado. Caract
TrendMaestro
Stefano Frisetti
5 (3)
note: this indicator is for METATRADER4, if you want the version for METATRADER5 this is the link:  https://www.mql5.com/it/market/product/108106 TRENDMAESTRO ver 2.4 TRENDMAESTRO recognizes a new TREND in the bud, he never makes mistakes. The certainty of identifying a new TREND is priceless. DESCRIPTION TRENDMAESTRO identifies a new TREND in the bud, this indicator examines the volatility, volumes and momentum to identify the moment in which there is an explosion of one or more of these data a
ACTUALMENTE 31% DE DESCUENTO Este indicador es una herramienta de transacción única, de alta calidad y asequible porque hemos incorporado una serie de características propias y una fórmula secreta. Con solo un gráfico, da Alertas para los 28 pares de divisas. ¡Imagina cómo mejorarás porque puedes identificar el punto de activación exacto de una nueva tendencia u oportunidad de crecimiento! Basado en nuevos algoritmos subyacentes , hace que sea aún más fácil identificar y confirmar operaciones po
Ultimate Gold Advisor para MetaTrader 4 – ¡Tu Herramienta de Trading de Vanguardia para el Éxito Garantizado! Ultimate Gold Advisor es mucho más que un simple indicador: es la joya tecnológica que revolucionará tu enfoque en el trading con MetaTrader 4. Diseñado para satisfacer las necesidades de los traders más exigentes, este avanzado indicador combina precisión quirúrgica, análisis sofisticado y potentes funciones para ofrecerte una ventaja competitiva inigualable en los mercados. Perfecto pa
FX Volume
Daniel Stein
4.58 (33)
Obtenga su actualización diaria del mercado con detalles y capturas de pantalla a través de nuestro Morning Briefing aquí en mql5 y en Telegram ! FX Volume es el PRIMER y ÚNICO indicador de volumen que proporciona una visión REAL del sentimiento del mercado desde el punto de vista de un bróker. Proporciona una visión impresionante de cómo los participantes institucionales del mercado, como los brokers, están posicionados en el mercado Forex, mucho más rápido que los informes COT. Ver esta info
Entry Points Pro
Yury Orlov
4.62 (175)
Este es un genial indicador para MT4 que ofrece señales precisas para entrar en una transacción sin redibujar. Se puede aplicar a cualquier activo financiero: fórex, criptomonedas, metales, acciones, índices. Nos dará valoraciones bastante precisas y nos dirá cuándo es mejor abrir y cerra una transacción. Eche un vistazo  al vídeo  (6:22), ¡contiene un ejemplo de procesamiento de una sola señal que ha amortizado el indicador! La mayoría de los tráders mejoran sus resultados comerciales durante l
Quantum Breakout Indicator PRO
Bogdan Ion Puscasu
4.96 (25)
Introduciendo       Quantum Breakout PRO   , el innovador indicador MQL5 que está transformando la forma en que comercia con Breakout Zones. Desarrollado por un equipo de operadores experimentados con experiencia comercial de más de 13 años,   Quantum Breakout PRO   está diseñado para impulsar su viaje comercial a nuevas alturas con su innovadora y dinámica estrategia de zona de ruptura. El indicador de ruptura cuántica le dará flechas de señal en las zonas de ruptura con 5 zonas objetivo de
ACTUALMENTE 26% DE DESCUENTO ¡La mejor solución para cualquier operador novato o experto! Este indicador es una herramienta única, de alta calidad y asequible porque hemos incorporado una serie de características propias y una nueva fórmula. ¡Con sólo UN gráfico puede leer la Fuerza de la Divisa para 28 pares de Divisas! Imagínese cómo mejorará su operativa porque podrá señalar el punto exacto de activación de una nueva tendencia o de una oportunidad de scalping. Manual del usuario: haga
Blahtech Supply Demand
Blahtech Limited
4.61 (33)
Was: $299  Now: $99   Supply Demand uses previous price action to identify potential imbalances between buyers and sellers. The key is to identify the better odds zones, not just the untouched ones. Blahtech Supply Demand indicator delivers functionality previously unavailable on any trading platform. This 4-in-1 indicator not only highlights the higher probability zones using a multi-criteria strength engine, but also combines it with multi-timeframe trend analysis, previously confirmed swings
Advanced Supply Demand
Bernhard Schweigert
4.91 (294)
¡Actualmente con 33% de descuento! ¡La mejor solución para cualquier tráder principiante o experto! Este indicador es una herramienta comercial única, de alta calidad y asequible, porque incorpora una serie de características patentadas y una nueva fórmula. Con esta actualización, podrá mostrar zonas de doble marco temporal. No solo podrá mostrar un marco temporal más alto, sino también mostrar ambos, el marco temporal del gráfico MÁS el marco temporal más alto: MOSTRANDO ZONAS ANIDADAS. A todos
Automated Trendlines
Georgios Kalomoiropoulos
5 (16)
Las líneas de tendencia son la herramienta más esencial del análisis técnico en el comercio de divisas. Desafortunadamente, la mayoría de los comerciantes no los dibujan correctamente. El indicador de líneas de tendencia automatizadas es una herramienta profesional para comerciantes serios que lo ayuda a visualizar el movimiento de tendencia de los mercados. Hay dos tipos de Trendlines Bullish Trendlines y Bearish Trendlines. En la tendencia alcista, la línea de tendencia de Forex se dib
Order Block Hunter
Noha Mohamed Fathy Younes Badr
5 (6)
Order block hunter indicator is the best indicator for  hunt the order blocks that area where there has been a large concentration of limit orders waiting to be executed Order blocks are identified on a chart by observing previous price action and looking for areas where the price experienced significant movement or sudden changes in direction .This indicator does that for you by using very complicated codes and helps you to take the best areas To buy and sell because it make marks at the best a
TakePropips Donchian Trend Pro
Eric John Pajarillaga Aldana
4.44 (16)
¡TakePropips Donchian Trend Pro   (MT4) es una herramienta poderosa y efectiva que detecta automáticamente la dirección de la tendencia utilizando el Canal Donchian y le proporciona señales comerciales de entrada y salida! Este indicador multifunción incluye un escáner de tendencias, señales comerciales, panel estadístico, filtro, sesiones comerciales y panel de historial de alertas. ¡Está diseñado para proporcionarle señales comerciales y ahorrarle horas analizando los gráficos! Puede descargar
Best Currency Strength Indicator
Tumelo Patrick Rakotsoane
4.59 (46)
Advanced Currency Strength Indicator The Advanced Divergence Currency Strength Indicator. Not only it breaks down all 28 forex currency pairs and calculates the strength of individual currencies across all timeframes , but, You'll be analyzing the WHOLE forex market in 1 window (In just 1 minute) . This indicator is very powerful because it reveals the true movements of the market.  It is highly recommended to  analyze charts knowing the performance of individual currencies or the countries ec
Allows multiple indicators to be combined into a single indicator, both visually and in terms of an alert. Indicators can include standard indicators, e.g. RSI, CCI, etc., and also Custom Indicators, even those purchased through Market, or where just have the ex4 file. An early alert is provided, say when 4 out 5 indicators have lined up, and a confirmed alert when all are in agreement. A‌lso features a statistics panel reporting the success of the combined indicator by examining the current cha
Currency Strength Exotics
Bernhard Schweigert
4.87 (30)
¡ACTUALMENTE 20% DE DESCUENTO ! ¡La mejor solución para cualquier operador novato o experto! Este indicador está especializado en mostrar la fuerza de la divisa para cualquier símbolo como Pares Exóticos, Materias Primas, Índices o Futuros. Es el primero de su clase, cualquier símbolo se puede añadir a la 9 ª línea para mostrar la verdadera fuerza de la moneda de Oro, Plata, Petróleo, DAX, US30, MXN, TRY, CNH etc. Se trata de una herramienta de trading única, de alta calidad y asequible por
Precautions for subscribing to indicator This indicator only supports the computer version of MT4 Does not support MT5, mobile phones, tablets The indicator only shows the day's entry arrow The previous history arrow will not be displayed (Live broadcast is for demonstration) The indicator is a trading aid Is not a EA automatic trading No copy trading function The indicator only indicates the entry position No exit (target profit)  The entry stop loss point is set at 30-50 PIPS Or the front
NAM Order Blocks
NAM TECH GROUP, CORP.
5 (1)
Indicador de detección de Order Blocks multitimeframe para MT4. Características - Panel de control totalmente personalizable, proporciona una interacción completa. - Oculta y muestra el panel de control donde quieras. - Detecta OB en múltiples marcos de tiempo. - Permite seleccionar la cantidad de OB para mostrar. - Interfaz de usuario de diferentes OBs. - Diferentes filtros de OBs (regulares, rejection y sin capitalizar). - Alerta de proximidad de OBs. - Líneas ADR High y Low. - Servicio de not
¡Descubra el secreto para el comercio de Forex exitoso con nuestro indicador MT4 personalizado! ¿Alguna vez se ha preguntado cómo lograr el éxito en el mercado de Forex, obteniendo ganancias constantemente al tiempo que minimiza el riesgo? ¡Aquí está la respuesta que ha estado buscando! Permítanos presentar nuestro indicador MT4 patentado que revolucionará su enfoque para el comercio. Versatilidad única Nuestro indicador está especialmente diseñado para usuarios que prefieren las formacio
Harmonic Papallons
Ramon Sobrevals Arce
3.33 (3)
Escanea automáticamente el gráfico para encontrar patrones armónicos y le da la oportunidad de entrar temprano en buenas operaciones. Además, si se selecciona, te avisará con antelación cuando aparezcan patrones futuros, mostrándote una proyección de un posible patrón futuro. El objetivo principal   de este algoritmo es determinar con alta precisión el momento en que termina una tendencia y comienza una nueva. Dándote   el mejor precio dentro de una reversión.     Hemos agregado el "Comercio D
Gold Channel is a volatility-based indicator, developed with a specific timing algorithm for the XAUUSD pair, which consists of finding possible corrections in the market. This indicator shows two outer lines, an inner line (retracement line) and an arrow sign, where the theory of the channel is to help identify overbought and oversold conditions in the market. The market price will generally fall between the boundaries of the channel. If prices touch or move outside the channel it is a tra
NextCandlePredictor No Repaint
Martin Alejandro Bamonte
1 (1)
Indicador NextCandlePredictor NextCandlePredictor, una indicador del tipo señal con alerta que no repinta, no cambia su color, no se mueve, no desaparece y no tiene lag. Te ayudará a identificar la dirección de la próxima o próximas velas en cualquier marco temporal. Es altamente recomendado para mercados de alta volatilidad, como Nueva York, Londres o incluso el solapamiento de ambos. Características Principales: Versatilidad en Timeframes : Proporciona señales rápidas y precisas en cualquie
The Forex indicator   TrendNavigator   is a technical indicator. TrendNavigator is a tool that allows traders employing this strategy to better understand what is happening in the market and predict in which direction the price will continue to move. The indicator's values are calculated based on price movements of the currency pair or any other financial asset. Within the scope of technical analysis, the TrendNavigator indicator is used by traders to forecast future price values or the overall
Royal Scalping Indicator M4
Vahidreza Heidar Gholami
4.17 (6)
Royal Scalping Indicator is an advanced price adaptive indicator designed to generate high-quality trading signals. Built-in multi-timeframe and multi-currency capabilities make it even more powerful to have configurations based on different symbols and timeframes. This indicator is perfect for scalp trades as well as swing trades. Royal Scalping is not just an indicator, but a trading strategy itself. Features Price Adaptive Trend Detector Algorithm Multi-Timeframe and Multi-Currency Trend Low
Otros productos de este autor
Provides instant signals on the chart in panel form. Equipped with signal description and trading analysis tools such as drawing auto trendlines, support/resistance area, regression channel, Fibonacci levels, Pivot levels and current signal price, signal time, signal expiry and stoploss recommendation. Also sending alert messages to all available mt4 alert tool. A detailed description panel provides information about where the signal comes from and what indicators are behind the signal. Includin
Provides Regression Channel on the current chart. Combined by Trend of Moving Averages and Multi timeframes Oscillator Indicators: CCI, RSI, Stochastic, and MACD with specific working logic . It could make us easier to identify swing high-low as an entry point, the retracement area while following the current trend. Consists of 2 types of signal, main and secondary. The main signal will draw very clearly triangle and lines on the chart with the word " BUY" or 'SELL'. and the secondary is the sta
MACD Scanner provides the multi symbols and multi-timeframes of MACD signals. It is useful for trader to find the trading idea quickly and easily. User-friendly, visually clean, colorful, and readable. Dynamic dashboard display that can be adjusted thru the external input settings. Total Timeframes and Total symbols as well as the desired total rows/panel, so it can maximize the efficiency of using the chart space. The Highlight Stars on the certain matrix boxes line based on the selected Scan M
It works based on the Stochastic Indicator algorithm. Very useful for trading with high-low or OverSold/Overbought swing strategies. StochSignal will show a buy arrow if the two lines have crossed in the OverSold area and sell arrows if the two lines have crossed in the Overbought area. You can put the Stochastic Indicator on the chart with the same parameters as this StochSignal Indicator to understand more clearly how it works. This indicator is equipped with the following parameters: Inputs d
FREE
Pivot SR
Wartono
4.5 (2)
It identifies the pivot, support, and resistance price levels of the selected timeframe and then draws lines onto the chart. FEATURES: Option to specify the Timeframe Period in the PivotSR calculation. Option to display the PivotSR of the last candle, of every candle, or of the current candle. Options for displaying labels, line thickness, and line color. PivotSR can be interpreted as reversal levels or past price reactions that can be used as the basis for current price analysis. Some traders b
FREE
It is a custom non-repaint indicator to identify trade opportunities in swing action as prices move within an upper and lower band. Inspired by the Keltner Channel, the most popular channel Indicator introduced by Chester Keltner. It is different with a Bollinger Bands. It represents volatility using the high and low prices, while Bollinger's studies rely on the standard deviation. The algorithm for this indicator is also available in the EntryMaximator EA. Including the option to use it or not.
FREE
All in one Indicator. Multiple market analysis tools. Non-Repaint Oscillator signals, Trend lines, Price channel, Fibonacci levels, Support and Resistance, Regression, Pivot levels, Candle Strength and Oversold/Overbought line detector. Includes buttons to hide or show. Advanced algorithms to detect important reversal points and draw trend lines or shapes automatically in appropriate areas. A simple and professional chart display, user friendly and easier to understand for faster and accurately
SignalPinner is a trend line Indicator which can detect market trends early by including three types of signal arrows. Non repaint and trend following. Signals on the strong trend, signals in the beginning of trend and signals with multiple market analysis algorithm as the main signals. Supported by alert notification message to keep you getting signals while on the go. Symbols: Any Timeframes: Any Features Histogram buffers as a sign the trend is started. It can help the trader knowing the ma
Scanning   Multi Symbols Scalping Signals based on 3 kinds of Market Analysis methods. Trend, Signal, and Reversator. And each method consists of its own multi timeframes algorithm functions. Summarized to become clear signals direction BUY/SELL, including the signals strength scoring and sending message to all available alert tools. Displayed on a User Friendly and customizable Dashboard. Size, colors, coordinates, highlight, hidden/show and more. Base Timeframe: M15. And M5 to Daily to confirm
Oversold and Overbought Candles, Trendlines, and BUY-SELL arrows in the single Indicator. Built from 8 default MT4 Indicators. Stochastic,RSI,SAR,CCI,RVI,DeMarker,WPR and MA. It is " NON REPAINT " indicator. All buffers do not repaint.  Double Trendline buffers that can also be used to identify sideway market and support resistance area.  Any timeframes and any currency pairs. Parameters: Show Trend . TRUE/FALSE to show trendlines on the chart Follow Trend. If TRUE , Dapitrend will show on
GOLDEN RETRACEMENT POWER indicator draws fibonacci levels automatically. Defines the golden entry buy/sell area, support and resistant lines , signals arrows and strength 'Power Bars Level' based on price action . Some indicators also work behind the chart: Stochastic,RSI,MFI,DeMarker and WPR . Fibonacci retracements are a popular form of technical analysis used by traders in order to predict future potential prices in the financial markets. If used correctly, Fibonacci retracements and ratios c
Non-repaint indicator    to identify trade opportunities in swing action as prices move within an upper and lower band. Inspired by the Keltner Channel, the most popular channel Indicator introduced by Chester Keltner. It is different with a Bollinger Bands. It represents volatility using the high and low prices, while Bollinger's studies rely on the standard deviation. Customized by adding the trends exactly in the middle line, arrows when price cross over the outer lines and Fibonacci Levels L
It is based on Multiple EMA indicators. The idea is that how to display multiple Exponential Moving Averages on the chart easily without placing them one by one. It has also BLUE-RED trend lips to define UPTREND and DOWNTREND whichas BLUE is UPTREND and RED is DOWNTREND.You can change the colors by going to Indicator properties --- colors. There are 2 external setting. They are Period and Shift. When you change them (period and or shift ) then all will automatically adjust. For any currency pair
This is the countdown of the last candle Indicator. How much time remains in the current candle of your chart CTime display exactly how many hours, minutes and seconds remain before the current candle closes, and a new one opens. This allows you to be on the ball as soon as the next candle appears It could be useful for a trader who trades with candles as the main attention Available option to change the text color to suit the chart background. This Indicator is related to the system here .
FREE
Range Multi Alligators provides Range Channel High Low Information and the market trend indicated by the blue-red Histogram in the middle of range channel. The range channel lines is useful to define stoploss and take profit. This is trend follower indicator based on the Multi Alligators. Attach it on the chart and change one or all setting then all lines will move synchronously with the current one. Parameters Period : the number of bars used for the indicator calculations. Default: 120 used
Stochastic Candles Indicator   It will convert the stochastic indicator from separate window to the chart window by drawing oversold-overbought coloring candles. Red is overbought and blue is oversold by default.And you can change the color later on the external indicator setting.This is Multi timeframe  indicator that means it can show appearance result from another timeframe.E.g: If you set timeframe H1 then it will draw candles from Timeframe H1 whatever timeframe you attach on. It will be us
Autobot Retracement Code (ARC) A robot trading that works based on retracement strategy while following the market trend.It has  made average profits up to 25% /month that is relatively a High Return of Investment.Real Account proof. Fully automation. Auto Lot sizing, Auto TakeProfit Calculation, Auto StopLoss Calculation. Currently Running on Real account , it has more than 100% growth / 5 months. NEW UPDATE RELEASED, VERSION 3.0  FEATURES on Version 3: FIFO rules Auto LotSize Auto StopLoss
Order Management EA (OME). The software will manage your trades based on 2 options: Magic Number or Order Comment. Both the Trades from the other EA or from Manual Trading. Drawing Stop Loss/Take Profit, Close All the positions, manages Multiple Orders, determining grid range and entry signals automatically.  Sending Martingale Orders, if necessary, that can be turn off/on. Including 2 options lot calculation: Multiplication or Addition.  You install OME in your account, you place order, and it
Strategy – Bollinger Band, Moving Average and Price Actions. Bollinger Bands to identify High-Low Price, Moving Average to identify Trend and Price Action is to synchronize both of them.  SardaFx 4.1 has average holding time 24 hours (1 day) on timeframe H1. It is not a Martingale EA or Averaging EA. The work is simple, BUY and Exit or SELL and Exit. No recurring BUY and or SELL in the same time and the same symbol except you adjust Max BUY/SELL  more than 1,default setting is 1 BUY and 1 SELL.
Some informations on the chart with the single attachment. RangeBorder Buy Sell (RBBS) Non Repaint Indicator will provide trend line, buy sell arrows,reversal arrows, range channel, order exit area,high average price line and low average price line.All arrows and lines don't repaint and not lagging. Once candle closed it won't  repaint. Reading Indicator: 1. Small Stars , Indicates oversold and overbought with certain logic and price may reverse when this small star triggers. Useful to identif
TrendWavePattern  an another way to trade with a harmonic pattern, a maestro classic pattern . I made some improvements and combinations with my own strategy. Trend direction, buy-sell signal ,hi-low area and pivot line. These will be helpful for trader to read the current market condition. So it is not blindly following the pattern itself but also following other informations from the market. Readable chart appearance . Designed to be user friendly even you are a new trader. BUY-SELL zone, Ta
This is MT4 version of StochScanner It scans Stochastic from Multi Symbols and Multi Timeframes and displayed on the dashboard on a single chart. . 4 scanning modes: 1. Mode OverBought/OverSold Indicator scans Overbought and OverSold . OverBought : current stochastic is above level 80 and OverSold : current stochastic is below level 20 2. Mode Signal It means if the previous stochastic is on OverBought or OverSold ( either Main Line and Signal Line ) and the current Main Line cross over the curr
It is an expert advisor that scans the last patterns on defined symbols and timeframes . Multi Symbols /pairs , Multi timeframes .  There are 2 ways to specify symbols : Automatically scan all symbols available on the market watch (true/false) Type any symbols ,separated by comma.   There are also 2 ways to specify timeframes : Automatically scan all timeframes available on mt4 (true/false) Type any timeframes,separated by comma.   Unlimited symbols available in an account and unlimited timefr
Lemurian Trader is a multi symbols  EA/robot. User can input symbols in the external parameter separated by comma. Only need to place on the single chart, no need to open multiple chart,no limited symbols as long the symbol is available on the market watch. Sweeping signals from timeframe M15 to H4 on each symbol to find the best high/low price while it also keeps to follow the trend. Lower TF M15 as a signal and higher(M30,H1,H4) to indentify trend and high low. It means whatever timeframe we p
RSI Scanner Plus Indicator scans RSI values in multiple symbols and timeframes. Plus trend line buffer on the chart.  Features: -Trend Line :  We add trend line on the chart in the hope it help you to see current trend on the chart while following oversold and overbought  from RSI. This is additional feature in the indicator. We consider that following the trend is very important in trading. -Changeable Panel Display :  Change the value of Max.Symbols/Panel and  the indicator will adjust the d
TrendScanner XTra scans market trends from Multi Symbols and Multi Timeframes with extra additional Entry Point Signals arrow on the current chart. Features: -Entry Point SIgnals :  This is additional feature in the indicator. No repaint arrows. The Trading system in the single indicator. MTF Trend informations and Entry Signals. In order to make it easier for trader to get trading moments from a single chart and  deciding entry time.  -Changeable Panel Display :  Change the value of Max.Symbo
PullbackMatrix provides the key information of the trading transactions when it finds the right market moment based on its built-in logic algorithm. The high accuracy signals including Trading Symbol, Entry Price, Entry Time, TakeProfit, Stoploss, and more. And that's all will be available instantly in your chart panel, drawing the position lines and also sending signal notification to email, mobile phone, and screen popup. More important is that also saves signals into a .csv file which is usef
It could help to calculate Risk-Reward easily before placing a BUY-SELL position. TradeSizeCalculator is a Multi-Tasking Calculator. It will calculate the others when we define the value in one of the columns. Stoploss, risk percentage, risk-money, lot size, take-profit , reward-money, and reward-ratio. Depending on which value is changed. All values in the columns are editable. Also, we can get those calculation results by drag-drop the stop-loss/take-profit line. Parameter: The inputs below ar
It has 3 capabilities at once and can be adjusted according to needs. Full Auto, Semi-Auto, or Warning Signals only. You can choose it by setting the parameters provided. Built to help Traders work much easier than doing it manually. Sharpen the accuracy of market analysis performed by a Trader by only executing in certain price areas and adjustable signal parameters. Features Ability to manage trading management, including automatically determining stop loss/take profit, calculating lot size ba
GU Spot is a One Shot One Kill EA. A  Scalping EA   for GBPUSD .   No Martingale, No Averaging, No Grid or other high-risk strategies.  Working with up to the best 100 trading signals algorithm from various Trading Systems. The combination of Price Action, High Low, Trend, Range Levels, Pullback /  Retracement and Reversal. This is Fully Automatic Trading Robot . High Accuracy Entry Signals and protected by a proper Money Management. A tight Stop Loss with SL:TP ratio 1:3 by default, Trailing an
Filtro:
No hay comentarios
Respuesta al comentario