• Información general
  • Comentarios
  • Discusión
  • Novedades

Dashboard Critical Support and Resistance MT5

如果产品有任何问题或者您需要在此产品上添加功能,请联系我

Contact/message me if you encounter any issue using the product or need extra feature to add on the base version.


To access the free demo version, please re-direct to this LINK.

To access the single pair version, please re-direct to this LINK.

Price is likely to pullback or breakout at important support and/or resistance. This dashboard is designed to help you monitor these critical support and resistance area. Once price moves close to these important support and resistance within the warning area (warning area range is adjustable), alert or notification would be sent out, and indicator panel will be repainted to be red to make it noticeable. So you are free from watching and monitoring chart all day long.

Dashboard Super Critical Support and Resistance is an intuitive and handy graphic tool to help you to:

  • Have the most commonly used critical support and resistance (pivot support1/2/3, pivot resistance1/2/3, daily/weekly/monthly pivot, daily open, 100 round points, and previous daily high/low) of 28 major pairs under control with one dashboard.


Features

  • Ability to select usage of alert/notification function.
  • Adjustable warning range for each type of critical support/resistance.
  • Ability to select which critical support/resistance to use, by default, all of them are selected.
  • Adjustable indicator panel position


Important Action Items before Using Dashboard

  1. For the first time loading Dashboard, it may take 3-5 minutes to download historical data. For subsequent loading, it only takes a few seconds.
  2. Make sure you have all 28 symbols in Symbol window (if your broker offers 28 pairs).


Input Parameters

  • Send Alert upon Signal
  • Send Notification upon Signal
  • Use Pivot Support1
    • True: pivot support cell panel will be repainted to be red, and alert/notification will be sent once price moves to area within pivot support warning zone
    • False: no action will be triggered
    • Same rule is applied to the following support/resistance
  • Pivot Support1 Warning Zone
  • True: pivot support cell panel will be repainted to be red, and alert/notification will be sent once price moves to area within pivot support warning zone
  • Same rule is applied to the following warning zone
  • Use Pivot Support2
  • Pivot Support2 Warning Zone
  • Use Pivot Support3
  • Pivot Support3 Warning Zone
  • Use Pivot Resistance1
  • Pivot Resistance1 Warning Zone
  • Use Pivot Resistance2
  • Pivot Resistance2 Warning Zone
  • Use Pivot Resistance3
  • Pivot Resistance3 Warning Zone
  • Use Daily Pivot
  • Daily Pivot Warning Zone
  • Use Weekly Pivot
  • Weekly Pivot Warning Zone
  • Use Monthly Pivot
  • Monthly Pivot Warning Zone
  • Use Daily Open
  • Daily Open Warning Zone
  • Use 100 Round Point
  • 100 Round Point Warning Zone
  • Use Previous Daily High
  • Previous Daily High Warning Zone
  • Use Previous Daily Low
  • Previous Daily Low Warning Zone
  • Suffix: suffix string of your symbol. i.e.: your symbol is ‘EURUSDx’ instead of ‘EURUSD’, input ‘x’ in suffix cell, leave prefix cell blank
  • Prefix: prefix string of your symbol


Dashboard Objects

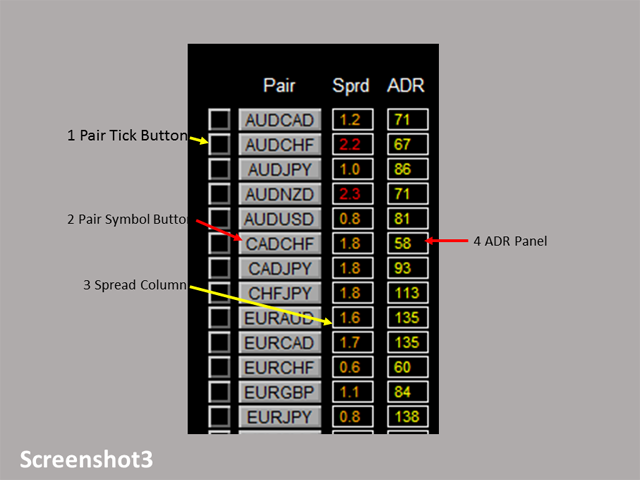
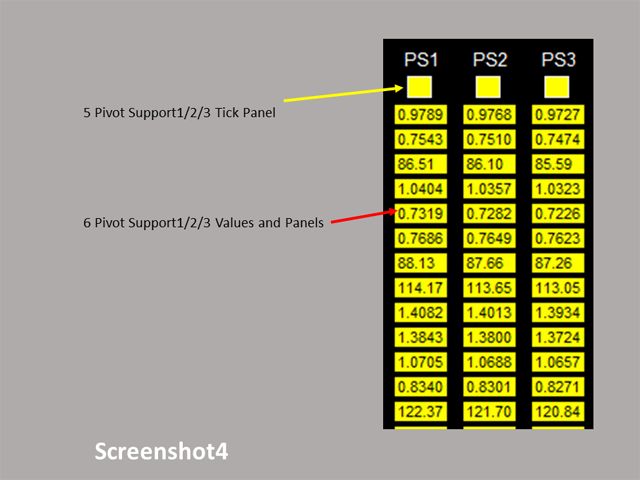
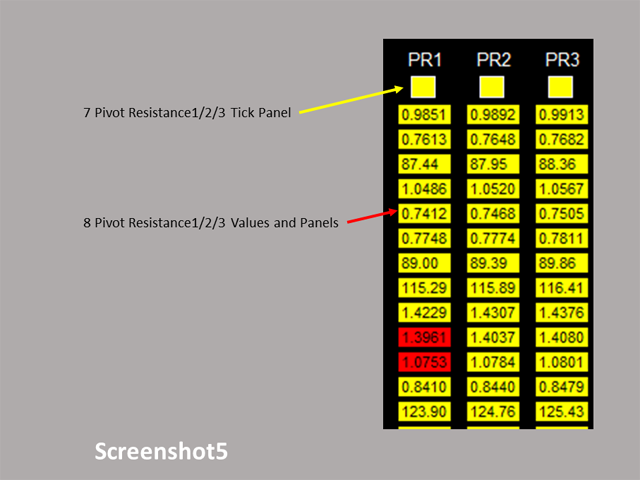
Please refer to screenshot 3 to 7.

  1. Pair Tick Button: Click once to active the corresponding pair for trading. Click once more to de-active.
  2. Pair Symbol Button:
    • Click on button to open a corresponding new window chart
  3. Current Price Column: show current price of each pair.
  4. Pair/Currency Selection Button:
    • All: select all 28 pairs
    • None: clear all selected pairs
    • EUR: select all EUR pairs, like EURUSD, EURJPY…
    • Same rules applies to USD, GBP, JPY... buttons
  5. Pivot Support1/2/3 Tick Panel
  6. Pivot Support1/2/3 Values and Panels
  7. Pivot Resistance1/2/3 Tick Panel
  8. Pivot Resistance1/2/3 Values and Panels
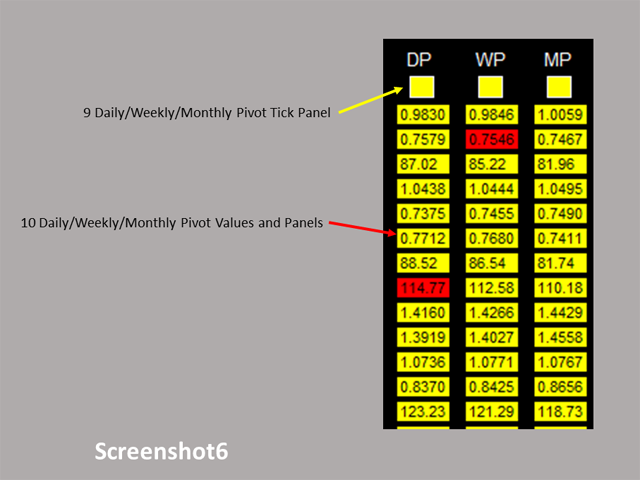
  9. Daily/Weekly/Monthly Pivot Tick Panel
  10. Daily/Weekly/Monthly Pivot Values and Panels
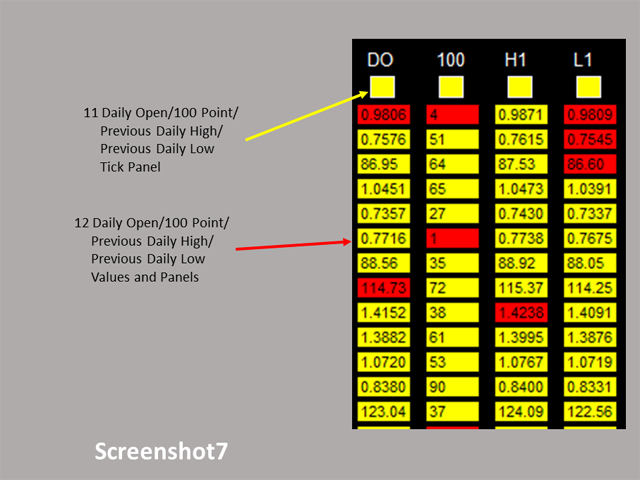
  11. Daily Open/100 Point/Previous Daily High/Previous Daily Low Tick Panel
  12. Daily Open/100 Point/Previous Daily High/Previous Daily Low Values and Panels


Productos recomendados
如果产品有任何问题或者您需要在此产品上添加功能,请联系我 Contact/message me if you encounter any issue using the product or need extra feature to add on the base version. To access the free demo version, please re-direct to this LINK . To access the dashboard version, please re-direct to this LINK . Critical Support and Resistance is an intuitive, and handy graphic tool to help you to monitor and manage critical support and resistance price point easily with one glance to know status of all important S&R. Price is likely
El indicador construye cotizaciones actuales, que se pueden comparar con las históricas y, sobre esta base, hacer un pronóstico de movimiento de precios. El indicador tiene un campo de texto para una navegación rápida a la fecha deseada. Opciones: Símbolo - selección del símbolo que mostrará el indicador; SymbolPeriod - selección del período del cual el indicador tomará datos; IndicatorColor - color del indicador; HorisontalShift: cambio de cotizaciones dibujadas por el indicador
This is a multi-symbol and multi-timeframe table-based indicator designed for a candlestick patterns detection with 46 patterns for META TRADER 5. Each formation has own image for easier recognition. Here you find most popular formations such as "Engulfing", "Hammer", "Three Line Strike", "Piercing" or Doji - like candles. Check my full list of patterns on my screenshots below. Also you can not only switch all bearish or bullish patterns from input, but also select formation for a specified symb
Pullback Hunter
Anton Polkovnikov
PULLBACK HUNTER (CAZADOR DE RETROCESOS) ¿Cuál es el último sueño de todo comerciante? Para ver sin demora dónde se producirá el retroceso. Por supuesto, es una especie de magia, aunque... nada es imposible. Pero mientras tanto he preparado para usted un indicador que marca en tiempo real el final de la corrección al movimiento actual o en pocas palabras - capta los retrocesos. ¿Cuál es la idea principal? Mucha gente practica los rebotes cuando el precio se mueve en la dirección de la posición ab
Gecko EA MT5
Profalgo Limited
5 (1)
NEW PROMO: Only a few copies copies available at 349$ Next price: 449$ Make sure to check out our " Ultimate EA combo package " in our   promo blog ! Gecko runs a simple, yet very effective, proven strategy.  It looks for important recent support and resistance levels and will trade the breakouts.  This is a "real" trading system, which means it will use a SL to protect the account.  It also means it will not use any dangerous techniques like martingale, grid or averaging down. The EA shows its
The Supernova Momentums indicator simplifies the visual perception of the price chart and reduces the time for analysis: if there is no signal, the deal is not opened, and if an opposite signal appears, it is recommended to close the current position. This arrow indicator is designed to determine the trend. Supernova Momentums implements a trend trading strategy, filters out market noise, and includes all the necessary features in one tool. Its work is based on automatically determining the c
El indicador MTF Qristalium Arrows es un sistema de comercio semiautomático terminado. Funciona en todos los pares de divisas.  En el indicador están involucrados tres reglas: 1) operar sólo por la tendencia, 2) "comprar, cuando todo el mundo vende y vender, cuando todo el mundo compra", 3) el Precio siempre va en contra de la multitud.  El indicador MTF Qristalium Arrows filtra los datos de la regla en varios Marcos de tiempo con indicadores integrados. Si coincide con la tendencia en la
Description : Rainbow EA MT5 is a simple Expert advisor based on   Rainbow MT5 indicator witch is based on Moving average with period 34. The indicator is incorporated in the EA, therefore, it is not required for the EA to operate, but if you wish, you can download it from   my product page . The Expert Advisor settings are as follows : Suitable for Timeframes up to H1 The parameters below can be set according to your trading rules. StopLoss ( Stop Loss in pips) TakeProfit ( Take Profit in pi
¡El nivel Premium es un indicador único con más del 80% de precisión de predicciones correctas! ¡Este indicador ha sido probado por los mejores especialistas en comercio durante más de dos meses! ¡El indicador del autor no lo encontrarás en ningún otro lugar! ¡A partir de las capturas de pantalla, puede ver por sí mismo la precisión de esta herramienta! 1 es ideal para operar con opciones binarias con un tiempo de vencimiento de 1 vela. 2 funciona en todos los pares de divisas, accion
Indicator and Expert Adviser  EA Available in the comments section of this product. Download with Indicator must have indicator installed for EA to work. Mt5 indicator alerts for bollinger band and envelope extremes occurring at the same time. Buy signal alerts occur when A bullish candle has formed below both the lower bollinger band and the lower envelope  Bar must open and close below both these indicators. Sell signal occur when A bear bar is formed above the upper bollinger band and upp
TrendDetect
Pavel Gotkevitch
The Trend Detect indicator combines the features of both trend indicators and oscillators. This indicator is a convenient tool for detecting short-term market cycles and identifying overbought and oversold levels. A long position can be opened when the indicator starts leaving the oversold area and breaks the zero level from below. A short position can be opened when the indicator starts leaving the overbought area and breaks the zero level from above. An opposite signal of the indicator can
Provided Trend is a complex signal formation indicator. As a result of the work of internal algorithms, you can see only three types of signals on your chart. The first is a buy signal, the second is a sell signal, and the third is a market exit signal. Options: CalcFlatSlow - The first parameter that controls the main function of splitting the price chart into waves. CalcFlatFast - The second parameter that controls the main function of splitting the price chart into waves. CalcFlatAvg - Par
AW Candle Patterns
AW Trading Software Limited
El indicador de patrones de velas AW es una combinación de un indicador de tendencia avanzado combinado con un potente escáner de patrones de velas. Es una herramienta útil para reconocer y resaltar los treinta patrones de velas más fiables. Además, es un analizador de tendencias actual basado en barras de colores con un       panel de tendencias de múltiples marcos de tiempo que se puede cambiar de tamaño y posicionar. Una capacidad única para ajustar la visualización de patrones según el filtr
The indicator detects divergence signals - the divergences between the price peaks and the MACD oscillator values. The signals are displayed as arrows in the additional window and are maintained by the messages in a pop-up window, e-mails and push-notifications. The conditions which formed the signal are displayed by lines on the chart and in the indicator window. The indicator parameters MacdFast - fast MACD line period MacdSlow - slow MACD line period MacdSignal - MACD signal line period Mac
Este producto le ayudará a comprar con beneficio y usar dos productos más populares para el análisis de los volúmenes de las peticiones y operaciones en los mercados de equidad: Actual Depth of Market Chart Actual Tick Footprint Volume Chart Este producto ha integrado toda la potencia de cada uno de los indicadores y se ofrece como un archivo único. Las rebajas anticrisis. ¡Hoy el precio del producto está rebajado! ¡Dese prisa! Las capacidades funcionales del producto Actual COMBO Depth of Mark
Blahtech Supply Demand MT5
Blahtech Limited
4.54 (13)
Was: $299  Now: $99   Supply Demand uses previous price action to identify potential imbalances between buyers and sellers. The key is to identify the better odds zones, not just the untouched ones. Blahtech Supply Demand indicator delivers functionality previously unavailable on any trading platform. This 4-in-1 indicator not only highlights the higher probability zones using a multi-criteria strength engine, but also combines it with multi-timeframe trend analysis, previously confirmed swings
Diseñado por Welles Wilder para gráficos diarios de materias primas, el ADXW es utilizado actualmente en diversos mercados por operadores técnicos para evaluar la fuerza de una tendencia o incluso una tendencia para operaciones a corto o largo plazo. El ADXW utiliza un indicador direccional positivo (DI+) y negativo (DI-) además de su línea de tendencia (ADX). Según Wilder, una tendencia tiene fuerza cuando la señal del ADX es superior a 25; la tendencia es débil (o el precio no tiene tende
There is Demo version of this panel Dashboard Symphonie Trader System MT5 Demo in my product list, please try it out to get familiar with all functionalities for free. Free version: LINK MT4 version: LINK  This system basically utilizes Symphonie Indicator Set (Extreme, Emotion, Trend, and Sentiment) as the core indicators to generate trading signal mainly on time-frame M15. The signal will be further filtered and trimmed by 1) M5 and M15 Stochastic; 2) EMA5 and PA To facilitate you to understan
Was: $249  Now: $99   Market Profile defines a number of day types that can help the trader to determine market behaviour. A key feature is the Value Area, representing the range of price action where 70% of trading took place. Understanding the Value Area can give traders valuable insight into market direction and establish the higher odds trade. It is an excellent addition to any system you may be using. Inspired by Jim Dalton’s book “Mind Over Markets”, this indicator is designed to suit the
Time And Sales Delta
Evgeny Shevtsov
5 (2)
The indicator displays the delta and the cumulative delta based on the "Time & Sales" deals list data. In addition to the standard timeframes, the indicator displays data regarding the seconds timeframes (S5, S10, S15, S20, S30) to choose from. Using the rectangle, user can select an arbitrary area in the indicator subwindow to view the ratio of the volumes of deals of buyers and sellers within this area. Indicator features: The indicator works correctly only on those trading symbols for whi
VR Grid Mt5
Vladimir Pastushak
3.43 (7)
El indicador VR Grid está diseñado para crear una cuadrícula gráfica con configuraciones definidas por el usuario. A diferencia de la cuadrícula estándar , VR Grid se utiliza para construir niveles circulares . Dependiendo de la elección del usuario, el paso entre los niveles de ronda puede ser arbitrario. Además, a diferencia de otros indicadores y utilidades, VR Grid mantiene la posición de la grilla incluso cuando cambia el período de tiempo o se reinicia el terminal. Las configuraciones, arc
FREE
Awesome Oscillator by Bill Williams with the ability to fine-tune and replace the averaging algorithms of the indicator, which significantly expands the possibilities of using this oscillator in algorithmic trading and brings it closer in its properties to such an indicator as the MACD. To reduce price noise, the final indicator is processed with an additional Smooth averaging. The indicator has the ability to give alerts, send mail messages and push signals when the direction of movement of th
Extreme indicator
Ignacio Agustin Mene Franco
Extreme indicator !  es un oscillador que funciona con niveles de volumen de vela , donde consta de colores rojo y verde ,  donde mide la venta y compra ! donde tambien viene con un formato de cruces de lineas donde reconfirma la compra o venta en esta ocasion ,  funciona para los mercados de forex y para los mercados de indices sinteticos !  Funciona para todas las temporalidades !  Buen Profit ! World Inversor . 
Renko System
Marco Montemari
This indicator can be considered as a trading system. It offers a different view to see the currency pair: full timeless indicator, can be used for manual trading or for automatized trading with some expert advisor. When the price reaches a threshold a new block is created according to the set mode. The indicator beside the Renko bars, shows also 3 moving averages. Features renko mode median renko custom median renko 3 moving averages wicks datetime indicator for each block custom notificatio
Show Pips for MT5
Roman Podpora
4.63 (19)
Este indicador de información será útil para quienes quieran estar siempre al tanto de la situación actual de la cuenta. -   Indicadores más útiles El indicador muestra datos como ganancias en puntos, porcentaje y moneda, así como el diferencial del par actual y el tiempo hasta que la barra se cierra en el período de tiempo actual. Hay varias opciones para colocar la línea de información en el gráfico: A la derecha del precio (corre detrás del precio); Como comentario (en la esquina superior
FREE
Introducing "X Marks the Spot" – Your Ultimate MetaTrader 5 Indicator for Perfect Trades! Are you tired of the guesswork in trading? Ready to take your MetaTrader 5 experience to a whole new level? Look no further – "X Marks the Spot" is here to revolutionize your trading strategy! What is "X Marks the Spot"? "X Marks the Spot" is not just another indicator – it's your personal trading compass that works seamlessly on all timeframes . Whether you're a beginner or an experienced trader,
Point Black
Ignacio Agustin Mene Franco
Pack Black Card indicador 5/1  Point black  cuenta con la estrategia de bollingers profesionales donde cada flecha te da una señal distinta de entrada .  sirve asta para operar en m1 y en d1  sirve para hacer scalping y intraday ,  modificado para los mercados de forex !  apto para todo los pares  modificado para los mercados de indices sinteticos apto para todo los pares !  Ideal para los volatilitys y jumps ! 
TTMM – "Time To Make Money" – Time When Traders Makes Money on the Stock Exchanges The ТТММ trade sessions indicator displays the following information: Trade sessions: American, European, Asian and Pacific. (Note: Sessions are displayed on the previous five days and the current day only. The number of days may change depending on the holidays - they are not displayed in the terminals. The sessions are also not displayed on Saturday and Sunday). The main trading hours of the stock exchanges (tim
Green Power
Ignacio Agustin Mene Franco
Pack Black Card  indicador 5/3 Green power cuenta con la estrategia de ropturas high y low  dando la señal con el punto rojo o verde  el punto rojo para short y el punto verde para long ,  perfecto para los mercados de forex y los mercados de indices sinteticos ,  funciona para todas las temporalidades  sirve para hacer scalping y intradiario !  Ideal para los mercados Crash y boom !!
Gartley Projections D
Oleksandr Medviediev
3 (2)
El indicador identifica los patrones armónicos (XABCD) según los desarrollos de H.M.Gartley ("Beneficios en el mercado de valores", 1935г). Proyecta el punto D como un punto en la proyección en perspectiva (especifique ProjectionD_Mode = true en la configuración). No vuelve a dibujar. Cuando se cierra una barra del período de trabajo, si el punto del patrón identificado no se ha movido durante las barras Patterns_Fractal_Bars, aparece una flecha en el gráfico (en la dirección del movimiento
Los compradores de este producto también adquieren
TPSpro RFI Levels MT5
Roman Podpora
4.73 (11)
INSTRUCCIONES       RUSO   -   ING        Se   recomienda utilizar con un indicador.       -       TPSpro   TENDENCIA PRO -   Versión MT5 Un elemento clave en el trading son las zonas o niveles desde los que se toman las decisiones de compra o venta de un instrumento de trading. A pesar de los intentos de los principales actores de ocultar su presencia en el mercado, inevitablemente dejan rastros. Nuestra tarea era aprender a identificar estos rastros e interpretarlos correctamente. Funciones p
TPSproTREND PrO MT5
Roman Podpora
4.89 (9)
TPSpro TREND PRO  - is a trend indicator that automatically analyzes the market and provides information about the trend and each of its changes, as well as giving signals for entering trades without redrawing! The indicator uses each candle, analyzing them separately. referring to different impulses - up or down impulse. Exact entry points into transactions for currencies, crypto, metals, stocks, indices!  Version MT4               DETAILED DESCRIPTION               R ecommended to use with an
Primero que todo, vale la pena enfatizar que este Sistema de Trading es un Indicador No Repintado, No Redibujado y No Retrasado, lo que lo hace ideal tanto para el trading manual como para el automatizado. Curso en línea, manual y descarga de ajustes preestablecidos. El "Sistema de Trading Inteligente MT5" es una solución completa de trading diseñada para traders nuevos y experimentados. Combina más de 10 indicadores premium y presenta más de 7 estrategias de trading robustas, lo que lo convie
Atomic Analyst MT5
Issam Kassas
4.42 (19)
En primer lugar, vale la pena enfatizar que este Indicador de Trading no repinta, no redibuja y no se retrasa, lo que lo hace ideal tanto para el trading manual como para el automatizado. Manual del usuario: configuraciones, entradas y estrategia. El Analista Atómico es un Indicador de Acción del Precio PA que utiliza la fuerza y el impulso del precio para encontrar una mejor ventaja en el mercado. Equipado con filtros avanzados que ayudan a eliminar ruidos y señales falsas, y aumentan el poten
Trend Screener Pro MT5
STE S.S.COMPANY
4.87 (63)
Desbloquee el poder del comercio de tendencias con el indicador Trend Screener: ¡su solución definitiva para el comercio de tendencias impulsada por lógica difusa y un sistema multidivisa!Mejore su comercio de tendencias con Trend Screener, el revolucionario indicador de tendencias impulsado por lógica difusa. Es un poderoso indicador de seguimiento de tendencias que combina más de 13 herramientas y funciones premium y 3 estrategias comerciales, lo que lo convierte en una opción versátil para co
Ante todo, vale la pena enfatizar que esta Herramienta de Trading es un Indicador No Repintado, No Redibujado y No Retrasado, lo que la hace ideal para el trading profesional. Curso en línea, manual del usuario y demostración. El Indicador de Conceptos de Acción del Precio Inteligente es una herramienta muy potente tanto para traders nuevos como experimentados. Combina más de 20 indicadores útiles en uno solo, combinando ideas avanzadas de trading como el Análisis del Trader del Círculo Inte
Quantum Trend Sniper
Bogdan Ion Puscasu
4.8 (49)
Introduciendo       Indicador Quantum Trend Sniper   , el innovador indicador MQL5 que está transformando la forma en que identificas y negocias los cambios de tendencia. Desarrollado por un equipo de comerciantes experimentados con experiencia comercial de más de 13 años,       Indicador de francotirador de tendencia cuántica       está diseñado para impulsar su viaje comercial a nuevas alturas con su forma innovadora de identificar cambios de tendencia con una precisión extremadamente alta.
TrendMaestro5
Stefano Frisetti
note: this indicator is for METATRADER4, if you want the version for METATRADER5 this is the link:  https://www.mql5.com/it/market/product/108106 TRENDMAESTRO ver 2.4 TRENDMAESTRO recognizes a new TREND in the bud, he never makes mistakes. The certainty of identifying a new TREND is priceless. DESCRIPTION TRENDMAESTRO identifies a new TREND in the bud, this indicator examines the volatility, volumes and momentum to identify the moment in which there is an explosion of one or more of these data a
Este tablero muestra los últimos   patrones armónicos   disponibles para los símbolos seleccionados, por lo que ahorrará tiempo y será más eficiente /   versión MT4 . Indicador gratuito:   Basic Harmonic Pattern Columnas del indicador Symbol:   aparecerán los símbolos seleccionados Trend :   alcista o bajista Pattern :   tipo de patrón (gartley, mariposa, murciélago, cangrejo, tiburón, cifrado o ABCD) Entry :   precio de entrada SL:   precio de stop loss TP1:   1er precio de toma de benefici
FX Power MT5 NG
Daniel Stein
5 (5)
Obtenga su actualización diaria del mercado con detalles y capturas de pantalla a través de nuestro Morning Briefing aquí en mql5 y en Telegram ! FX Power MT5 NG es la nueva generación de nuestro popular medidor de fuerza de divisas, FX Power. ¿Y qué ofrece este medidor de fuerza de nueva generación? Todo lo que le encantaba del FX Power original PLUS Análisis de fuerza de ORO/XAU Resultados de cálculo aún más precisos Períodos de análisis configurables individualmente Límite de cálculo persona
IX Power MT5
Daniel Stein
4.17 (6)
IX Power   lleva por fin la insuperable precisión de FX Power a los símbolos que no son de Forex. Determina con exactitud la intensidad de las tendencias a corto, medio y largo plazo de tus índices, acciones, materias primas, ETF e incluso criptodivisas favoritas. Puede   analizar todo lo   que su terminal le ofrece. Pruébalo y experimenta cómo   tu timing mejora significativamente   a la hora de operar. Características principales de IX Power Resultados de cálculo 100% precisos y sin rep
Auto Order Block with break of structure based on ICT and Smart Money Concepts (SMC) Futures Break of Structure ( BoS )             Order block ( OB )            Higher time frame Order block / Point of Interest ( POI )    shown on current chart           Fair value Gap ( FVG ) / Imbalance   -  MTF      ( Multi Time Frame )    HH/LL/HL/LH  -  MTF      ( Multi Time Frame )  Choch  MTF      ( Multi Time Frame )  Volume Imbalance     ,  MTF          vIMB Gap’s Power of 3 Equal High
Matrix Arrow Indicator MT5
Juvenille Emperor Limited
5 (12)
Matrix Arrow Indicator MT5   es una tendencia única 10 en 1 que sigue un indicador   100% sin repintado   de marcos temporales múltiples que se puede usar en todos los símbolos/instrumentos:   divisas ,   materias primas ,   criptomonedas ,   índices ,   acciones .  Matrix Arrow Indicator MT5  determinará la tendencia actual en sus primeras etapas, recopilando información y datos de hasta 10 indicadores estándar, que son: Índice de movimiento direccional promedio (ADX) Índice de canales de prod
Este es un genial indicador para MT5 que ofrece señales precisas para entrar en una transacción sin redibujar. Se puede aplicar a cualquier activo financiero: fórex, criptomonedas, metales, acciones, índices. Nos dará valoraciones bastante precisas y nos dirá cuándo es mejor abrir y cerra una transacción. Eche un vistazo  al vídeo  (6:22), ¡contiene un ejemplo de procesamiento de una sola señal que ha amortizado el indicador! La mayoría de los tráders mejoran sus resultados comerciales durante l
FxaccurateLS
Shiv Raj Kumawat
WHY IS OUR FXACCCURATE LS MT5 THE PROFITABLE ? PROTECT YOUR CAPITAL WITH RISK MANAGEMENT Gives entry, stop and target levels from time to time. It finds Trading opportunities by analyzing what the price is doing during established trends. POWERFUL INDICATOR FOR A RELIABLE STRATEGIES We have made these indicators with a lot of years of hard work. It is made at a very advanced level. Established trends provide dozens of trading opportunities, but most trend indicators completely ignore them!
AT Forex Indicator MT5
Marzena Maria Szmit
5 (4)
The AT Forex Indicator MT5 is a sophisticated trading tool designed to provide traders with a comprehensive analysis of multiple currency pairs. This powerful indicator simplifies the complex nature of the forex market, making it accessible for both novice and experienced traders. AT Forex Indicator uses advanced algorithms to detect trends, patterns and is an essential tool for traders aiming to enhance their forex trading performance. With its robust features, ease of use, and reliable signal
ICT, SMC, SMART MONEY CONCEPTS, SMART MONEY, Smart Money Concept, Support and Resistance, Trend Analysis, Price Action, Market Structure, Order Blocks, BOS/CHoCH,   Breaker Blocks ,  Momentum Shift,   Supply&Demand Zone/Order Blocks , Strong Imbalance,   HH/LL/HL/LH,    Fair Value Gap, FVG,  Premium  &   Discount   Zones, Fibonacci Retracement, OTE, Buy Side Liquidity, Sell Side Liquidity, BSL/SSL Taken, Equal Highs & Lows, MTF Dashboard, Multiple Time Frame, BigBar, HTF OB, HTF Market Structure
Advanced Supply Demand MT5
Bernhard Schweigert
4.5 (14)
¡Actualmente con 33% de descuento! ¡La mejor solución para cualquier tráder principiante o experto! Este indicador es una herramienta comercial única, de alta calidad y asequible, porque incorpora una serie de características patentadas y una nueva fórmula. Con esta actualización, podrá mostrar zonas de doble marco temporal. No solo podrá mostrar un marco temporal más alto, sino también mostrar ambos, el marco temporal del gráfico MÁS el marco temporal más alto: MOSTRANDO ZONAS ANIDADAS. A todos
TPA True Price Action indicator reveals the true price action of the market makers through 100% non-repainting signals strictly at the close of a candle! TPA shows entries and re-entries, every time the bulls are definitely stronger than the bears and vice versa. Not to confuse with red/green candles. The shift of power gets confirmed at the earliest stage and is ONE exit strategy of several. There are available now two free parts of the TPA User Guide for our customers. The first "The Basics"
XQ Indicator MetaTrader 5
Marzena Maria Szmit
3 (2)
Step into the realm of Forex trading with confidence and precision using XQ, a cutting-edge Forex indicator designed to elevate your trading game to unprecedented heights. Whether you're a seasoned trader or just stepping into the world of currency exchange, XQ Forex Indicator empowers you with the insights and signals needed to make informed trading decisions. The signal conditions are a combination of three indicators, and XQ Forex Indicator only display  medium and long-term trends . The ind
PZ Swing Trading MT5
PZ TRADING SLU
5 (4)
Swing Trading es el primer indicador diseñado para detectar oscilaciones en la dirección de la tendencia y posibles oscilaciones de reversión. Utiliza el enfoque de intercambio de línea de base, ampliamente descrito en la literatura comercial. El indicador estudia varios vectores de precios y tiempos para rastrear la dirección de la tendencia agregada y detecta situaciones en las que el mercado está sobrevendido o sobrecomprado y listo para corregir. [ Guía de instalación | Guía de actualización
Este es posiblemente el indicador de reconocimiento automático de formación de precios más completo que puede encontrar para la plataforma MetaTrader. Detecta 19 patrones diferentes, toma las proyecciones de Fibonacci tan en serio como usted, muestra la zona de reversión potencial (PRZ) y encuentra niveles adecuados de stop-loss y take-profit. [ Guía de instalación | Guía de actualización | Solución de problemas | FAQ | Todos los productos ] Detecta 19 formaciones de precios armónicos difer
FX Volume MT5
Daniel Stein
4.93 (14)
Obtenga su actualización diaria del mercado con detalles y capturas de pantalla a través de nuestro Morning Briefing aquí en mql5 y en Telegram ! FX Volume es el PRIMER y ÚNICO indicador de volumen que proporciona una visión REAL del sentimiento del mercado desde el punto de vista de un bróker. Proporciona una visión impresionante de cómo los participantes institucionales del mercado, como los brokers, están posicionados en el mercado Forex, mucho más rápido que los informes COT. Ver esta info
Noize Absorption Index - is the manual trading system that measures the difference of pressure between bears forces and bulls forces. Green line - is a noize free index that showing curent situation. Zero value of index shows totally choppy/flat market.Values above zero level shows how powerfull bullish wave is and values below zero measures bearish forces.Up arrow appears on bearish market when it's ready to reverse, dn arrow appears on weak bullish market, as a result of reverse expectation.
¿Cansado de trazar líneas de soporte y resistencia? La resistencia de soporte es un indicador de marco de tiempo múltiple que detecta y traza automáticamente los soportes y las líneas de resistencia en el gráfico con un giro muy interesante: a medida que los niveles de precios se prueban con el tiempo y aumenta su importancia, las líneas se vuelven más gruesas y oscuras. [ Guía de instalación | Guía de actualización | Solución de problemas | FAQ | Todos los productos ] Mejora tu análisis técnic
Gold Trend 5
Sergei Linskii
5 (1)
Tendencia del oro : se trata de un buen indicador técnico bursátil. El algoritmo del indicador analiza el movimiento del precio de un activo y refleja la volatilidad y las posibles zonas de entrada. Las mejores señales del indicador: - Para VENTA = histograma rojo + puntero rojo CORTO + flecha amarilla de señal en la misma dirección. - Para COMPRA = histograma azul + puntero azul LARGO + flecha de señal aqua en la misma dirección. Ventajas del indicador: 1. El indicador produce seña
Este panel descubre y muestra las zonas de   Oferta   y   Demanda   en el gráfico, tanto en modo scalping como a largo plazo, dependiendo de su estrategia de trading para los símbolos seleccionados. Además, el modo de escáner del tablero le ayuda a comprobar todos los símbolos deseados de un vistazo y no perder ninguna posición adecuada /   Versión MT4 Indicador gratuito:   Basic Supply Demand Características Le permite ver las oportunidades de negociación en   múltiples pares de divisa
The Price Action Finder Multi indicator is an indicator of entry points that searches for and displays Price Action system patterns on dozens of trading instruments and on all standard time frames: (m1, m5, m15, m30, H1, H4, D1, Wk, Mn). The indicator places the found patterns in a table at the bottom of the screen. By clicking on the pattern names in the table, you can move to the chart where this pattern is located. Manual (Be sure to read before purchasing) | Version for MT4 Advantages 1. Pa
Gold ATR MTF: este es un excelente indicador técnico de acciones. El algoritmo del indicador ATR (Average True Range) analiza el movimiento del precio del activo y refleja la volatilidad dibujando los niveles correspondientes en porcentajes específicos (%) del precio de apertura del período de tiempo especificado (D1). Los indicadores (rojo y/o azul D1 H4) de la dirección del movimiento del precio del símbolo y las señales de flecha son ayudas adicionales y esenciales para una negociación y/o e
Stratos Pali mt5
Michela Russo
5 (1)
Stratos Pali Indicator is a revolutionary tool designed to enhance your trading strategy by accurately identifying market trends. This sophisticated indicator uses a unique algorithm to generate a complete histogram, which records when the trend is Long or Short. When a trend reversal occurs, an arrow appears, indicating the new direction of the trend. Important Information Revealed Leave a review and contact me via mql5 message to receive My Top 5 set files for Stratos Pali at no cost ! Do
Otros productos de este autor
Close Button
Wang Yu
4.79 (34)
如果产品有任何问题或者您需要在此产品上添加功能,请联系我 Contact/message me if you encounter any issue using the product or need extra feature to add on the base version. Close Button provides you an intuitive, effective, and handy way to close your orders based on their type. The utility provides seven close options: Close All: close all orders, including trading and pending ones. Close Profit: close all orders which are in profit. Close Loss: close all orders which are in loss. Close Stop: close all stop orders. Close
FREE
Close Button MT5
Wang Yu
2.29 (17)
如果产品有任何问题或者您需要在此产品上添加功能,请联系我 Contact/message me if you encounter any issue using the product or need extra feature to add on the base version. You can get the free Close Button MT4 version at LINK . Close Button provides you an intuitive, effective, and handy way to close your orders and/or positions based on their type and their profit status. The tool provides seven close options: Close All: close all pending orders and positions. Close Profit: close all positions which are in profit. Close
FREE
如果产品有任何问题或者您需要在此产品上添加功能,请联系我 Contact/message me if you encounter any issue using the product or need extra feature to add on the base version. PA Touching Alert is a tool to free you from watching price to touch certain critical price levels all day alone. With this tool, you can set two price levels: upper price and lower price, which should be greater than/less than the current price respectively. Then once price touches the upper price or lower price, alert and/or notification would be sent
FREE
如果产品有任何问题或者您需要在此产品上添加功能,请联系我 Contact/message me if you encounter any issue using the product or need extra feature to add on the base version. PA Touching Alert is a tool to free you from watching price to touch certain critical price level all day alone. With this tool, you can set two price levels: upper price and lower price, which should be greater than/ less than the current price respectively. Then once price touches the upper price or lower price, alert and/or notification would be sen
FREE
如果产品有任何问题或者您需要在此产品上添加功能,请联系我 Contact/message me if you encounter any issue using the product or need extra feature to add on the base version. Floating Highest Lowest MT5 provides you an intuitive and user-friendly method to monitor the floating highest (profit) and lowest (loss) that all your trades together ever arrive. For example, I opened 3 orders, which arrived at $4.71 floating profit when trade following trend. Later when the trend is against me, these 3 orders arrive $30 in loss, and
FREE
Contact/message me if you encounter any issue using the product or need extra feature to add on the base version. There is a demo version of this panel Dashboard Trading Made Simple Demo in my product list, please try it out to get familiar with all functionalities free, LINK . This system basically utilizes TDI as the main indicator to generate trading signal mainly on H1 and H4 timeframes. The signal will be further filtered and trimmed. Stochastic; Heiken Ashi candle direction and candle s
如果产品有任何问题或者您需要在此产品上添加功能,请联系我 Contact/message me if you encounter any issue using the product or need extra feature to add on the base version. Indicator Floating Highest Lowest provides you an intuitive, and user-friendly method to monitor the floating highest (profit) and lowest (loss) that all your trades together ever arrive. For example, I opened 3 orders, which arrived at $4.71 floating profit when trade following trend. Later when the trend is against me, these 3 orders arrive $30 in los
FREE
如果产品有任何问题或者您需要在此产品上添加功能,请联系我 Contact/message me if you encounter any issue using the product or need extra feature to add on the base version. Session TakeProfit StopLoss is basically helping to set the take profit and stop loss in dollar for the total open orders (session). Once the total profit is greater than session_tp or less than session_sl, the EA will help to close all open orders acting similarly to a take profit/stop loss for a single order. Inputs session_tp: session take profit s
FREE
By applying this expert onto any char window, you are able to force download the historical data upon all time-frame (PERIOD_M1, PERIOD_M5, PERIOD_M15, PERIOD_M30, PERIOD_H1, PERIOD_H4, PERIOD_D1, PERIOD_W1, PERIOD_MN1) of 28 major pairs. The 28 major pairs are the combination of the 8 major currencies. 8 major currencies "USD", "EUR", "GBP", "JPY", "AUD", "NZD", "CAD", "CHF" 28 pairs "AUDCAD","AUDCHF","AUDJPY","AUDNZD","AUDUSD","CADCHF","CADJPY" "CHFJPY","EURAUD","EURCAD","EURCHF","EURGBP",
FREE
如果产品有任何问题或者您需要在此产品上添加功能,请联系我 Contact/message me if you encounter any issue using the product or need extra feature to add on the base version. Session TakeProfit StopLoss is basically helping to set the take profit and stop loss in dollar for the total open orders (session). Once the total profit is greater than session_tp or less than session_sl, the EA will help to close all open orders acting similarly to a take profit/stop loss for a single order. Inputs session_tp: session take profit s
FREE
如果产品有任何问题或者您需要在此产品上添加功能,请联系我 Contact/message me if you encounter any issue using the product or need extra feature to add on the base version. To access the free demo version, please re-direct to this LINK . To access the single pair version, please re-direct to this LINK . Price is likely to pullback or breakout at important support and/or resistance. This dashboard is designed to help you monitor these critical support and resistance area. Once price moves close to these important support an
如果产品有任何问题或者您需要在此产品上添加功能,请联系我 Contact/message me if you encounter any issue using the product or need extra feature to add on the base version. Dashboard Super Candle is an intuitive, and handy graphic tool to help you to: Have 28 pairs under control with one dashboard. Monitor candle direction, identify possible price movement and trend. Provide trading signals based on the candle direction selected by you. Automatically manage order once signal are generated. Have the ability to select which
如果产品有任何问题或者您需要在此产品上添加功能,请联系我 Contact/message me if you encounter any issue using the product or need extra feature to add on the base version. There is Demo version of this panel Dashboard Super MA RSI CCI Demo in my product list, pls try it out to get familiar with all functionalities free . Dashboard Super MA RSI CCI is an intuitive, and handy graphic tool to help you to: Have 28 pairs under control with one dashboard Monitor price movement, identify possible trend based on MA, RSI, and CCI
如果产品有任何问题或者您需要在此产品上添加功能,请联系我 Contact/message me if you encounter any issue using the product or need extra feature to add on the base version. Critical Support and Resistance is an intuitive, and handy graphic tool to help you to monitor and manage critical support and resistance price point easily with one glance to know status of all important S&R. Price is likely to pullback or breakout at important support and/or resistance. This indicator is designed to help you monitor these critical sup
如果产品有任何问题或者您需要在此产品上添加功能,请联系我 Contact/message me if you encounter any issue using the product or need extra feature to add on the base version. Dashboard Super Currency Strength is an intuitive, and handy graphic tool to help you to: Have 28 pairs under control with one dashboard. Monitor price movement, identify possible trend based on currency strength gap of two currency on 3 timeframe. Provide trading signals based on the CSM (currency Strength Meter) selected. Manage order automatically on
如果产品有任何问题或者您需要在此产品上添加功能,请联系我 Contact/message me if you encounter any issue using the product or need extra feature to add on the base version. Please re-direct to LINK for free demo version. There are two critical components in a profitable trading system, one is entry (place an order), and another one is exit (close an order). You can exit by time: closing order after London Close for example. You can also exit by position: closing an order when price reaches a certain support/resistance leve
如果产品有任何问题或者您需要在此产品上添加功能,请联系我 Contact/message me if you encounter any issue using the product or need extra feature to add on the base version. There are two critical components in a profitable trading system. One is entry (placing an order) and another one is exit (closing an order). You can exit by time: closing order after London Close, for example. You can also exit by position: closing an order when price reaches a certain support/resistance level. Easy RR Monitor Panel is an intuitive, an
如果产品有任何问题或者您需要在此产品上添加功能,请联系我 Contact/message me if you encounter any issue using the product or need extra feature to add on the base version. There is a Demo version of this panel Dashboard Currency Strength Meter AdvancedDemo in my product list, please try it out to get familiar with all functionalities free, LINK . The Dashboard Currency Strength Meter Advanced gives you a quick visual guide to which currencies are strong, and which ones are weak over the customized 4 time-frames and period
如果产品有任何问题或者您需要在此产品上添加功能,请联系我 Contact/message me if you encounter any issue using the product or need extra feature to add on the base version. There is Demo version of this panel Dashboard Super Three MA Demo in my product list, please try it out to get familiar with all functionalities free, LINK . This system basically utilizes PA and three adjustable Moving Average as the main indicator set to generate trading signal. With the feature that all MA_timeframe, MA_period, MA_applied_price are a
如果产品有任何问题或者您需要在此产品上添加功能,请联系我 Contact/message me if you encounter any issue using the product or need extra feature to add on the base version. There is Demo version of this panel Dashboard Timeframe 15 Demo in my product list, please try it out to get familiar with all functionalities free, LINK . This system basically utilizes TDI as the core indicator to generate trading signal mainly on time-frame M15. The signal will be further filtered and trimmed by 1) 200 EMA and Price; 2) 10 EMA and He
如果产品有任何问题或者您需要在此产品上添加功能,请联系我 Contact/message me if you encounter any issue using the product or need extra feature to add on the base version. There is Demo version of this panel Dashboard Genesis Matrix Trading Demo in my product list, please try it out to get familiar with all functionalities free, LINK . This system basically utilizes Genesis Indi Set (TVI, CCI, GannHilo, and T3) as the core indicators to generate trading signal mainly on time-frame M15. The signal will be further filtered
如果产品有任何问题或者您需要在此产品上添加功能,请联系我 Contact/message me if you encounter any issue using the product or need extra feature to add on the base version. There is Demo version of this panel Dashboard Symphonie Trader System Demo in my product list, please try it out to get familiar with all functionalities free, LINK . This system basically utilizes Symphonie Indicator Set (Extreme, Emotion, Trend, and Sentiment) as the core indicators to generate trading signal mainly on time-frame M15. The signal will
如果产品有任何问题或者您需要在此产品上添加功能,请联系我 Contact/message me if you encounter any issue using the product or need extra feature to add on the base version. There is Demo version of this panel Dashboard Extreme TMA System Demo in my product list, please try it out to get familiar with all functionalities free, LINK . This system basically utilizes 4 TMA (Triangular Moving Average) slope indicators on 4 time-frame and TMA Band as the core indicators to generate trading signal mainly on time-frame M15. The si
如果产品有任何问题或者您需要在此产品上添加功能,请联系我 Contact/message me if you encounter any issue using the product or need extra feature to add on the base version. DIBS = Daily Inside Bar Setup This system basically utilizes the popular candle pattern Inside Bar to generate trading signal mainly on time-frame H1. To facilitate you to understand and trade this system quickly and effectively, the collection of PDF manuals and tips are provided in my latest comment of this product. For who cannot access Google Drive,
如果产品有任何问题或者您需要在此产品上添加功能,请联系我 Contact/message me if you encounter any issue using the product or need extra feature to add on the base version. This system basically utilizes two simple moving averages (10 SMA and 197 SMA) over 2 hours before Tokyo Open to generate trading signal mainly on timeframe H1. The signal will be further filtered by 1) M15 and M5 Fractals; 2) Stochastic To facilitate you to understand and trade this system quickly and effectively, the collection of PDF manuals and tip
如果产品有任何问题或者您需要在此产品上添加功能,请联系我 Contact/message me if you encounter any issue using the product or need extra feature to add on the base version. There is Demo version of this panel Dashboard Babon Scalping System Demo in my product list, please try it out to get familiar with all functionalities for free, LINK . This system basically utilizes TDI, Heiken Ashi Trend, Price Trend on H1 time-frame and TMA on H1&H4 time-frame to generate the trend (big picture). Then the system will zoom in to gener
This indicator helps to visualize the Bollinger Band status of 28 pairs. With the feature of color panel, alert, and notification features, user can catch the potential Bollinger Bounce opportunities from 28 main pairs on one Dashboard quickly. Dashboard Bollinger Band is an intuitive and handy graphic tool to help you to monitor all 28 pairs and provide trading signals based on the Bollinger Bounce Rules (Overbought/Oversold and Bollinger Band Cross). COLOR LEGEND: clrOrange: price is above th
This indicator helps to visualize the Stochastic status of 28 pairs. With the feature of color panel, alert, and notification features, user can catch the potential buy and sell opportunities when the 28 main pairs cross the oversold/overbought area on one Dashboard quickly. Dashboard Stochastic is an intuitive and handy graphic tool to help you to monitor all 28 pairs and provide trading signals based on the Stochastic Classic Rules (Overbought/Oversold and Stochastic Cross). COLOR LEGEND:
This indicator helps to visualize the RSI status of 28 pairs. With the feature of color panel, alert, and notification features, user can catch the potential buy and sell opportunities when the 28 main pairs cross the oversold/overbought area on one Dashboard quickly. Dashboard RSI is an intuitive and handy graphic tool to help you to monitor all 28 pairs and provide trading signals based on the RSI Rules (Overbought/Oversold and Stochastic Cross). COLOR LEGEND: clrOrange: RSI signal is above t
This indicator helps to visualize the MACD status of 28 pairs. With the feature of color panel, alert, and notification features, user can catch the potential buy and sell opportunities when the 28 main pairs’ fast EMA cross the slow EMA on one Dashboard quickly. Dashboard MACD is an intuitive and handy graphic tool to help you to monitor all 28 pairs and provide trading signals based on the MACD Rules (Fast EMA Cross Slow). COLOR LEGEND: clrRed: MACD fast EMA down cross MACD slow EAM and MACD f
Filtro:
No hay comentarios
Respuesta al comentario
Versión 1.1 2021.11.23
Release with the latest build 3110, 19-Nov-2021