• Información general
  • Comentarios
  • Discusión (4)
  • Novedades

Volatility Line Signals

El indicador desarrollado para el comercio utiliza la volatilidad del mercado, lo que le permite predecir los movimientos de precios desde el principio.
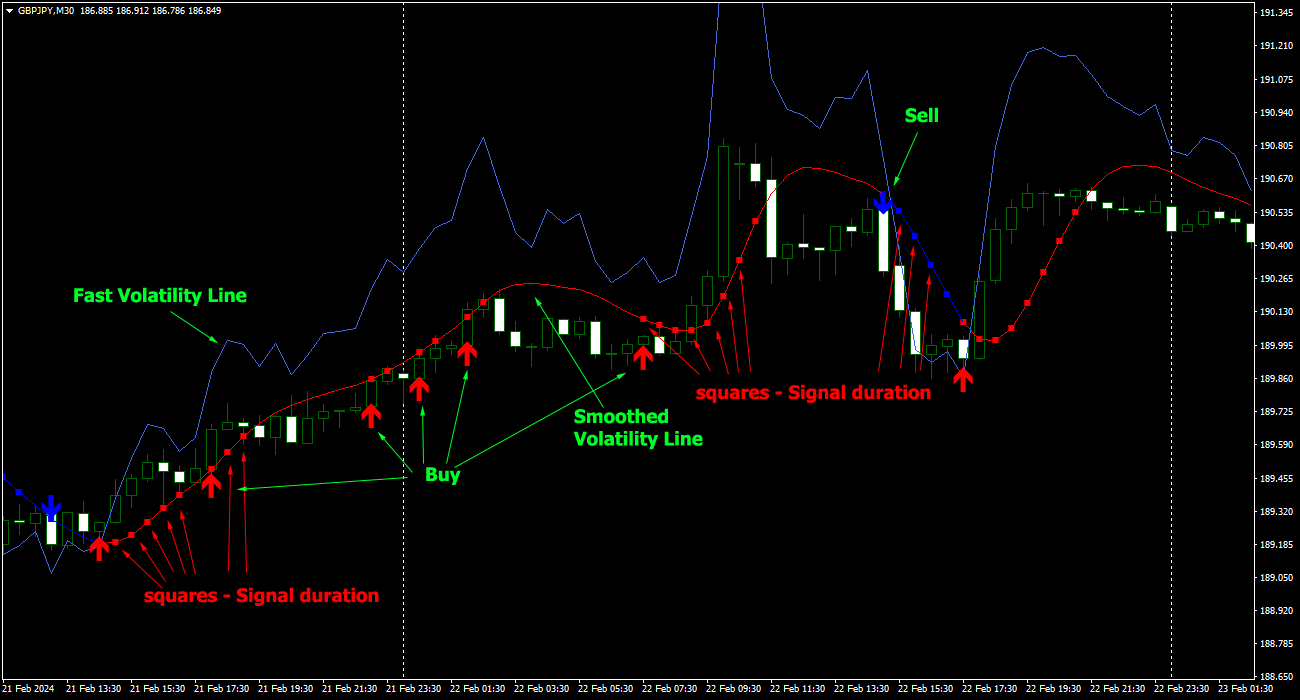
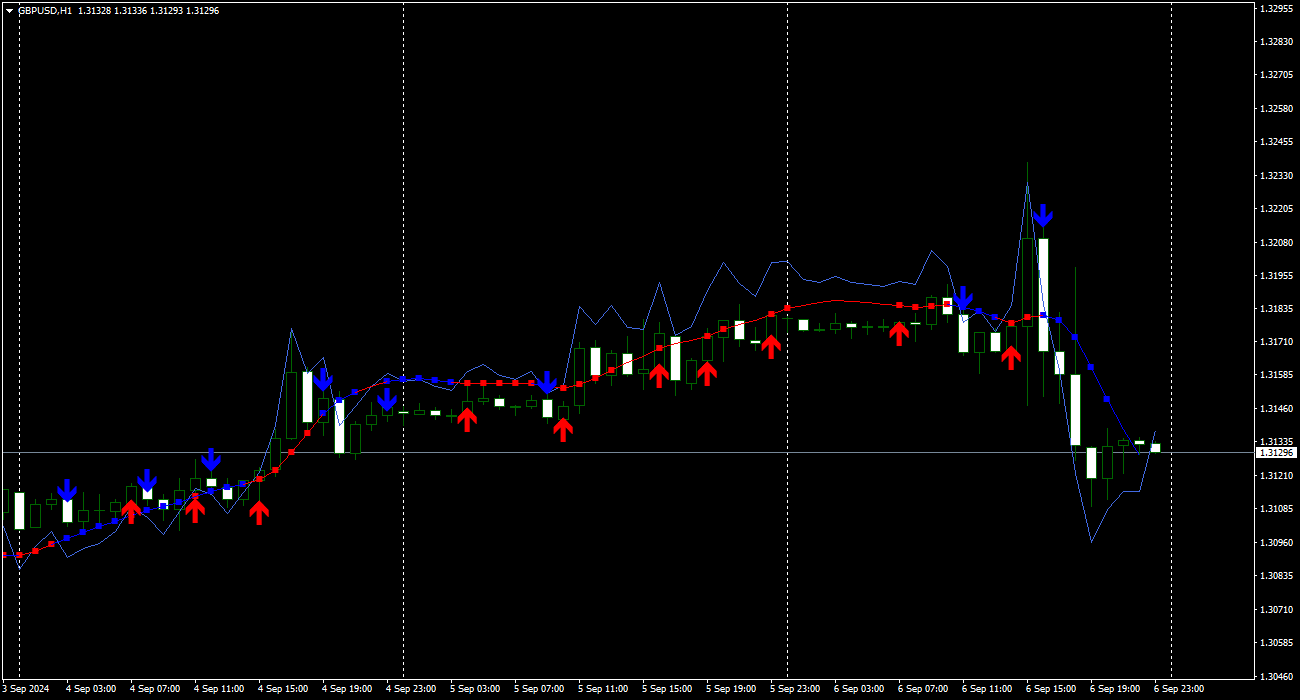
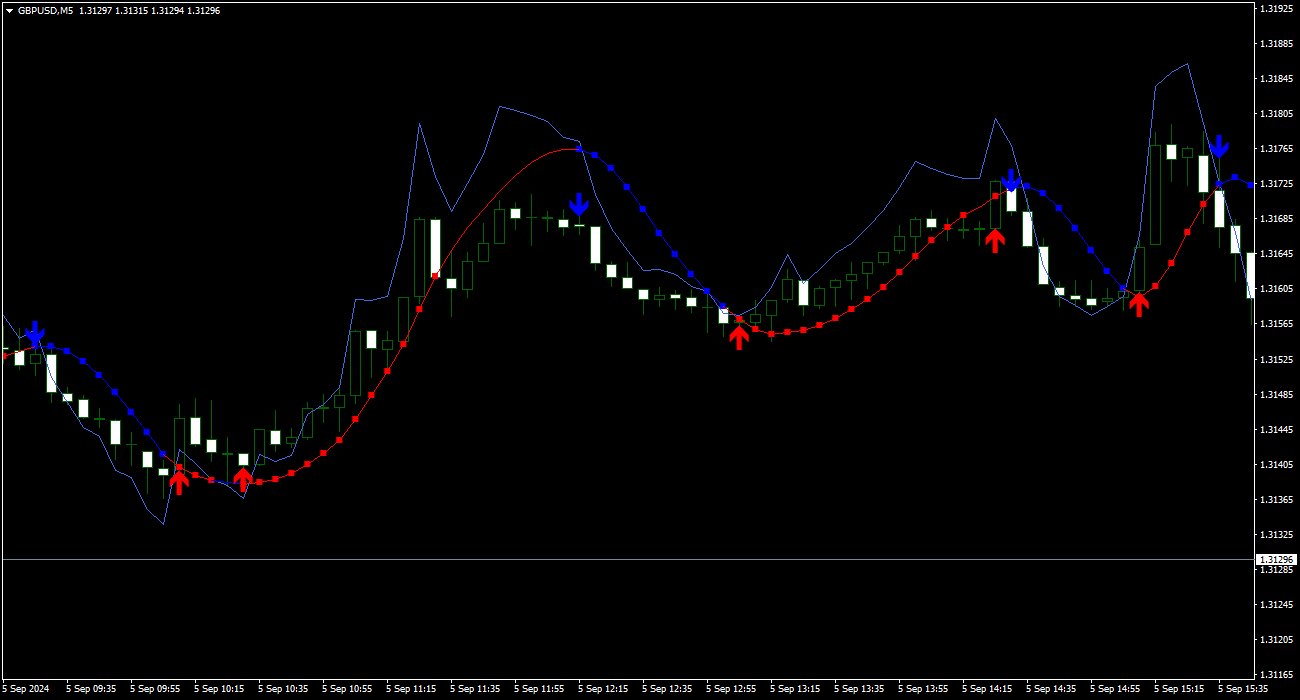
Al leer la volatilidad y el impulso de los precios, construye dos líneas, rápidas y suaves. Cuando la línea rápida cruza la línea suave, el movimiento de tendencia cambia.
Las señales no aparecen en el momento en que se cruzan las líneas, sino con un indicador adicional generado por un generador de señales basado en el movimiento de la línea rápida.
Si la línea rápida está por encima de la línea suavizada, la tendencia es alcista, si la línea rápida está por debajo de la línea suavizada, la tendencia es bajista.
La flecha de señal aparece en el momento en que se cierra la vela y nunca desaparecerá ni se completará en la vela anterior.
Después de la formación de las flechas de señal, el indicador monitorea la duración de esta señal, dibujando cuadrados en la línea suavizada a medida que se mueve el precio. Cuando los cuadrados dejan de aparecer, se produce el final de la señal.

Descripción

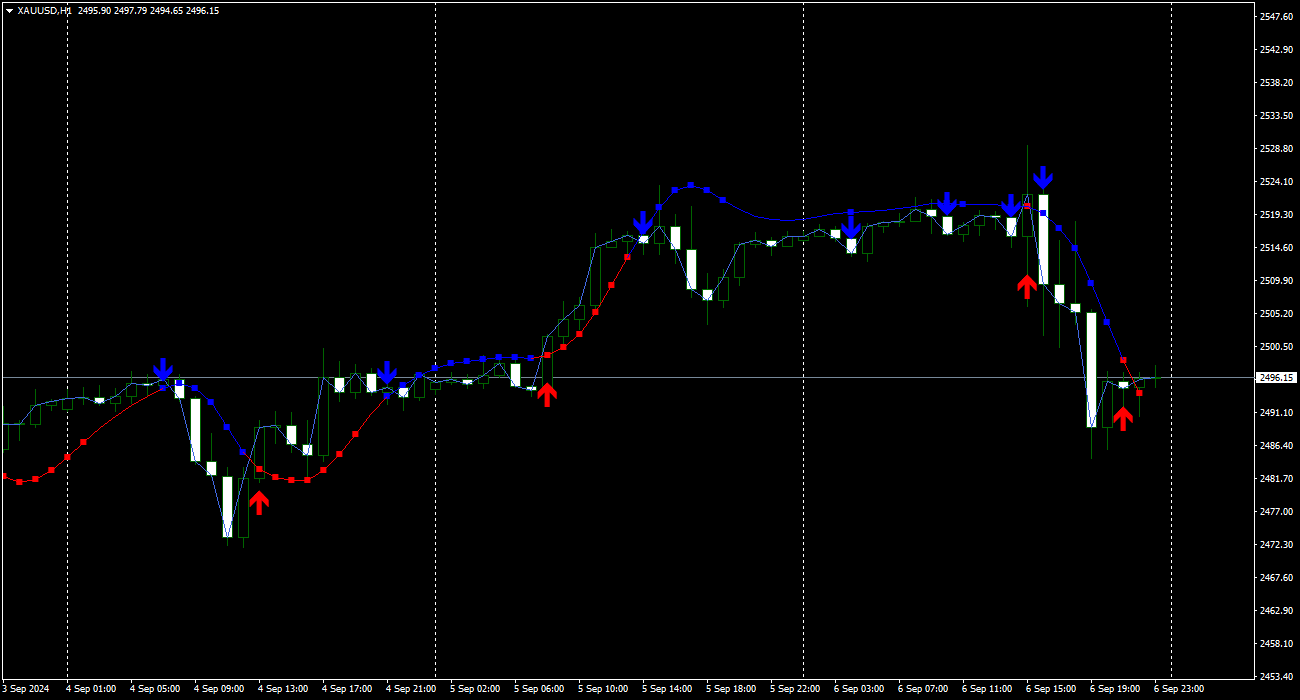
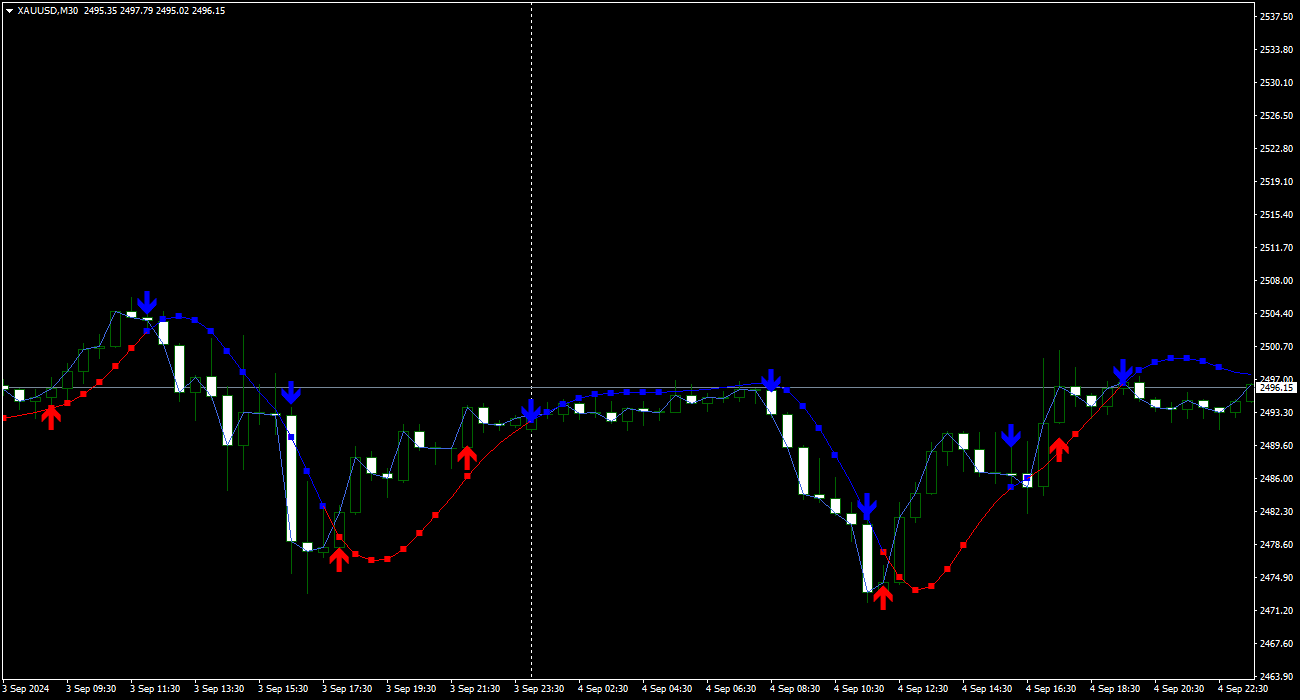
  •  El indicador incluye una línea guía azul, azul o roja dependiendo de la dirección de la línea.
  •  Para que el indicador funcione correctamente, es necesario configurar correctamente el primer parámetro " Adjustment for volatility ", el valor predeterminado es 1, es adecuado para las principales monedas: EURUSD, GBPUSD y algunas otras. Para EURJPY necesitas establecer 4, para GOLD 5, puedes usar volatilidad reducida. para otros instrumentos comerciales, debe seleccionar usted mismo el nivel de volatilidad para que el indicador se parezca al EURUSD.
  •  El parámetro " Smoothed line period " cambia la suavidad y duración de las líneas roja y azul. Cambie cuando se mueva a través de marcos de tiempo, use un número mayor para los más jóvenes y un número menor para los mayores.
  •  El parámetro " Signal sensitivity " regula la formación de la flecha de señal y la duración de la señal después de ella, para el especulación, seleccione un número menor y para el comercio intradiario, uno mayor;
  •  Los parámetros de entrada le permiten configurar el indicador para cualquier instrumento comercial y período de tiempo.
  •  Las flechas de señal funcionan sin necesidad de repintar y tienen varios tipos de alertas.


Productos recomendados
Owl smart levels
Sergey Ermolov
4.34 (35)
Versión MT5  |   FAQ El   Indicador Owl Smart Levels   es un sistema comercial completo dentro de un indicador que incluye herramientas de análisis de mercado tan populares como   los fractales avanzados de Bill Williams , Valable ZigZag que construye   la estructura de onda correcta   del mercado y   los niveles de Fibonacci   que marcan los niveles exactos de entrada. en el mercado y lugares para tomar ganancias. Descripción detallada de la estrategia Instrucciones para trabajar con el indi
Blahtech Market Profile
Blahtech Limited
4.56 (16)
Was: $249  Now: $99   Market Profile defines a number of day types that can help the trader to determine market behaviour. A key feature is the Value Area, representing the range of price action where 70% of trading took place. Understanding the Value Area can give traders valuable insight into market direction and establish the higher odds trade. It is an excellent addition to any system you may be using. Blahtech Limited presents their Market Profile indicator for the MetaTrader community. Ins
Daily Candle Predictor es un indicador que predice el precio de cierre de una vela. El indicador está destinado principalmente para su uso en gráficos D1. Este indicador es adecuado tanto para el comercio de divisas tradicional como para el comercio de opciones binarias. El indicador se puede utilizar como un sistema de negociación independiente o puede actuar como una adición a su sistema de negociación existente. Este indicador analiza la vela actual, calculando ciertos factores de fuerza dent
VR Cub
Vladimir Pastushak
VR Cub es un indicador para obtener puntos de entrada de alta calidad. El indicador fue desarrollado para facilitar los cálculos matemáticos y simplificar la búsqueda de puntos de entrada a una posición. La estrategia comercial para la cual se diseñó el indicador ha demostrado su eficacia durante muchos años. La simplicidad de la estrategia comercial es su gran ventaja, que permite que incluso los operadores novatos negocien con éxito con ella. VR Cub calcula los puntos de apertura de posiciones
Super Reversal Pattern
Parfait Mujinga Ndalika
Super Reversal Pattern Indicator Unlock the power of advanced pattern recognition with our Super Reversal Pattern Indicator. Designed for traders seeking precision and reliability, this indicator identifies one of the most effective reversal patterns in technical analysis, offering a significant edge in your trading strategy. Key Features: Non-Repainting Accuracy: Enjoy the confidence of non-repainting technology. Once a Super Reversal Pattern is detected, it remains static, providing consis
The Th3Eng PipFinite indicator is based on a very excellent analysis of the right trend direction with perfect custom algorithms. It show the true direction and the best point to start trading. With StopLoss point and Three Take Profit points. Also it show the right pivot of the price and small points to order to replace the dynamic support and resistance channel, Which surrounds the price. And Finally it draws a very helpful Box on the left side on the chart includes (take profits and Stop loss
Indicador Perfil de Volumen para MT4 Obtén una ventaja en el trading con el indicador "Perfil de Volumen" para MetaTrader 4 (MT4). Esta herramienta avanzada de análisis técnico te permite identificar con precisión niveles clave de soporte y resistencia basados en el volumen de transacciones. Visualiza fácilmente las áreas de mayor interés del mercado, donde los volúmenes de negociación son más altos, y utiliza esta información para tomar decisiones de trading más informadas. Características prin
Noize Absorption Index MT4
Ekaterina Saltykova
5 (1)
Noize Absorption Index - is the manual trading system that measures the difference of pressure between bears forces and bulls forces. Green line - is a noize free index that showing curent situation. Zero value of index shows totally choppy/flat market.Values above zero level shows how powerfull bullish wave is and values below zero measures bearish forces.Up arrow appears on bearish market when it's ready to reverse, dn arrow appears on weak bullish market, as a result of reverse expectation. S
Infinity Trend Pro
Yaroslav Varankin
1 (1)
This is a trend indicator without redrawing Developed instead of the binary options strategy (by the color of the Martingale candlestick) Also works well in forex trading When to open trades (binary options) A signal will appear in the place with a candle signaling the current candle It is recommended to open a deal for one candle of the current timeframe M1 and M5 When a blue dot appears, open a deal up When a red dot appears, open a trade down. How to open trades on Forex. When a signal is rec
Title : Market Bias Indicator - Oscillator-Based Trading Tool Introduction : Discover the potential of the "Market Bias Indicator," a revolutionary oscillator-based trading tool designed for precise market analysis. If you're in search of a robust alternative to traditional bias indicators, your quest ends here. Market Bias Indicator offers unparalleled accuracy in identifying market sentiment and is your gateway to confident trading decisions. Recommended Trading Pairs : Market Bias Indicator i
Zig Zag 123
Stephen Reynolds
Zig Zag 123 tells us when a reversal or continuation is more likely by looking at the shift in supply and demand. When this happens a signature pattern appears known as 123 (also known ABC) will often break out in direction of higher low or lower high. Stop loss and take profit levels have been added. There is a panel that shows the overall performance of your trades for if you was to use these stop loss and take profit levels.  We get alerted if a pattern 123 appears and also if the price
It will be the best tool for you to make a profit! Through unique algorithms You're going to see an amazing amount of right trading signals Make huge profits every day and realize more possibilities!   Like the car no money to buy it, the love of the girls dare not to pursue?Or the credit card bill is not paid, the rent does not have the extra money to settle?Or are you fed up with being bossed around by your boss and Hope to get more people's respect?Can't afford to buy the things you want ? wa
Heiken Ashi candle chart is an improved version of The Japanese candle chart, which can effectively filter the market "noise" of the Japanese candle chart. It is favored by many traders for its simplicity and intuition. For trend traders, the HA candle chart is a magic tool. Unlike the traditional Japanese candle chart, Heikenashi does not reflect the opening price, high price, low price and closing price of the market. Instead, Heikenashi calculates the value of a single K line in the dominant
Insider Scalper Binary This tool is designed to trade binary options. for short temporary spends. to make a deal is worth the moment of receiving the signal and only 1 candle if it is m1 then only for a minute and so in accordance with the timeframe. for better results, you need to select well-volatile charts.... recommended currency pairs eur | usd, usd | jpy .... the indicator is already configured, you just have to add it to the chart and trade .... The indicator signals the next can
CyberZingFx Trend Reversal
Afsal Meerankutty
4.18 (17)
Indicator captures the trend reversals with no-repaint Buy and Sell Arrow signals. CyberZingFx Trend Reversal Indicator - your go-to solution for accurate and reliable trend reversal signals. With its  advanced trading strategy , the indicator offers you Buy and Sell Arrow signals that do not repaint, making it a reliable tool for catching Swing Highs and Swing Lows in any market and any time frame. Indicator works on  any market  and  any time frames . __________________________________________
Introduction It is common practice for professional trades to hide their stop loss / take profit from their brokers. Either from keeping their strategy to the themselves or from the fear that their broker works against them. Using this indicator, the stop loss / take profit points will be drawn on the product chart using the bid price. So, you can see exactly when the price is hit and close it manually.  Usage Once attached to the chart, the indicator scans the open orders to attach lines fo
Trend Divergence Finder – индикатор, позволяющий выявлять дивергенции цены и графика выбранного индикатора. С помощью Trend Divergence Finder вы сможете подобрать тот индикатор, который наиболее эффективен для Вас, и использовать его с наглядным отображением на графике. В индикатор включены 9 базовых индикаторов : 1.        RSI 2.        MACD 3.        MOMENTUM 4.        RVI 5.        STOCHASTIC 6.        CCI 7.        Standard Deviation 8.        Derivative 9.        William Blau Присутст
Trendiness Index
Libertas LLC
5 (3)
"The trend is your friend" is one of the best known sayings in investing, because capturing large trendy price movements can be extremely profitable. However, trading with the trend is often easier said than done, because many indicators are based on price reversals not trends. These aren't very effective at identifying trendy periods, or predicting whether trends will continue. We developed the Trendiness Index to help address this problem by indicating the strength and direction of price trend
An indicator of pattern #31 ("Long Island") from Encyclopedia of Chart Patterns by Thomas N. Bulkowski. The second gap is in the opposite direction. Parameters: Alerts - show alert when an arrow appears   Push - send a push notification when an arrow appears (requires configuration in the terminal) GapSize - minimum gap size in points ArrowType - a symbol from 1 to 17 ArrowVShift - vertical shift of arrows in points   ShowLevels - show levels ColUp - color of an upward line ColDn - color of
Line Magnit
Aleksey Trenin
The LineMagnit Indicator for MT4 is a highly precise tool that builds support and resistance levels which magnetically attract prices. This feature allows traders to easily determine the most probable entry and exit points in the market, as well as identify the market's directional forces, as levels are based on capital inflows into the instrument. Equipped with an intuitively understandable graphical interface, the LineMagnit Indicator enables users to quickly locate and analyze support and res
The indicator analyzes the change in the minimum and maximum prices of the previous bars fixing the entrance of the big players. If the change (delta) increases, a signal is displayed on the graph in the form of an arrow. At the same time, virtual trade on history is carried out. In case of a repeat of the signal, the positions are increased (refilling). Thus the lot of positions can differ. The results of virtual trading in the form of losses / losses, profitability, drawdown and transaction li
Retroceso de Fibonacci & Herramientas de Dibujo de Líneas Extendidas Retroceso de Fibonacci & Herramientas de Dibujo de Líneas Extendidas son aptos para la plataforma MT4 y para operadores que emplean el método de negociación de puntos y la negociación de sección áurea. Ventajas: Sin líneas excusadas ni las excesivamente largas, y es fácil de observar y descubrir oportunidades de negociación. Versión de prueba: https://www.mql5.com/zh/market/product/35884 Funciones principales: 1.
The Chaikin Oscillator is a technical indicator developed by Marc Chaikin that combines price and volume data to measure the accumulation and distribution of a financial instrument. It aims to identify potential buying and selling opportunities in the market. The Chaikin Oscillator is calculated by subtracting a 10-day exponential moving average of the Accumulation Distribution Line (ADL) from a 3-day exponential moving average of the ADL. Here's how to use the Chaikin Oscillator indicator in tr
BoxChart MT4
Evgeny Shevtsov
4.5 (6)
The market is unfair if only because 10% of participants manage 90% of funds. An ordinary trader has slim changes to stand against these "vultures". This problem can be solved. You just need to be among these 10%, learn to predict their intentions and move with them. Volume is the only preemptive factor that faultlessly works on any timeframe and symbol. First, the volume appears and is accumulated, and only then the price moves. The price moves from one volume to another. Areas of volume accumu
Trend Bilio - an arrow indicator without redrawing shows potential market entry points in the form of arrows of the corresponding color: upward red arrows suggest opening a buy, green down arrows - selling. The entrance is supposed to be at the next bar after the pointer. The arrow indicator Trend Bilio visually "unloads" the price chart and saves time for analysis: no signal - no deal, if an opposite signal appears, then the current deal should be closed. It is Trend Bilio that is considered
Power Renko is an indicator which plots Renko bricks underneath the chart using a histogram. You can select the brick size and the timeframe of the Renko bricks as well as whether or not to use the close price or the high/low price of the candles. Renko bricks are based on price alone, not time, therefor the Renko bricks will not be aligned with the chart's time. They are extremely useful for trend trading and many different strategies can be formed from them. Buffers are provided allowing you t
Point61 Indicator
Evgeniy Machok
5 (1)
The Point61 indicator is the result of many years of monitoring of price behavior of currency pairs and metals. It is not a secret, that in times of uncertainty, traders are looking for possible levels of support and resistance - the point, where price should stop its movement. There are 2 possible scenarios at these points: 1. Reverse (correction) to the opposite direction; 2. Breakthrough to continue movement. Very often these points are used to set stop orders - TakeProfit or
Binary Options Support Resistance Indicator This indicator is designed for binary options trading and effectively shows retracements from support and resistance levels. Signals appear on the current candle. A red arrow pointing downwards indicates a potential selling opportunity, while a blue arrow pointing upwards suggests buying opportunities. All that needs adjustment is the color of the signal arrows. It is recommended to use it on the M1-M5 timeframes as signals are frequent on these timef
The Penta-O is a 6-point retracement harmonacci pattern which usually precedes big market movements. Penta-O patterns can expand and repaint quite a bit. To make things easier this indicator implements a twist: it waits for a donchian breakout in the right direction before signaling the trade. The end result is an otherwise repainting indicator with a very reliable trading signal. The donchian breakout period is entered as an input. [ Installation Guide | Update Guide | Troubleshooting | FAQ | A
What are Heiken Ashi Candles? Heiken Ashi, derived from the Japanese term 'Heikin Ashi,' translates to average price bars. It's an indicator depicting price bars on a chart. Formula for Heiken Ashi candles: - Heiken Ashi opening price: (previous candle's opening + closing price) / 2 - Closing price Heiken Ashi: (opening + high + low + closing) / 4 - Heiken Ashi peak: Max of high, opening, or closing price - Heiken Ashi bottom price: Min of low, opening, or closing price How to Read Heik
Los compradores de este producto también adquieren
Atomic Analyst
Issam Kassas
5 (2)
En primer lugar, vale la pena enfatizar que este Indicador de Trading no repinta, no redibuja y no se retrasa, lo que lo hace ideal tanto para el trading manual como para el automatizado. Manual del usuario: configuraciones, entradas y estrategia. El Analista Atómico es un Indicador de Acción del Precio PA que utiliza la fuerza y el impulso del precio para encontrar una mejor ventaja en el mercado. Equipado con filtros avanzados que ayudan a eliminar ruidos y señales falsas, y aumentan el poten
Enigmera
Ivan Stefanov
5 (3)
ENIGMERA: El núcleo del mercado https://www.enigmera.com Introducción Este indicador y sistema de negociación es un enfoque extraordinario de los mercados financieros. ENIGMERA utiliza los ciclos fractales para calcular con precisión los niveles de soporte y resistencia. Muestra la auténtica fase de acumulación y proporciona dirección y objetivos.  Un sistema que funciona tanto si estamos en una tendencia como en una corrección.  ¿Cómo funciona? ENIGMERA consta de tres líneas: la línea de s
Scalper Inside PRO
Alexey Minkov
4.73 (56)
An exclusive indicator that utilizes an innovative algorithm to swiftly and accurately determine the market trend. The indicator automatically calculates opening, closing, and profit levels, providing detailed trading statistics. With these features, you can choose the most appropriate trading instrument for the current market conditions. Additionally, you can easily integrate your own arrow indicators into Scalper Inside Pro to quickly evaluate their statistics and profitability. Scalper Inside
TPSpro RFI Levels
Roman Podpora
4.82 (22)
INSTRUCCIONES      RUSO  -  ING     Se recomienda utilizar con un indicador.   -    TPSpro   TENDENCIA PRO -   Versión MT5 Un elemento clave en el trading son las zonas o niveles desde los que se toman las decisiones de compra o venta de un instrumento de trading. A pesar de los intentos de los principales actores de ocultar su presencia en el mercado, inevitablemente dejan rastros. Nuestra tarea era aprender a identificar estos rastros e interpretarlos correctamente. Funciones principales: ¡Mo
Dynamic Forex28 Navigator: la herramienta de trading de Forex de última generación. ACTUALMENTE CON UN 49 % DE DESCUENTO. Dynamic Forex28 Navigator es la evolución de nuestros indicadores populares de larga data, que combina el poder de tres en uno: Indicador avanzado Currency Strength28 (695 reseñas) + Indicador avanzado Currency IMPULSE con ALERT (520 reseñas) + Señales combinadas CS28 (bonificación). Detalles sobre el indicador https://www.mql5.com/en/blogs/post/758844 ¿Qué ofrece el i
TPSproTREND PrO
Roman Podpora
4.79 (19)
TPSpro TREND PRO   es un indicador de tendencia que analiza automáticamente el mercado y proporciona información sobre la tendencia y cada uno de sus cambios, además de dar señales para ingresar operaciones sin volver a dibujar. El indicador utiliza cada vela, analizándolas por separado. refiriéndose a diferentes impulsos: impulso hacia arriba o hacia abajo. ¡Puntos de entrada exactos a transacciones de divisas, criptomonedas, metales, acciones e índices! Versión MT5                   DESCRIPCI
¡Actualmente 20% OFF ! ¡La mejor solución para cualquier novato o trader experto! Este software funciona con 28 pares de divisas. Se basa en 2 de nuestros principales indicadores (Advanced Currency Strength 28 y Advanced Currency Impulse). Proporciona una gran visión general de todo el mercado de divisas. Muestra los valores de Advanced Currency Strength, la velocidad de movimiento de las divisas y las señales para 28 pares de divisas en todos los (9) marcos temporales. Imagine cómo mejorar
MetaBands M4
Vahidreza Heidar Gholami
5 (2)
MetaBands utiliza algoritmos potentes y únicos para dibujar canales y detectar tendencias para que pueda proporcionar a los traders puntos potenciales para entrar y salir de operaciones. Es un indicador de canal junto con un potente indicador de tendencia. Incluye diferentes tipos de canales que se pueden fusionar para crear nuevos canales simplemente utilizando los parámetros de entrada. MetaBands utiliza todos los tipos de alertas para notificar a los usuarios sobre eventos del mercado. Caract
TrendMaestro
Stefano Frisetti
5 (3)
note: this indicator is for METATRADER4, if you want the version for METATRADER5 this is the link:  https://www.mql5.com/it/market/product/108106 TRENDMAESTRO ver 2.4 TRENDMAESTRO recognizes a new TREND in the bud, he never makes mistakes. The certainty of identifying a new TREND is priceless. DESCRIPTION TRENDMAESTRO identifies a new TREND in the bud, this indicator examines the volatility, volumes and momentum to identify the moment in which there is an explosion of one or more of these data a
Ultimate Gold Advisor para MetaTrader 4 – ¡Tu Herramienta de Trading de Vanguardia para el Éxito Garantizado! Ultimate Gold Advisor es mucho más que un simple indicador: es la joya tecnológica que revolucionará tu enfoque en el trading con MetaTrader 4. Diseñado para satisfacer las necesidades de los traders más exigentes, este avanzado indicador combina precisión quirúrgica, análisis sofisticado y potentes funciones para ofrecerte una ventaja competitiva inigualable en los mercados. Perfecto pa
FX Volume
Daniel Stein
4.58 (33)
Obtenga su actualización diaria del mercado con detalles y capturas de pantalla a través de nuestro Morning Briefing aquí en mql5 y en Telegram ! FX Volume es el PRIMER y ÚNICO indicador de volumen que proporciona una visión REAL del sentimiento del mercado desde el punto de vista de un bróker. Proporciona una visión impresionante de cómo los participantes institucionales del mercado, como los brokers, están posicionados en el mercado Forex, mucho más rápido que los informes COT. Ver esta info
Entry Points Pro
Yury Orlov
4.62 (175)
Este es un genial indicador para MT4 que ofrece señales precisas para entrar en una transacción sin redibujar. Se puede aplicar a cualquier activo financiero: fórex, criptomonedas, metales, acciones, índices. Nos dará valoraciones bastante precisas y nos dirá cuándo es mejor abrir y cerra una transacción. Eche un vistazo  al vídeo  (6:22), ¡contiene un ejemplo de procesamiento de una sola señal que ha amortizado el indicador! La mayoría de los tráders mejoran sus resultados comerciales durante l
Quantum Breakout Indicator PRO
Bogdan Ion Puscasu
4.96 (25)
Introduciendo       Quantum Breakout PRO   , el innovador indicador MQL5 que está transformando la forma en que comercia con Breakout Zones. Desarrollado por un equipo de operadores experimentados con experiencia comercial de más de 13 años,   Quantum Breakout PRO   está diseñado para impulsar su viaje comercial a nuevas alturas con su innovadora y dinámica estrategia de zona de ruptura. El indicador de ruptura cuántica le dará flechas de señal en las zonas de ruptura con 5 zonas objetivo de
Order Block Hunter
Noha Mohamed Fathy Younes Badr
5 (6)
Order block hunter indicator is the best indicator for  hunt the order blocks that area where there has been a large concentration of limit orders waiting to be executed Order blocks are identified on a chart by observing previous price action and looking for areas where the price experienced significant movement or sudden changes in direction .This indicator does that for you by using very complicated codes and helps you to take the best areas To buy and sell because it make marks at the best a
Best Currency Strength Indicator
Tumelo Patrick Rakotsoane
4.59 (46)
Advanced Currency Strength Indicator The Advanced Divergence Currency Strength Indicator. Not only it breaks down all 28 forex currency pairs and calculates the strength of individual currencies across all timeframes , but, You'll be analyzing the WHOLE forex market in 1 window (In just 1 minute) . This indicator is very powerful because it reveals the true movements of the market.  It is highly recommended to  analyze charts knowing the performance of individual currencies or the countries ec
Allows multiple indicators to be combined into a single indicator, both visually and in terms of an alert. Indicators can include standard indicators, e.g. RSI, CCI, etc., and also Custom Indicators, even those purchased through Market, or where just have the ex4 file. An early alert is provided, say when 4 out 5 indicators have lined up, and a confirmed alert when all are in agreement. A‌lso features a statistics panel reporting the success of the combined indicator by examining the current cha
Currency Strength Exotics
Bernhard Schweigert
4.87 (30)
¡ACTUALMENTE 20% DE DESCUENTO ! ¡La mejor solución para cualquier operador novato o experto! Este indicador está especializado en mostrar la fuerza de la divisa para cualquier símbolo como Pares Exóticos, Materias Primas, Índices o Futuros. Es el primero de su clase, cualquier símbolo se puede añadir a la 9 ª línea para mostrar la verdadera fuerza de la moneda de Oro, Plata, Petróleo, DAX, US30, MXN, TRY, CNH etc. Se trata de una herramienta de trading única, de alta calidad y asequible por
Precautions for subscribing to indicator This indicator only supports the computer version of MT4 Does not support MT5, mobile phones, tablets The indicator only shows the day's entry arrow The previous history arrow will not be displayed (Live broadcast is for demonstration) The indicator is a trading aid Is not a EA automatic trading No copy trading function The indicator only indicates the entry position No exit (target profit)  The entry stop loss point is set at 30-50 PIPS Or the front
NAM Order Blocks
NAM TECH GROUP, CORP.
5 (1)
Indicador de detección de Order Blocks multitimeframe para MT4. Características - Panel de control totalmente personalizable, proporciona una interacción completa. - Oculta y muestra el panel de control donde quieras. - Detecta OB en múltiples marcos de tiempo. - Permite seleccionar la cantidad de OB para mostrar. - Interfaz de usuario de diferentes OBs. - Diferentes filtros de OBs (regulares, rejection y sin capitalizar). - Alerta de proximidad de OBs. - Líneas ADR High y Low. - Servicio de not
Harmonic Papallons
Ramon Sobrevals Arce
3.33 (3)
Escanea automáticamente el gráfico para encontrar patrones armónicos y le da la oportunidad de entrar temprano en buenas operaciones. Además, si se selecciona, te avisará con antelación cuando aparezcan patrones futuros, mostrándote una proyección de un posible patrón futuro. El objetivo principal   de este algoritmo es determinar con alta precisión el momento en que termina una tendencia y comienza una nueva. Dándote   el mejor precio dentro de una reversión.     Hemos agregado el "Comercio D
Gold Channel is a volatility-based indicator, developed with a specific timing algorithm for the XAUUSD pair, which consists of finding possible corrections in the market. This indicator shows two outer lines, an inner line (retracement line) and an arrow sign, where the theory of the channel is to help identify overbought and oversold conditions in the market. The market price will generally fall between the boundaries of the channel. If prices touch or move outside the channel it is a tra
The Forex indicator   TrendNavigator   is a technical indicator. TrendNavigator is a tool that allows traders employing this strategy to better understand what is happening in the market and predict in which direction the price will continue to move. The indicator's values are calculated based on price movements of the currency pair or any other financial asset. Within the scope of technical analysis, the TrendNavigator indicator is used by traders to forecast future price values or the overall
Royal Scalping Indicator M4
Vahidreza Heidar Gholami
4.17 (6)
Royal Scalping Indicator is an advanced price adaptive indicator designed to generate high-quality trading signals. Built-in multi-timeframe and multi-currency capabilities make it even more powerful to have configurations based on different symbols and timeframes. This indicator is perfect for scalp trades as well as swing trades. Royal Scalping is not just an indicator, but a trading strategy itself. Features Price Adaptive Trend Detector Algorithm Multi-Timeframe and Multi-Currency Trend Low
Royal Wave Pro M4
Vahidreza Heidar Gholami
5 (3)
Royal Wave is a Trend-Power oscillator which has been programmed to locate and signal low-risk entry and exit zones. Its core algorithm statistically analyzes the market and generates trading signals for overbought, oversold and low volatile areas. By using a well-designed alerting system, this indicator makes it easier to make proper decisions regarding where to enter and where to exit trades. Features Trend-Power Algorithm Low risk Entry Zones and Exit Zones Predictions for Overbought and Over
KT Day Trading MT4
KEENBASE SOFTWARE SOLUTIONS
KT Day Trading MT4 provides simplified Buy and Sell signals using a combination of some specific candlestick patterns occurring in the market exhaustion zones. These signals are designed to identify market reversals and entry/exit points. The indicator can be used to trade on any timeframe from the 1 Minute up to the Daily chart. Features Three types of entry signals according to the market structure i.e. Trend following, Range bound, and Counter trend signals. Crystal clear Entry, Stop-L
Beast Indicator V7
Mohamed Ahmed Sh Muhumed
Step into the future of automated trading with the Beast Indicator V7, The indicator allows you to trade binary options. T his indicator give high winning ratio with over 20 years of backtesting  an unparalleled tool that seamlessly transforms your trading journey into an effortless and lucrative venture. Designed to simplify and optimize the trading process, the Beast Indicator is the ultimate game-changer, offering a hassle-free experience that allows you to set your buy and sell options effo
Supply and Demand Dashboard PRO
Bernhard Schweigert
4.8 (20)
¡Actualmente 20% OFF ! Este tablero de instrumentos es una pieza muy poderosa de software de trabajo en múltiples símbolos y hasta 9 marcos de tiempo. Se basa en nuestro indicador principal (Mejores críticas: Advanced Supply Demand ).  El tablero de instrumentos da una gran visión general. Se muestra:  Valores filtrados de Oferta y Demanda, incluyendo la calificación de fuerza de la zona, Pips distancias a / y dentro de las zonas, Destaca las zonas anidadas, Da 4 tipos de alertas para los s
Indicator : RealValueIndicator Description : RealValueIndicator is a powerful tool designed specifically for trading on the EURUSD pair. This indicator analyzes all EUR and USD pairs, calculates their real currency strength values, and displays them as a single realistic value to give you a head start on price. This indicator will tell you moves before they happen if you use it right. RealValueIndicator allows you to get a quick and accurate overview of the EURUSD currency pair tops and bottoms,
Introduciendo       Indicador Quantum Trend Sniper   , el innovador indicador MQL5 que está transformando la forma en que identificas y negocias los cambios de tendencia. Desarrollado por un equipo de comerciantes experimentados con experiencia comercial de más de 13 años,       Indicador de francotirador de tendencia cuántica       está diseñado para impulsar su viaje comercial a nuevas alturas con su forma innovadora de identificar cambios de tendencia con una precisión extremadamente alta.
This indicator is based on the Gann Signal indicator and acts as a market scanner. All you need to do is fill in the selected currency pairs in the settings and that’s it. Next, the indicator itself will view all these currency pairs and time frames from M5 to D1 simultaneously. When a new signal appears, the indicator will give you an Alert and also draw the letter N where this new signal will be.
Otros productos de este autor
Volatility Trend System - un sistema de comercio que da señales para las entradas. El sistema de volatilidad da señales lineales y puntuales en la dirección de la tendencia, así como señales para salir de ella, sin redibujar ni demoras. El indicador de tendencia monitorea la dirección de la tendencia a mediano plazo, muestra la dirección y su cambio. El indicador de señal se basa en cambios en la volatilidad y muestra entradas en el mercado. El indicador está equipado con varios tipos de ale
Candle Binary Scalper es un producto de análisis técnico para forex y opciones binarias. Incluye varios indicadores técnicos combinados en un sistema de comercio. Adecuado para operaciones manuales dentro de una tendencia, para scalping y opciones binarias. Funciona en todos los plazos e instrumentos comerciales. Los marcos de tiempo recomendados para negociar M15, M30, H1 y H4, M5 y M1 deben usarse en caso de alta volatilidad. Hay varios tipos de alertas. Cómo usar el producto Ya se han
El indicador " ZigZag on Trend " es un asistente para determinar la dirección del movimiento del precio, así como una calculadora de barras y pips. Consiste en un indicador de tendencia que monitorea la dirección del precio con una línea de tendencia presentada en forma de zigzag y un contador que calcula el número de barras pasadas en la dirección de la tendencia y el número de puntos en una escala vertical. (Los cálculos se realizan mediante la apertura de la barra) El indicador no se vuelve a
Level Breakout Indicator es un producto de análisis técnico que funciona desde los límites superior e inferior, que pueden determinar la dirección de la tendencia. Funciona en la vela 0 sin redibujados ni retrasos. En su trabajo, utiliza un sistema de diferentes indicadores, cuyos parámetros ya han sido configurados y combinados en un solo parámetro: " Scale ", que realiza la gradación de períodos. El indicador es fácil de usar, no requiere ningún cálculo, utilizando un único parámetro debe se
Channel Cluster
Vitalyi Belyh
5 (1)
Cluster indicator working in the price channel. For operation, the indicator builds a channel line - (dashed line). Inside the channel, cluster sections are determined that determine the direction of the price movement - (histograms in two directions), start with large arrows. Small arrows are plotted above / below each histogram - indicator increase volatility. The indicator does not redraw the values. Works on any tools and timeframes. Entrances are made when large arrows appear, inside s
Un complejo de indicadores de reconocer los momentos de reversión. Detecta los picos y los huecos de acuerdo con las combinaciones de velas después de deducir de dos Ma. Aplicable para sistemas comerciales cuando se usan entradas tempranas. Puede usar una tendencia para el comercio de escala y intradía, y para detectar una tendencia en las primeras etapas. Posibilidad Los parámetros proporcionan configuraciones flexibles para cualquier tiempo FLOMS y herramientas comerciales. Hay varios t
Indicador para negociación manual y análisis técnico de Forex. Consiste en un indicador de tendencia con el nivel de apertura del día de negociación y un indicador de flecha para determinar los puntos de entrada. El indicador no cambia de color; funciona cuando se cierra la vela. Contiene varios tipos de alertas para flechas de señal. Puede configurarse para funcionar en cualquier gráfico, instrumento comercial o período de tiempo. La estrategia de trabajo se basa en la búsqueda de movi
Volatility Trend System - un sistema de comercio que da señales para las entradas. El sistema de volatilidad da señales lineales y puntuales en la dirección de la tendencia, así como señales para salir de ella, sin redibujar ni demoras. El indicador de tendencia monitorea la dirección de la tendencia a mediano plazo, muestra la dirección y su cambio. El indicador de señal se basa en cambios en la volatilidad y muestra entradas en el mercado. El indicador está equipado con varios tipos de alertas
Wave Reversal Indicator - determines the direction of trend waves and price reversals. The indicator shows wave movements and trend directions. It gives recommendations where to follow the trader, helps to follow the trading strategy. It is an addition to an intraday or medium-term strategy. Almost all parameters are selected for each time frame and are changed automatically, the only parameter for manual adjustment is the wavelength. Works on various trading instruments and timeframes, rec
FREE
Scalping Entry Points - es un sistema de comercio manual que puede ajustarse a los movimientos de precios y dar señales para abrir operaciones sin volver a dibujar. El indicador determina la dirección de la tendencia por el nivel central de soporte y resistencia. El indicador de puntos proporciona señales para entradas y salidas. Adecuado para operaciones intradía manuales, reventa y opciones binarias. Funciona en todos los plazos e instrumentos comerciales. El indicador da varios tipos de aler
Scalping and Binary Signal Detector : indicador de especulación que proporciona señales direccionales para abrir posiciones a lo largo de la tendencia. El indicador es un sistema comercial completo que se puede utilizar para Forex y opciones binarias. El sistema de algoritmos permite reconocer movimientos intensos de precios en varias barras consecutivas. El indicador proporciona varios tipos de alertas para las flechas. Funciona en cualquier instrumento comercial y marco de tiempo (se recom
Un complejo de indicadores de reconocer los momentos de reversión. Detecta los picos y los huecos de acuerdo con las combinaciones de velas después de deducir de dos Ma. Aplicable para sistemas comerciales cuando se usan entradas tempranas. Puede usar una tendencia para el comercio de escala y intradía, y para detectar una tendencia en las primeras etapas. Posibilidad Los parámetros proporcionan configuraciones flexibles para cualquier tiempo FLOMS y herramientas comerciales. Hay varios t
Zig-Zag indicator with additional signals for inputs. Visually easy to use: The red zig-zag line is an uptrend. The blue zig-zag line is a downward trend. Arrows in the form of additional signals. Works on any trading pairs. On any timeframe. Not redrawn. Input parameters Zig-Zag Period - Zig-zag period (from 5) Signal Period - period of signal arrows (from 3) Alerts for signals Play sound - Sound alert Display pop-up message - Notification by message on the screen Send push not
FREE
Candle Power Signals es un indicador de tendencia que utiliza una estrategia de búsqueda de posibles señales volátiles para tomar decisiones comerciales. Al analizar el mercado, el indicador identifica zonas de mayor y menor volatilidad dentro del movimiento de tendencia direccional. Los principales parámetros de generación de señal ya han sido configurados, los ajustes y periodos restantes están indexados en 2 parámetros para configuración manual: 1. "Candle calculation method" : 2 modos d
Level Breakout Indicator es un producto de análisis técnico que funciona desde los límites superior e inferior, que pueden determinar la dirección de la tendencia. Funciona en la vela 0 sin redibujados ni retrasos. En su trabajo, utiliza un sistema de diferentes indicadores, cuyos parámetros ya han sido configurados y combinados en un solo parámetro: " Scale ", que realiza la gradación de períodos. El indicador es fácil de usar, no requiere ningún cálculo, utilizando un único parámetro debe se
Max Min Reversal Arrows MT5 - an arrow reversal indicator for predicting price movement. The indicator is built on the support and resistance levels at the local lows and highs of the price. Product features Arrows appear on the current candle. The indicator does not redraw. Can be used on all time frames and trading instruments. Recommended timeframes to use M30, H1, H4. The dotted lines are the support and resistance levels within the signal. Price movement from these levels means a reve
El sistema de comercio técnico de BB Reversal Arrows se ha desarrollado para predecir puntos inversos para tomar decisiones minoristas. El indicador analiza la situación actual del mercado y se estructura para varios criterios: la expectativa de momentos de reversión, posibles puntos de inflexión, señales de compra y venta. El indicador no contiene información en exceso, tiene una interfaz visual comprensible, lo que permite a los operadores tomar decisiones razonables. Todas las flechas pa
Indicador cíclico para negociar y predecir la dirección del mercado. Muestra el comportamiento cíclico del precio en forma de oscilador. Da señales para abrir tratos al rebotar desde los límites superior e inferior del oscilador. En forma de histograma, muestra la fuerza suavizada de la tendencia. Complementará cualquier estrategia comercial, desde scalping hasta intradía. El indicador no se vuelve a dibujar. Adecuado para su uso en todos los símbolos/instrumentos. Marcos de tiempo adecuados p
Indicador del canal de precios y generador de puntos de quiebre en su interior. Da una idea de la posición del precio en relación con el período de uso. Contiene líneas de rebote de tendencia suavizadas construidas a lo largo de los bordes del canal y puntos de rebote que determinan los momentos de entrada y salida. Funciona en varios instrumentos comerciales y marcos de tiempo. Cómo trabajar con el indicador Siga la línea de interrupción del canal, la línea azul está arriba de las entrad
Un indicador de tendencia que muestra la fuerza de los alcistas y bajistas en un rango de cotización. Consta de dos líneas: La línea verde es una condición equilibrada de sobrecompra/sobreventa. La línea roja es la dirección de la actividad comercial. No vuelve a dibujar los cálculos. Se puede utilizar en todos los Símbolos/Instrumentos/Marcos de tiempo. Fácil de usar y configurar. Cómo utilizar el indicador y qué determina. La regla básica es seguir la dirección de la línea roja: s
FREE
Smoothed oscillator based on basic DeMarker indicators. Shows the volatility of the price direction. Can be used to determine intraday entry and exit points from the market. Suitable for use on all time frames and trading instruments. It is recommended to use on M5, M15 and M30. The green line shows the price direction up, the blue line shows the price direction down. The red line is a smoothed representation of the price. Input parameters      Period - Period of the main indicator DeMarker
FREE
Un indicador técnico diseñado específicamente para el especulación que puede identificar impulsos de volatilidad y mostrar su duración. Tiene parámetros flexibles para la configuración manual, lo que le permite aplicar la funcionalidad del indicador a cualquier instrumento comercial. Los plazos recomendados para utilizar son M5, M15, M30, H1 y H4. Hay varios tipos de alertas. Todas las señales nunca cambian ni cambian de color al cierre de la vela. El indicador está configurado por paráme
Lines Channel Pro
Vitalyi Belyh
5 (1)
El indicador "Lines Channel Pro" determina las reversiones de precios desde el canal High/Low. Contiene un buscador de tendencias incorporado, líneas de señal, puntos de entrada y salida. El marco de tiempo recomendado para que M15 funcione es D1. Para cada período de tiempo e instrumento comercial, dependiendo de la volatilidad, es necesario seleccionar configuraciones individuales. No vuelve a dibujar los cálculos. Parámetros de entrada Use Channel trend filter - activar/desactivar
Arrow indicator with trend filter. Generates trend input without delays or delays - on the emerging candle. Suitable for use on any trading tools and timeframes. Easy to use, contains the direction of the trend in the form of a histogram lines and signal generator. Input parameters Period Trend Line - Period of the Histogram Line Signal Generator Period - If the period is longer, then the arrows are less Play sound Display pop-up message Send push notification Send email Sound file signal -
An indicator that determines the point levels of price resistance. The arrows indicate price bounces in the indicated directions. Arrows are not redrawn formed on the current candle, shown on the previous candle for convenience.      It has one setting - the formation intensity: If the parameter is smaller, most of the signals are formed in a wide trend. If the parameter is larger, signals are formed in a narrower trend. Input parameters Formation Intensity - Arrow Formation Intensity Num
A technical indicator that calculates its readings based on trading volumes. It has an oscillatory line that follows the change in volumes. Large arrows on the line indicate reversal values. A channel is built around the line with small arrows showing the strengthening of price movement in the direction of increasing volumes. The indicator does not redraw values. Works on any instrument and timeframe. It can complement any trading strategy by finding a trend or make entries in the direction of
Max Min Reversal Arrows - an arrow reversal indicator for predicting price movement. The indicator is built on the support and resistance levels at the local lows and highs of the price. Product features Arrows appear on the current candle. The indicator does not redraw. Can be used on all time frames and trading instruments. Recommended timeframes to use M30, H1, H4. The dotted lines are the support and resistance levels within the signal. Price movement from these levels means a reversal.
Scalping Entry Points - es un sistema de comercio manual que puede ajustarse a los movimientos de precios y dar señales para abrir operaciones sin volver a dibujar. El indicador determina la dirección de la tendencia por el nivel central de soporte y resistencia. El indicador de puntos proporciona señales para entradas y salidas. Adecuado para operaciones intradía manuales, reventa y opciones binarias. Funciona en todos los plazos e instrumentos comerciales. El indicador da varios tipos de aler
Una herramienta de tendencias para operar y analizar y predecir la situación del mercado. El indicador incluye una línea guía que actúa como guía para las ondas de tendencia, ya sea diaria o semanal. Y un oscilador especial que analiza los volúmenes de negociación. Muestra períodos de mercados de sobrecompra y sobreventa y determina los puntos de entrada al comienzo de un posible movimiento de precios. El indicador no se vuelve a dibujar y no se retrasa. Funciona en cualquier instrumento y m
Binary Lines es un indicador de análisis técnico para divisas, materias primas, criptomonedas, acciones, índices y cualquier instrumento financiero. Se puede utilizar para opciones binarias o reventa de divisas. Muestra los puntos de entrada y salida a intervalos fijos y proporciona comerciantes la información necesaria sobre los resultados de posibles transacciones. Los puntos de entrada se forman al comienzo de la vela, en la dirección de la línea MA, duración las operaciones en barras se pued
Filtro:
No hay comentarios
Respuesta al comentario
Versión 1.50 2024.09.15
Fixed a bug in the code
Versión 1.10 2024.09.12
Removing errors.