• Información general
  • Comentarios
  • Discusión
  • Novedades

SwingVolumePro

🎯 Visión General

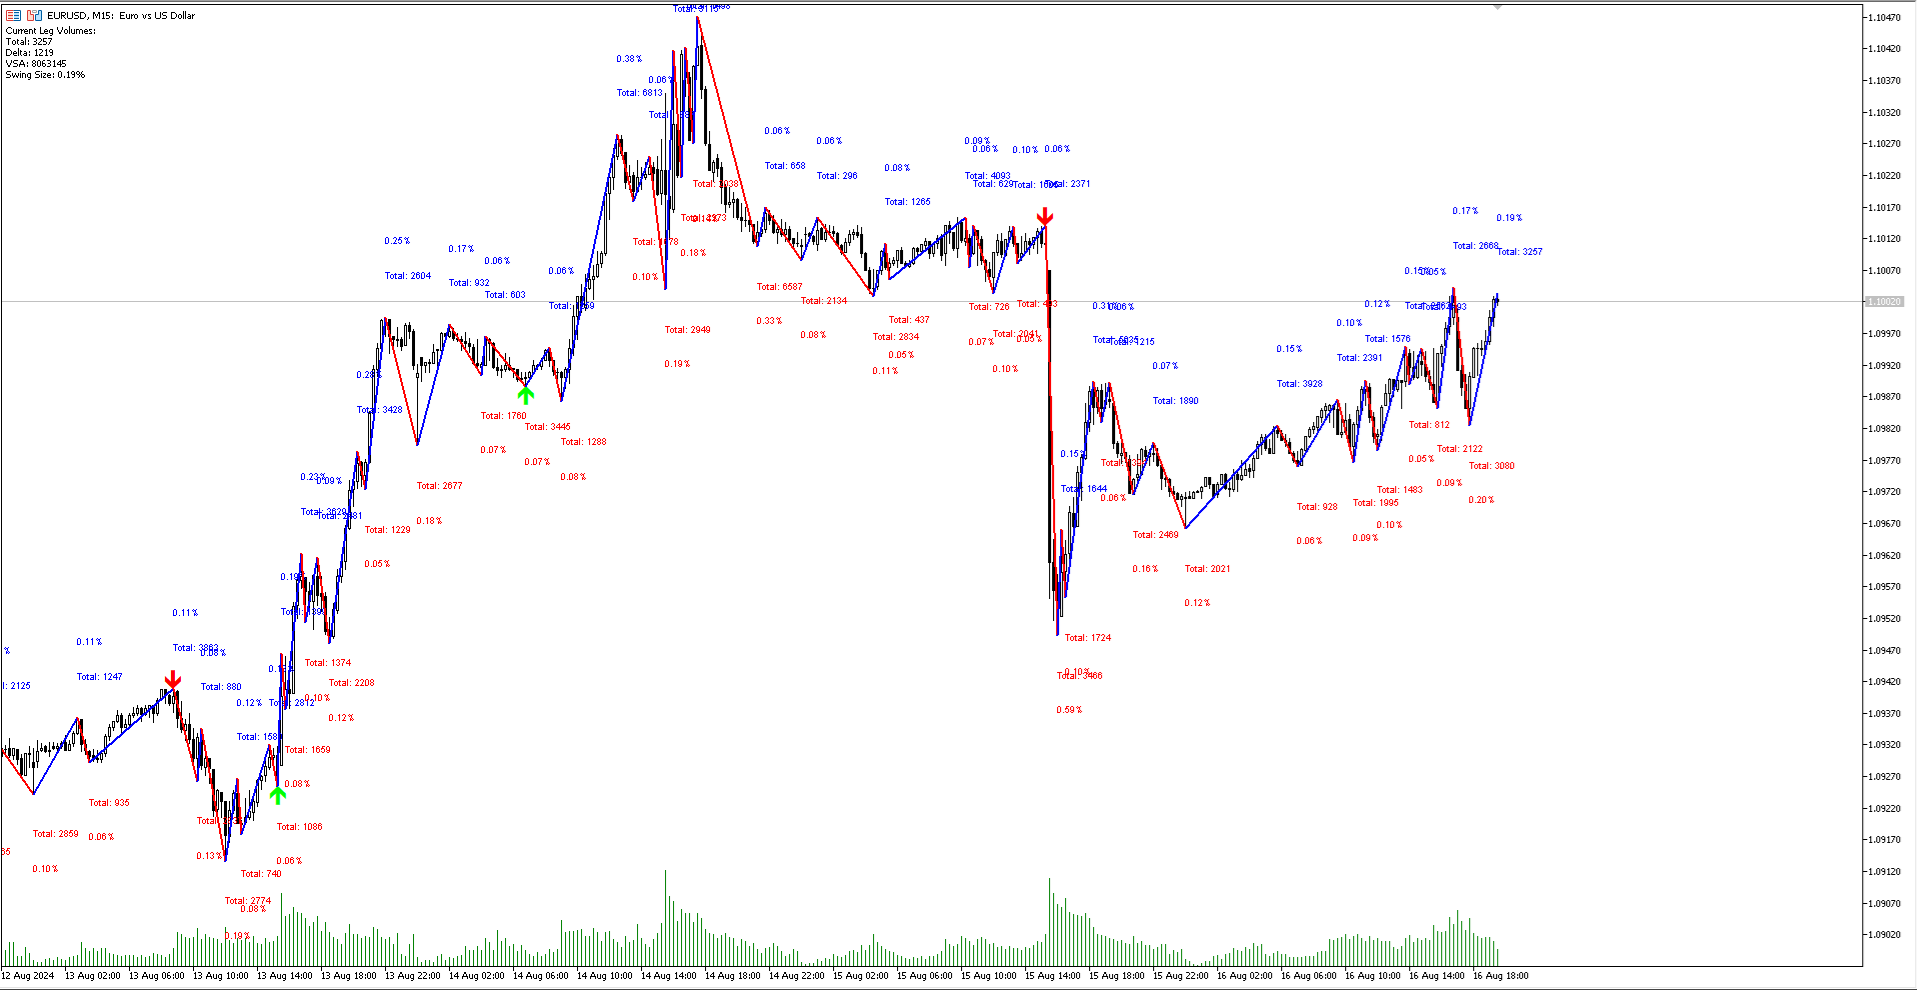
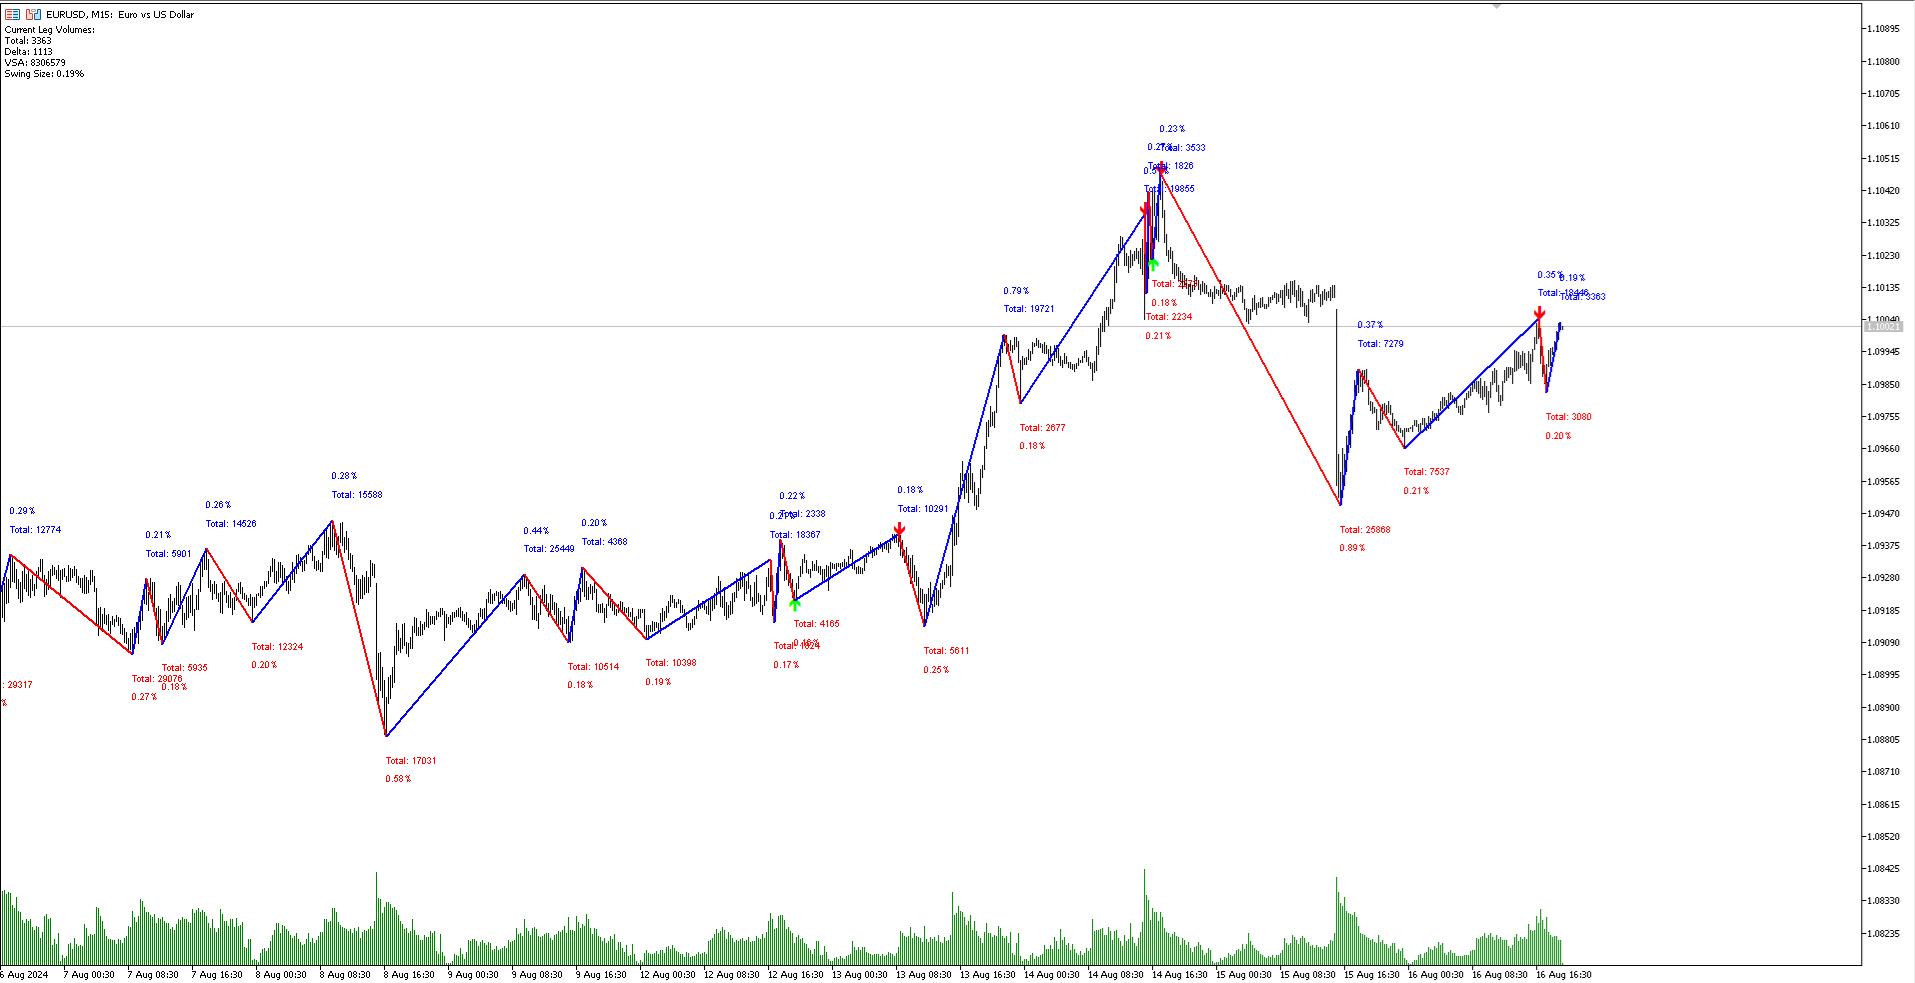
SwingVolumePro es un indicador avanzado y versátil, diseñado para aplicarse a una amplia gama de activos financieros y soportar diferentes estilos de operación. Desarrollado sobre la base de un análisis riguroso de volumen y precio, ofrece señales claras y precisas que permiten a los traders de todos los niveles tomar decisiones informadas basadas en datos de alta calidad.


SwingVolumePro.PDF


🔑 Características Principales

  • 🌍 Versatilidad: SwingVolumePro puede aplicarse a diversos activos, incluyendo acciones, forex, criptomonedas y más. Es adecuado para diferentes estrategias de trading, desde scalping hasta posiciones a largo plazo.

  • 🎯 Señales Precisas y Confiables: Enfocado en proporcionar señales altamente precisas, SwingVolumePro utiliza técnicas sofisticadas para identificar patrones de absorción de precios y agresiones del mercado. Estas señales se presentan de manera clara, facilitando la toma de decisiones rápida y efectiva.

  • 📊 Análisis Avanzado de Volumen y Precio: El indicador emplea un análisis detallado de la interacción entre volumen y precio para detectar situaciones donde existe una discrepancia entre el esfuerzo y el resultado, señalando posibles movimientos del mercado.

  • 🧩 Facilidad de Interpretación: Con una interfaz intuitiva y amigable, SwingVolumePro genera señales que son fácilmente comprendidas, incluso por traders con menos experiencia. El uso de flechas para indicar la relación esfuerzo-resultado hace que la lectura de la información sea aún más directa.

🤖 Compatibilidad con EAs (Expert Advisors)

SwingVolumePro está diseñado con soporte técnico para la construcción de Expert Advisors (EAs), facilitando la automatización de estrategias de trading. Proporciona los siguientes buffers que pueden ser utilizados en EAs:

  1. Buffer 0: UpArrow (Flecha hacia arriba) 📈
  2. Buffer 1: DownArrow (Flecha hacia abajo) 📉
  3. Buffer 2: UpLine (Línea hacia arriba) ⬆️
  4. Buffer 3: DownLine (Línea hacia abajo) ⬇️
  5. Buffer 4: TotalVolume (Volumen Total) 🔄
  6. Buffer 5: DeltaVolume (Delta de Volumen) ➕➖
  7. Buffer 6: VSAVolume (Volumen VSA) 📊

🔍 Cómo Funciona

  • ⏱️ Monitoreo Continuo: SwingVolumePro realiza un análisis dinámico del mercado en tiempo real, identificando patrones de volumen y precio que indican posibles cambios en el comportamiento del activo.

  • 💡 Generación de Señales: Basado en un análisis preciso de la absorción de precios y las agresiones del mercado, el indicador emite señales que son fáciles de interpretar y aplicar en una variedad de estrategias de trading.

  • 🧠 Análisis Contextual: Además de proporcionar señales, SwingVolumePro ofrece una visión contextual del mercado, ayudando al trader a comprender mejor las condiciones bajo las cuales se generan las señales, optimizando la toma de decisiones.

🏆 Beneficios para el Trader

  • 🗝️ Claridad y Precisión: SwingVolumePro está diseñado para simplificar el análisis del mercado, generando señales que son directas y fáciles de entender.

  • 🌐 Aplicabilidad Universal: Independientemente del activo que se esté negociando, SwingVolumePro es una herramienta eficaz que se adapta a las especificidades de diferentes mercados.

  • 🔄 Soporte para Múltiples Estrategias: El indicador es lo suficientemente flexible como para integrarse en diversas estrategias operativas, desde corto a largo plazo.

🚀 Conclusión

SwingVolumePro es una herramienta esencial para los traders que buscan claridad, precisión y eficiencia en sus operaciones. Con su capacidad para generar señales técnicas de alta calidad, compatibilidad para la construcción de EAs y un análisis robusto de volumen y precio, se convierte en un aliado indispensable en una variedad de escenarios de mercado. Prueba SwingVolumePro y descubre cómo puede potenciar tus estrategias de trading, proporcionando un análisis profundo y señales confiables.


Productos recomendados
Impulse fractals indicator - is counter-trend oriented complex market fractal pattern.  Market creates bull/bear impulse, trend starts, fractals on impulsed wave are an agressive pullback signals. Buy arrow is plotted when market is bearish and it's impulse showed up-side fractal, and sell arrow is plotted when market is bullish and it's impulse showed dn-side fractal. Main indicator's adjustable inputs : impulsePeriod - main period of impulse histogram  filterPeriod  - smoothes impulse accordi
- This is an implementation of OCC ==> open close cross - This indicator applies twelve different averaging methods to open and close prices separately to signal the trend switching. - All MA methods are set as input as well as period and different offsets applied to linear regression and ALMA averaging. - Buffers 16 and 17 can be used in EAs to detect trend direction. - You can message in private chat for further changes you need.
INDICADOR basado en INTELIGENCIA ARTIFICIAL que genera posibles entradas de compra y venta de opciones binarias. El indicador funciona con 3 estrategias diferentes: 1) al leer volúmenes, envía una señal cuando el precio debería revertirse 2) a través de la divergencia entre precio y volumen, envía una señal de cuándo la tendencia debe continuar o revertirse 3) a través de la convergencia entre precio y volumen, envía una señal de cuándo debe continuar la tendencia. el indicador fu
Deriv Boom sell
Yaovi Inoussa Atchou
Our BOOM SELL ALERT indicator is specifically engineered to   take candles on BOOM 1000 , BOOM 500 is tool is optimized for M1 (1-minute) timeframe, ensuring you receive timely and actionable insights.   The indicator is a combination of   many indicators. -        AO Oscillator -        Stochastic   HOW TO USE THIS INDICATOR To use well this indicator , it   need to use SCHAFF TREND RSX ( 5 MIN OR M5) IF SCHAFF trend RSX is GREEN and you have a signal then SELL when you have ENTRY and out with
Turpial Pullback
Arlos Elias Rivas Romero
Indicador Tipo Estrategia (Pullback), que aplica a todos los Simbolos y Periodicidad, preferiblemente a partir de 30M. Puede ser utilizado para trading manual. Su espacio de trabajo corresponde al canal de 3 barras del Maestro Bill Williams. Tambien se apoya en los indicadores Rsi y Atr. Comprar (Buy) cuando: hay una flecha de color verde STOPLOSS para comprar, colocarlo por debajo de la linea inferior del canal  (linea de color rojo)" Vender (Sell) cuando: hay una flecha de color rojo. STOPLOSS
El indicador EYeQ es una herramienta poderosa para ofrecer señales de entrada en STEP INDEX, VOLATILITY 10, 25,50,75 100, BOOM y CRUSH. Es más efectivo para atrapar PINCHOS en BOOM y CRUSH 300, 500 y 1000. El indicador EYeQ analiza los mercados en múltiples períodos de tiempo y encuentra los puntos de entrada más adecuados en función de las tendencias. Solo necesita activar las alertas de escritorio para que pueda recibir una notificación cuando se emitan señales. Permita las notificaciones
MarketMagnet
Kelly Adediran Raymond
Are you ready to take your trading journey to new heights? Look no further than MarketMagnet, this groundbreaking indicator designed to propel your trading success with excitement and accuracy. Powered by the convergence of Momentum and CCI (Commodity Channel Index), MarketMagnet equips traders with the ultimate tool to determine direction and entry prices for a wide range of recommended currency pairs and instruments. It is designed for traders seeking to scalp for a few pips on lower timeframe
The indicator determines a special pattern of Joe Dinapoli. It gives very high probability buy and sell signals. Indicator does not repaint. Indicator Usage Buy Signal ''B'' Entry : Market buy order at signal bar close Stop : Low of signal bar Take Profit : First swing high Sell Signal ''S'' Entry : Market sell order at signal bar close Stop : High of signal bar Take Profit : First swing low Indicator Parameters Fast EMA : External Parameter (should be kept as default) Slow EMA: External Param
To download MT4 version please click here . - This is the exact conversion from TradingView: "Linear Regression Candles" By "ugurvu". - The overall look of the indicator is like Heiken Ashi. - It can be used as a trend confirmation indicator to detect the right trend direction. - This indicator lets you read the buffers for Candles' OHLC. - This is a non-repaint and light processing load indicator - You can message in private chat for further changes you need. Thanks
VVWAP Bandas
Edipaulo Zanella
Daily VWAP, continues for a period of hours (eg, 10 hours of history), with color to indicate change of direction and bands to map good entry and exit points. The indicator was created to map the center of the market, and find good buying moments, trend analysis or market correction points are easily detected, allowing you to understand moments of exhaustion and buying and selling points Copyright (c) <year> <copyright holders> Permission is hereby granted, free of charge, to any person obtain
Three Candles Pattern
Edson Cavalca Junior
5 (1)
The patterns of 3 (three) Candles: Three White Soldiers; Three Black Crows; These are reversal patterns widely used by traders, as they have a high probability of showing the inversion of the current market movement. For example, if in a bullish trend there are three black crows, there is a high probability of reversing the current bullish movement. The Three White Soldiers have the following characteristics: There are 3 consecutive candles with a good body, that is, the difference between
Limitless MT5
Dmitriy Kashevich
Limitless MT5 is a universal indicator suitable for every beginner and experienced trader. works on all currency pairs, cryptocurrencies, raw stocks Limitless MT5 - already configured and does not require additional configuration And now the main thing Why Limitless MT5? 1 complete lack of redrawing 2 two years of testing by the best specialists in trading 3 the accuracy of correct signals exceeds 80% 4 performed well in trading during news releases Trading rules 1 buy signa
A useful scanner/dashboard that shows the RSI values for multiple symbols and Time-frames. It can be easily hidden/displayed with a simple click on the scanner man top left of the dashboard. You can input upper and lower RSI values and the colours can be set to show when above/below these values. The default values are 70 and 30. There are also input colours for when the RSI is above or below 50 (but not exceeding the upper/lower levels Symbols and time-frames are input separated by commas.
VWAP indicator for MT5
Renaud Herve Francois Candel
Moving VWAP Indicator Moving VWAP is an important indicator drawing the Volume-Weighted Average Price (VWAP). The VWAP is a reference used by institutional traders and acts as a level of support / resistance. If price is above VWAP then means market is bullish. If price is below VWAP then means market is bearish. It can be used to enter in the market with low risk (near VWAP) and also identify the correct direction of the market. The Moving VWAP is as simple as a Simple Moving Average.
The Plasma Trend indicator is a simple technical indication that is used to determine the current trend direction in the market. The Plasma Trend indicator is a powerful tool for determining the direction of the trend in the Forex market. It is based on both standard technical indicators and proprietary mathematical calculations, which provides a more accurate and reliable trend determination. Its implementation in the form of lines of two colors simplifies the visual determination of a change
Start Midas Fibo Bands
Ricardo Almeida Branco
Here we have the Start Midas Fibo Bands , I confess that it is an indicator that excited me enough to operate because I was able to find more defined rules. Well, the indicator has the functions of the other indicators of the Start line , which is a possibility to plot several Midas on the screen, you can move the anchor point using keyboard shortcuts and use the legend to differentiate one anchor from another. The rules that I have analyzed for my possible setup are recommended to the entry, st
This Indicator adding power to traditional zigzag indicator. With High-Low numbers in vision it will be easier to estimate change of trend by knowing the depth of each wave. Information including points, pips, percentage%, and #bars can be displayed based on configuration. All information is real-time update. This indicator is especially useful in sideway market to buy low sell high.
My PVSR
Ashok Kumar Singha
My PVSR   is based on All Type of Pivot Points. Use this Indicator to get proper Support / Resistance Zone and Trade accordingly.. Recommendation: Use this Indicator along with my another Indicator --->>> Dr. Trend   <<<--- Click Here ; To get the best output result feel free to contact me ; Best of Luck It can be used for: All Pairs: Forex, Cryptocurrencies, Metals, Stocks, Indices etc. All Timeframe All Brokers All type of Trading Style like Scalping, Swing, Intraday, Short-Term, Lon
Regent Street, rather than an expert or an indicator, is an all-in-one trading assistant easing your trading sessions by providing signals and notifications. It's an assistant rather than a robot - "an assisted steering rather than an autopilot", and now, it autoadjusts itself to any instrument, any timeframe & any circumstance. Note from the author: Regent Street's frontend is exactly the same as an other product Ermou Street , but the backend is different. Performances for each are very relati
Introduction to Fractal Pattern Scanner Fractal Indicator refers to the technical indicator that makes use of the fractal geometry found in the financial market. Fractal Pattern Scanner is the advanced Fractal Indicator that brings the latest trading technology after the extensive research and development work in the fractal geometry in the financial market. The most important feature in Fractal Pattern Scanner is the ability to measure the turning point probability as well as the trend probabil
Setup Double 7s
Luigi Nunes Labigalini
Entry and exit signals from the Double 7's Strategy by Larry Connors in his book "Short Term Trading Strategies That Work". Larry claims this strategy predicted the market's direction over 80% of the time since 1995. Picking up the gains and being exposed in the market less than 25% of the time. Good for swing trading on Daily charts of SPY, Nasdaq, China's FXI, Brazil's EWZ and the majority of the equity ETFs and World Indices. How does it work? The indicator activates the buy signal when
This product generates signals at closing bars thanks to channel scaling. It visualizes these signals with an arrow. The color of the arrow indicates the direction of the trade. The default settings are valid for the H1 period. You can backtest for each period and product. The code content of the indicator has been applied in accordance with price movements as much as possible. For this reason, it detects trend beginnings and ends well. Parameter descriptions: PER: Indicates the number of b
The Rocket Trend indicator is trending. The indicator draws two-color points connected by lines along the chart. This is a trend indicator, it is an algorithmic indicator. It is easy to work and understand when a blue circle appears, you need to buy, when a red one appears, sell. The indicator is used for scalping and pipsing, and has proven itself well. Rocket Trend is available for analyzing the direction of the trend for a specific period of time. Ideal for novice traders learning the laws o
The rubdfx divergence indicator is a technical analysis tool that compares a security's price movement. It is used to identify potential changes in the price trend of a security. The indicator can be applied to any type of chart, including bar charts and candlestick charts. The algorithm is based on MACD, which has been modified to detect multiple positive and negative divergences. Settings  ___settings___ * fastEMA * slowEMA * signalSMA *Alerts:   True/False     #Indicator Usage B
【Super Scanner】Indicator Introduction : The color of the Super Scanner which is green and climbing up means that the price trend is going up.The color of the Super Scanner is red and going down means that the price trend is going down. It is very simple to use it to judge the market trend! What's even better is that the open parameters of the indicators allow investors to adjust. You can adjust【Super Scanner】according to your needs. Adjust it faster to be closer to short-term market fluctuati
The volatility scanner indicator is a tool that helps traders identify and analyze  volatility in all the market timeframes for the current chart. This way you can find potentially profitable trades on every timeframe for the current symbol. What It Does? Scan all timeframes to find a volatility contraction. Color the button yellow if there is a volatility squeeze at that timeframe. Clicking on the button instantly changes timeframe. How To Use It? Just put it on the chart and click on the y
Santo Oscilator
Gustavo Goncalves
5 (1)
Oscilador bem próximo que o indicador SANTO mostrado pelo Bo Williams em sua metodologia PhiCube, para mim este indicador ainda é melhor que o próprio SANTO original. Ótimo para entender a força e tendência de movimentos e possíveis divergências. Preço fazendo topo e o SANTO não renovando máxima, tudo indica que teremos uma reversão ou no mínimo um drawback.
The indicator is the advanced form of the MetaTrader 4 standard Fibonacci tool. It is unique and very reasonable for serious Fibonacci traders. Key Features Drawing of Fibonacci retracement and expansion levels in a few seconds by using hotkeys. Auto adjusting of retracement levels once the market makes new highs/lows. Ability to edit/remove any retracement & expansion levels on chart. Auto snap to exact high and low of bars while plotting on chart. Getting very clear charts even though many ret
Mean Reversion Breakout MT5
Christopher Graham Parish
!! FLASH SALE !!   Over 80% off !!     For ONE week only. Now only $47 - normally $297! >>>      Ends on 30 June 2023 - Don't miss it! Buy and Sell Arrows when price breaks away from mean price. Sends Alerts – On MT5 To Your Phone To Your Email Does not repaint . Works on any Forex pair, any timeframe. 10 Activations allowed so you are free from limitations >> MT4 Version Here For spreads from a tiny 0.1 pips RAW/ECN Accounts,  click here . Check out my Waka Esque EA signal here: >>
Descriptions A point point is a technical analysis indicator, or calculations, used to determine the overall trend of market over different time frames. This indicator calculate the highest or lowest pivots among left x and right y bars and show the high/low level during that period.   From that, you could clearly see the top resistance & bottom support level and how market goes break out. Instructions pivotLeft - pivot left bar count pivotRight - pivot right bar count pivotHighColor - c
Los compradores de este producto también adquieren
TPSpro RFI Levels MT5
Roman Podpora
4.73 (11)
INSTRUCCIONES       RUSO   -   ING        Se   recomienda utilizar con un indicador.       -       TPSpro   TENDENCIA PRO -   Versión MT5 Un elemento clave en el trading son las zonas o niveles desde los que se toman las decisiones de compra o venta de un instrumento de trading. A pesar de los intentos de los principales actores de ocultar su presencia en el mercado, inevitablemente dejan rastros. Nuestra tarea era aprender a identificar estos rastros e interpretarlos correctamente. Funciones p
Atomic Analyst MT5
Issam Kassas
4.42 (19)
En primer lugar, vale la pena enfatizar que este Indicador de Trading no repinta, no redibuja y no se retrasa, lo que lo hace ideal tanto para el trading manual como para el automatizado. Manual del usuario: configuraciones, entradas y estrategia. El Analista Atómico es un Indicador de Acción del Precio PA que utiliza la fuerza y el impulso del precio para encontrar una mejor ventaja en el mercado. Equipado con filtros avanzados que ayudan a eliminar ruidos y señales falsas, y aumentan el poten
Primero que todo, vale la pena enfatizar que este Sistema de Trading es un Indicador No Repintado, No Redibujado y No Retrasado, lo que lo hace ideal tanto para el trading manual como para el automatizado. Curso en línea, manual y descarga de ajustes preestablecidos. El "Sistema de Trading Inteligente MT5" es una solución completa de trading diseñada para traders nuevos y experimentados. Combina más de 10 indicadores premium y presenta más de 7 estrategias de trading robustas, lo que lo convie
AT Forex Indicator MT5
Marzena Maria Szmit
5 (4)
The AT Forex Indicator MT5 is a sophisticated trading tool designed to provide traders with a comprehensive analysis of multiple currency pairs. This powerful indicator simplifies the complex nature of the forex market, making it accessible for both novice and experienced traders. AT Forex Indicator uses advanced algorithms to detect trends, patterns and is an essential tool for traders aiming to enhance their forex trading performance. With its robust features, ease of use, and reliable signal
TrendMaestro5
Stefano Frisetti
note: this indicator is for METATRADER4, if you want the version for METATRADER5 this is the link:  https://www.mql5.com/it/market/product/108106 TRENDMAESTRO ver 2.4 TRENDMAESTRO recognizes a new TREND in the bud, he never makes mistakes. The certainty of identifying a new TREND is priceless. DESCRIPTION TRENDMAESTRO identifies a new TREND in the bud, this indicator examines the volatility, volumes and momentum to identify the moment in which there is an explosion of one or more of these data a
TPA True Price Action indicator reveals the true price action of the market makers through 100% non-repainting signals strictly at the close of a candle! TPA shows entries and re-entries, every time the bulls are definitely stronger than the bears and vice versa. Not to confuse with red/green candles. The shift of power gets confirmed at the earliest stage and is ONE exit strategy of several. There are available now two free parts of the TPA User Guide for our customers. The first "The Basics"
FxaccurateLS
Shiv Raj Kumawat
WHY IS OUR FXACCCURATE LS MT5 THE PROFITABLE ? PROTECT YOUR CAPITAL WITH RISK MANAGEMENT Gives entry, stop and target levels from time to time. It finds Trading opportunities by analyzing what the price is doing during established trends. POWERFUL INDICATOR FOR A RELIABLE STRATEGIES We have made these indicators with a lot of years of hard work. It is made at a very advanced level. Established trends provide dozens of trading opportunities, but most trend indicators completely ignore them!
Este es posiblemente el indicador de reconocimiento automático de formación de precios más completo que puede encontrar para la plataforma MetaTrader. Detecta 19 patrones diferentes, toma las proyecciones de Fibonacci tan en serio como usted, muestra la zona de reversión potencial (PRZ) y encuentra niveles adecuados de stop-loss y take-profit. [ Guía de instalación | Guía de actualización | Solución de problemas | FAQ | Todos los productos ] Detecta 19 formaciones de precios armónicos difer
XQ Indicator MetaTrader 5
Marzena Maria Szmit
3 (2)
Step into the realm of Forex trading with confidence and precision using XQ, a cutting-edge Forex indicator designed to elevate your trading game to unprecedented heights. Whether you're a seasoned trader or just stepping into the world of currency exchange, XQ Forex Indicator empowers you with the insights and signals needed to make informed trading decisions. The signal conditions are a combination of three indicators, and XQ Forex Indicator only display  medium and long-term trends . The ind
Noize Absorption Index - is the manual trading system that measures the difference of pressure between bears forces and bulls forces. Green line - is a noize free index that showing curent situation. Zero value of index shows totally choppy/flat market.Values above zero level shows how powerfull bullish wave is and values below zero measures bearish forces.Up arrow appears on bearish market when it's ready to reverse, dn arrow appears on weak bullish market, as a result of reverse expectation.
MetaForecast M5
Vahidreza Heidar Gholami
5 (2)
MetaForecast predice y visualiza el futuro de cualquier mercado basándose en las armonías de los datos de precios. Aunque el mercado no siempre es predecible, si existe un patrón en el precio, MetaForecast puede predecir el futuro con la mayor precisión posible. En comparación con otros productos similares, MetaForecast puede generar resultados más precisos al analizar las tendencias del mercado. Parámetros de entrada Past size (Tamaño del pasado) Especifica el número de barras que MetaForecas
Boom and Crash Trend Detector is a  Non-Repaint   MT5 trading system usually being sold for 50 0$ . Most people use this for Deriv but can be used to forex too. The boom and crash spike indicator is a spike detecting software, with Multiple features, these features include. Spike Alert ( from 10 to 100-second warning before spike) Continues spike Alert (for double or continuous spikes at a time) supports all Boom/crash Indices M6 time frame works best here . Bigger time frame trend pointer f
Ahora $ 147 (aumentando a $ 499 después de algunas actualizaciones) - Cuentas ilimitadas (PC o Mac) Manual de usuario de RelicusRoad + Videos de capacitación + Acceso al grupo privado de Discord + Estado VIP UNA NUEVA MANERA DE VER EL MERCADO RelicusRoad es el indicador comercial más poderoso del mundo para divisas, futuros, criptomonedas, acciones e índices, y brinda a los comerciantes toda la información y las herramientas que necesitan para mantenerse rentables. Brindamos análisis téc
ESTE INDICADOR, BASADO EN INTELIGENCIA ARTIFICIAL, identifica posibles puntos de reversión del mercado leyendo la huella y señala CON ANTICIPACIÓN pequeños movimientos del mercado antes de que ocurran. A diferencia de los indicadores de precio y volumen, que generan entradas "tardías", es decir, cuando ya se ha producido una confirmación en el precio o en el volumen de un cambio de dirección y, por lo tanto, a menudo el movimiento ya ha terminado, este indicador señala, basándose en lo que lee
Go Way TREND
Ywsf Hsyn Hmad Alrsh
Vaya con la tendencia. Sí, espere la señal de entrada, ya sea de compra o venta, en un cuadro de 15 minutos, y verifique la señal si aparece en un cuadro de 30 minutos (a veces la señal tarda una hora o más en aparecer. Puede regresar al cuadro de 15 minutos y regrese al cuadro de 30 minutos, y repita esto hasta que le aparezca la señal principal. Si la señal aparece en el cuadro de 30 minutos, ingrese con el precio y se obtendrá la ganancia cuando cambie la línea del dibujo. , se registran gan
How to use Pair Trading Station Pair Trading Station is recommended for H1 time frame and you can use it for any currency pairs. To generate buy and sell signal, follow few steps below to apply Pair Trading Station to your MetaTrader terminal. When you load Pair Trading Station on your chart, Pair Trading station will assess available historical data in your MetaTrader platforms for each currency pair. On your chart, the amount of historical data available will be displayed for each currency pai
IVISTscalp5
Vadym Zhukovskyi
5 (5)
Te presentamos el indicador iVISTscalp5, que no solo es único sino también efectivo en operaciones de trading. Este indicador se basa en datos temporales y es el resultado de muchos años de experiencia y análisis profundo de los mercados financieros. El indicador iVISTscalp5 es una excelente herramienta para el trading manual. La conveniencia, simplicidad y visualización, toda la complejidad está oculta en su interior. Hemos simplificado al máximo la configuración y uso del indicador iVISTscalp5
Bill Williams Advanced
Siarhei Vashchylka
5 (8)
Bill Williams Advanced is designed for automatic chart analysis using Bill Williams' "Profitunity" system. The indicator analyzes four timeframes at once. Manual (Be sure to read before purchasing) Advantages 1. Automatically analyzes the chart using the "Profitunity" system of Bill Williams. The found signals are placed in a table in the corner of the screen. 2. Equipped with a trend filter based on the Alligator indicator. Most of the system signals are recommended to be used only accordi
Currently, the product's selling price is over $480; however, we are offering a monthly rental system for only $30. This allows many people to enjoy and experience our products during this launch stage, which will likely lead to positive reviews from users, making it more enjoyable | We hope that if there are more than 10 positive reviews, the GOOD NEWS is that the next use will last for 3 months at a fixed price of only $30 | Take advantage of our promo opportunity, before it goes back to sell
Volatility Trend System - un sistema de comercio que da señales para las entradas. El sistema de volatilidad da señales lineales y puntuales en la dirección de la tendencia, así como señales para salir de ella, sin redibujar ni demoras. El indicador de tendencia monitorea la dirección de la tendencia a mediano plazo, muestra la dirección y su cambio. El indicador de señal se basa en cambios en la volatilidad y muestra entradas en el mercado. El indicador está equipado con varios tipos de alertas
Introduction to X3 Chart Pattern Scanner X3 Cherart Pattern Scanner is the non-repainting and non-lagging indicator detecting X3 chart patterns including Harmonic pattern, Elliott Wave pattern, X3 patterns, and Japanese Candlestick patterns. Historical patterns match with signal patterns. Hence, you can readily develop the solid trading strategy in your chart. More importantly, this superb pattern scanner can detect the optimal pattern of its kind. In addition, you can switch on and off individu
Native Channels
BeeXXI Corporation
5 (1)
This indicator recognizes all support and resistance levels. A number of unique high-performance techniques have been applied, which made the existence of this indicator possible. All formed channels are naturally visible: horizontal linear linear parabolic cubic (Polynomial 3 degrees - Wave) This is due to a bundle of approximating channels. The formed channels form "standing waves" in a hierarchical sequence. Thus, all support and resistance levels are visible. All parameter management is
Piranha version 2
Maria Strudov
5 (1)
"Piranha" - an autonomous trading system that determines overbought and oversold levels on the chart. Red and blue zones represent overbought and oversold levels respectively. Entry points are marked with arrows: a downward arrow in the red zone for "sell" and an upward arrow in the blue zone for "buy". The Take profit level is indicated by the green moving average. Key features: Adjusting the Take profit level as the green moving average changes position. Averaging ability when a new market e
SMCpro
Arief
5 (1)
Currently Price  20% OFF  ( for unlimited use ) Indicator   USER MANUAL , trade setups, solving issues, etc :  Direct Download Here     (  for users only  ) Hello World! Introducing.. SMCpro tool and Indicator for  MetaTrader 5 , a cutting-edge feature designed to revolutionize your trading experience. With innovative ICT Smart Money Concept, you gain unparalleled insight into market dynamics, empowering you to make informed trading decisions like never before. SMC Indicator built on th
The iChannels
BeeXXI Corporation
5 (2)
Ultra-fast recognition of parabolic channels (as well as linear, horizontal and wavy channels) throughout the depth of history, creating a hierarchy of channels. Required setting: Max bars in chart: Unlimited This indicator is designed primarily for algorithmic trading, but can also be used for manual trading.  This indicator will have a very active evolution in the near future and detailed descriptions on how to apply to create robots
Introducing the Power Trade Plus indicator designed by a small group of traders with a few years of experience trading the market profitably.  The Power Trade Plus is derived from the Power Trade indicator,  the indicator strive in powerful sniper entries and take profit levels,  with an algorithm that's can determine the markets volatility and Provides entries based on the current market volatility. This indicator is much more effective in stock ,currencies and indices.
Introducing the South African Sniper indicator created by a small group of traders with a few years trading trading the financial market profitably . This is a plug and play indicator that provides you with  BUY and SELL (SNIPER ENTRY) signals with TARGET and trail stops. The indicator Works with all MT5 trading instruments. The indicator uses previous  chart data as receipt to speculate on future market moves.  "The South African Sniper indicator community are very happy with the indicator an
Antes que nada, vale la pena enfatizar que este Sistema de Trading es un Indicador No Repintado, No Redibujado y sin Retardos, lo que lo hace ideal para el trading profesional. Curso en línea, manual del usuario y demostración. El "Sistema de Trading de Soporte y Resistencia Inteligente" es un indicador avanzado diseñado para traders nuevos y experimentados. Empodera a los traders con precisión y confianza en el mercado de divisas. Este sistema integral combina más de 7 estrategias, 10 indicado
Golden Gate Algo MT5
James David Lane
4 (6)
¡40% DE DESCUENTO PARA NAVIDAD! ¡AUMENTO DE PRECIO A $250 EL 1 DE ENERO! Presentamos GoldenGate Entries: ¡Una Solución de Trading de Vanguardia! Descubre un enfoque revolucionario para el trading con GoldenGate Entries (GGE), un indicador avanzado diseñado para elevar tu experiencia de trading. GGE proporciona un conjunto completo de características para capacitar a los usuarios con precisión y confianza en sus decisiones comerciales. Pares: Cualquiera (FX - Materias primas - Acciones - A
Elliott Wave Trend was designed for the scientific wave counting. This tool focuses to get rid of the vagueness of the classic Elliott Wave Counting using the guideline from the template and pattern approach. In doing so, firstly Elliott Wave Trend offers the template for your wave counting. Secondly, it offers Wave Structural Score to assist to identify accurate wave formation. It offers both impulse wave Structural Score and corrective wave Structure Score. Structural Score is the rating to sh
Otros productos de este autor
Box Weis Wave
Thalles Nascimento De Carvalho
5 (1)
¡Eleva tu análisis con el Weis Wave Box! Si buscas precisión y claridad en tus operaciones, el Weis Wave Box es la herramienta que necesitas. Este indicador avanzado ofrece un análisis visual detallado de las ondas de volumen y los puntos de swing, ayudándote a comprender mejor la relación entre esfuerzo y resultados en el mercado. Características Destacadas del Weis Wave Box: Ondas de Volumen Personalizables: Ajusta las ondas de volumen en ticks para adaptarlas a tus estrategias de trad
AI Channel
Thalles Nascimento De Carvalho
4 (4)
Welcome to the presentation of the AI Channel indicator, a powerful tool that uses artificial intelligence for price channel analysis in the financial market. In this session, we will explore how this revolutionary indicator can assist investors and traders in making more informed and strategic decisions. Let's get started! I. What is the AI Channel indicator? AI Channel is an indicator developed based on advanced artificial intelligence algorithms. It utilizes historical price data of financial
FREE
Cumulative Volume Bands
Thalles Nascimento De Carvalho
CVB Cumulative Volume Bands: ¡Potencia tus operaciones con el volumen acumulado! CVB Cumulative Volume Bands es un indicador avanzado diseñado para traders que buscan señales precisas basadas en el volumen acumulado. Utilizando bandas de volumen acumulado, este indicador ofrece lecturas claras de la presión de compra y venta en el mercado, ayudando a identificar reversiones y movimientos fuertes. Cumulative Volume Bands for MT5 ! Características principales: Análisis de volum
FREE
Swing Point Volume
Thalles Nascimento De Carvalho
Swing Point Volume, the indicator that signals weakness and strength at the tops and bottoms. This indicador can be for used the Wyckoff Method. Information provided; - Swing on customized ticks. - Volume and points in each balance sheet. - Percentage of Displacement. - Sound alert option on top and bottom breaks. - Volume in ticks and Real Volume. - Volume HL (extreme) or (opening and closing) - Customized volume shapes.
Atr Projection
Thalles Nascimento De Carvalho
El Indicador ATR Projeção destaca como una herramienta robusta en el análisis técnico, diseñada para proporcionar información precisa sobre los límites potenciales de movimiento de precios en el mercado financiero. Su enfoque flexible permite a los usuarios personalizar las métricas de análisis de manera intuitiva, adaptándose a las necesidades específicas de cada activo operado. Funcionamiento Personalizable: Por defecto, el ATR Projeção opera considerando el 30% de la media de los último
Long Short Pro
Thalles Nascimento De Carvalho
Indicador Long & Short - Versión Pro: ¡Desbloquea el Potencial Ilimitado de tu Análisis de Mercado! Sin Restricciones para Cualquier Activo La versión Pro del Indicador Long & Short te ofrece la libertad total para usarlo con cualquier activo financiero. ¡Sin más limitaciones, aplica el mismo indicador a todos tus activos favoritos! Sin Restricciones Disfruta de todas las funciones del indicador sin ninguna limitación. La versión Pro proporciona una experiencia completa e ilimitad
Didi Index Volume
Thalles Nascimento De Carvalho
Presentamos el Didi Index Volume, un indicador de análisis técnico desarrollado por el trader brasileño Odir Aguiar, que destaca por su enfoque avanzado y poderoso en la identificación de oportunidades en el mercado financiero. Disponible en diversas plataformas, el Didi Index Volume se ha convertido en una herramienta esencial para los traders que buscan información precisa y valiosa para sus estrategias de negociación. El indicador combina el reconocido Didi Index, creado por Odir Aguiar, c
Smart Binary Volume
Thalles Nascimento De Carvalho
El indicador Smart Binary Volume es una herramienta versátil que combina el análisis del volumen de negociación con el aprendizaje automático (machine learning). Puede aplicarse en diversos mercados y estrategias, incluyendo el scalping y otros tipos de operaciones a corto plazo. Utilizando algoritmos avanzados de aprendizaje automático, el indicador identifica patrones complejos, generando señales de compra y venta con mayor precisión. Buffer to Create EA. Buffer Line Gold = 0. Buffer Line R
TimeChannel
Thalles Nascimento De Carvalho
El "Timechannel" es una poderosa herramienta de análisis técnico diseñada específicamente para traders que desean obtener una comprensión más profunda y precisa de los movimientos de precios en múltiples marcos de tiempo (multi-timeframe). Este indicador es una adición esencial al conjunto de herramientas de cualquier trader serio que busca tomar decisiones comerciales informadas y basadas en datos. Características clave: - Análisis Avanzado de Múltiples Timeframes: Timechannel permite a l
Big Player Range
Thalles Nascimento De Carvalho
5 (2)
Descubre el Poder de "BigPlayerRange": Tu Aliado en el Análisis Técnico del Mercado Presentamos BigPlayerRange , una herramienta avanzada de análisis técnico diseñada para revelar las áreas de interés de los inversores institucionales en el mercado. Con ella, podrás identificar con precisión dónde están activamente involucrados los principales jugadores y cómo esto puede impactar tus estrategias de trading. Características Principales: Mapeo de Áreas de Interés Institucional : BigPlayerRa
Master OBV
Thalles Nascimento De Carvalho
MasterOBV: ¡Domina las Tendencias del Mercado con Precisión! MasterOBV es un indicador de análisis técnico que combina volumen , correlación positiva y una Media Móvil (MA) para refinar la identificación de tendencias en los mercados financieros. Principales Funcionalidades: Volumen Inteligente: Analiza el volumen de negociación para identificar cambios significativos en la fuerza de la tendencia. Correlación Positiva: Incorpora activos correlacionados para una visión más amplia y pr
Smart Delta Volume
Thalles Nascimento De Carvalho
Smart Delta Volume: Preciso y Adaptable a las Condiciones Dinámicas del Mercado Smart Delta Volume es un indicador técnico avanzado diseñado para ofrecer un análisis preciso y adaptable frente a los constantes cambios del mercado. Utilizando niveles dinámicos que se ajustan automáticamente según la volatilidad, este indicador proporciona una visión más completa y confiable de la interacción entre el flujo de volumen y la acción del precio. Esta capacidad de adaptación es crucial para los trad
VolaMetrics VSA
Thalles Nascimento De Carvalho
VolaMetrics VSA | Un Aliado Poderoso en el Análisis Técnico El VolaMetrics VSA es un indicador de análisis técnico que combina la metodología Volume Spread Analysis (VSA) con un análisis detallado del volumen de operaciones . Diseñado para identificar y rastrear movimientos significativos en los precios , el VolaMetrics VSA utiliza la interacción entre volumen y spread de precios para proporcionar información valiosa que puede ayudar en la toma de decisiones de trading. Fundamentos del Volume
CVD SmoothFlow Pro
Thalles Nascimento De Carvalho
CVD SmoothFlow Pro - ¡Análisis de Volumen Ilimitado para Cualquier Activo! CVD SmoothFlow Pro es la solución definitiva para traders que buscan un análisis de volumen preciso e ilimitado. Utilizando el cálculo de Cumulative Volume Delta (CVD) con filtrado avanzado de ruido, la Versión Pro ofrece la flexibilidad y precisión necesarias para operar en cualquier activo financiero. ¿Qué ofrece CVD SmoothFlow Pro? Análisis Claro : Filtra el ruido y destaca los movimientos de volumen significativ
VolumeSecret
Thalles Nascimento De Carvalho
VolumeSecret: El Poder del Volumen en tus Manos En el desafiante mundo de la programación, constantemente enfrentamos obstáculos que nos hacen crecer y evolucionar. Entendemos profundamente las dificultades que impone el mercado y cómo los traders luchan para alcanzar el máximo rendimiento. Por eso, trabajamos incansablemente para desarrollar soluciones innovadoras que hagan que la toma de decisiones en el mercado sea más fluida y precisa. VolumeSecret es el resultado de esta dedicación. Este av
Cumulative Vol Bands
Thalles Nascimento De Carvalho
CVB Cumulative Volume Bands: ¡Potencia tus operaciones con el volumen acumulado! CVB Cumulative Volume Bands es un indicador avanzado diseñado para traders que buscan señales precisas basadas en el volumen acumulado. Utilizando bandas de volumen acumulado, este indicador ofrece lecturas claras de la presión de compra y venta en el mercado, ayudando a identificar reversiones y movimientos fuertes. Características principales: Análisis de volumen acumulado : Detecta puntos clave de
ZigWave Oscillator
Thalles Nascimento De Carvalho
ZigWave Oscillator: ¡Potencia tus operaciones con osciladores y ZigZag! El ZigWave Oscillator es la herramienta perfecta para traders que buscan precisión y claridad al analizar el mercado financiero. Este indicador combina la fuerza de los osciladores con la simplicidad visual del ZigZag, ayudándote a identificar las mejores oportunidades de compra y venta con rapidez y eficiencia. ¿Por qué elegir ZigWave Oscillator? Análisis preciso de osciladores : Integra RSI, Williams %R o CCI par
Filtro:
No hay comentarios
Respuesta al comentario
Versión 1.5 2024.09.13
Improvement in delta calculation and better hardware management!
Versión 1.4 2024.08.16
Revisão para melhor compatibilidade com EA
Versión 1.3 2024.08.16
add buffers para os swings
Versión 1.1 2024.08.14
Atualização na função "all volumes"