Market Sentiment Calendar
- Indicadores
- Suvashish Halder
- Versión: 1.0
- Activaciones: 10
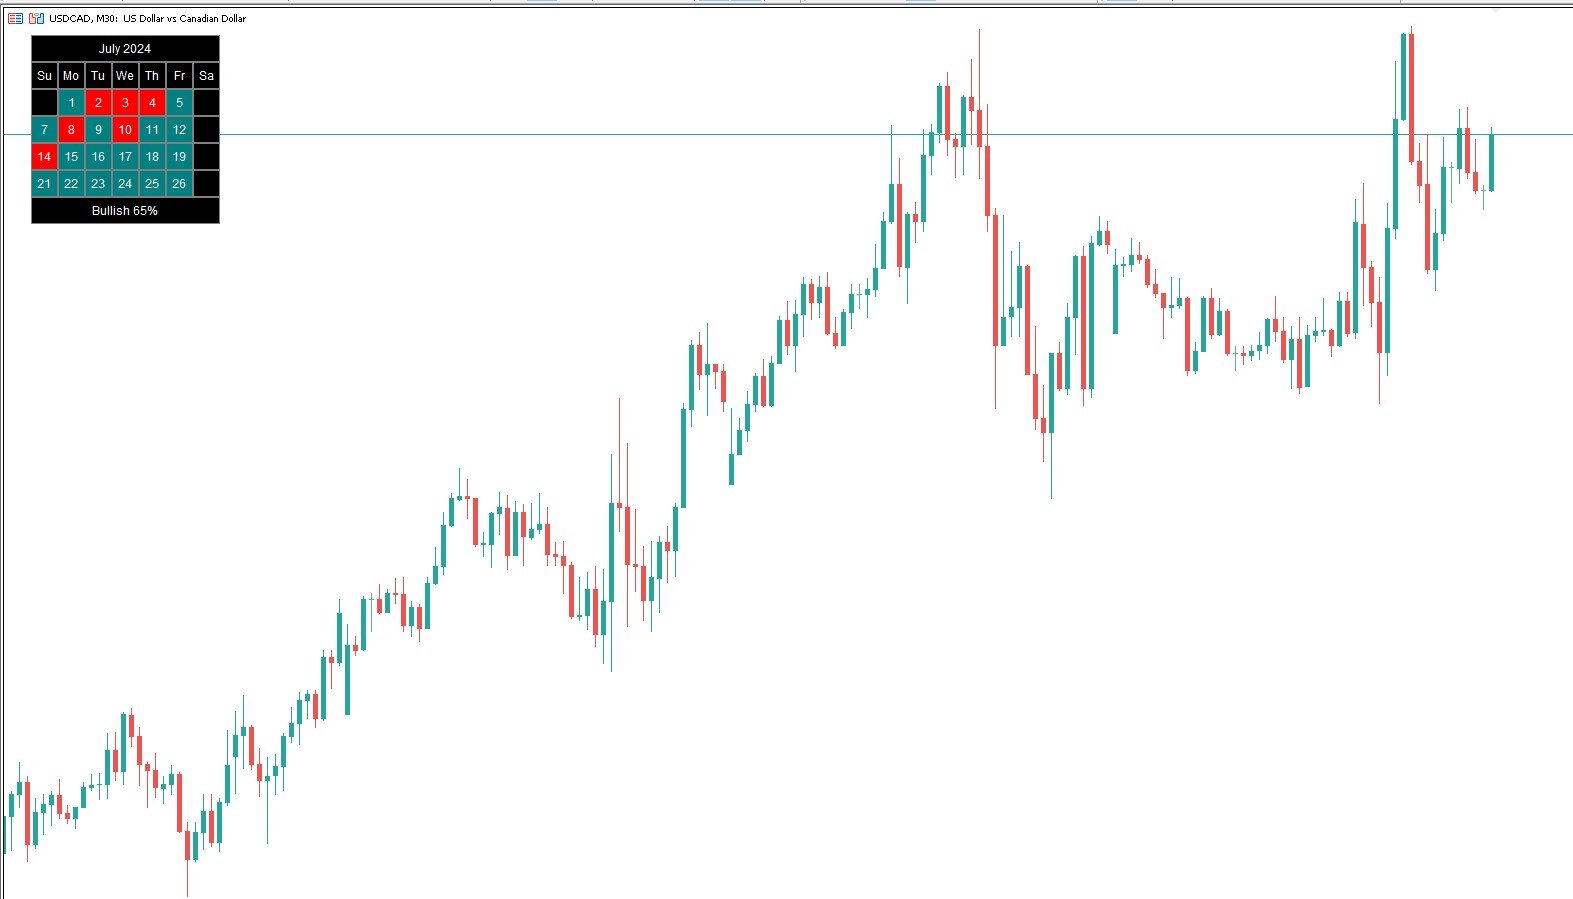
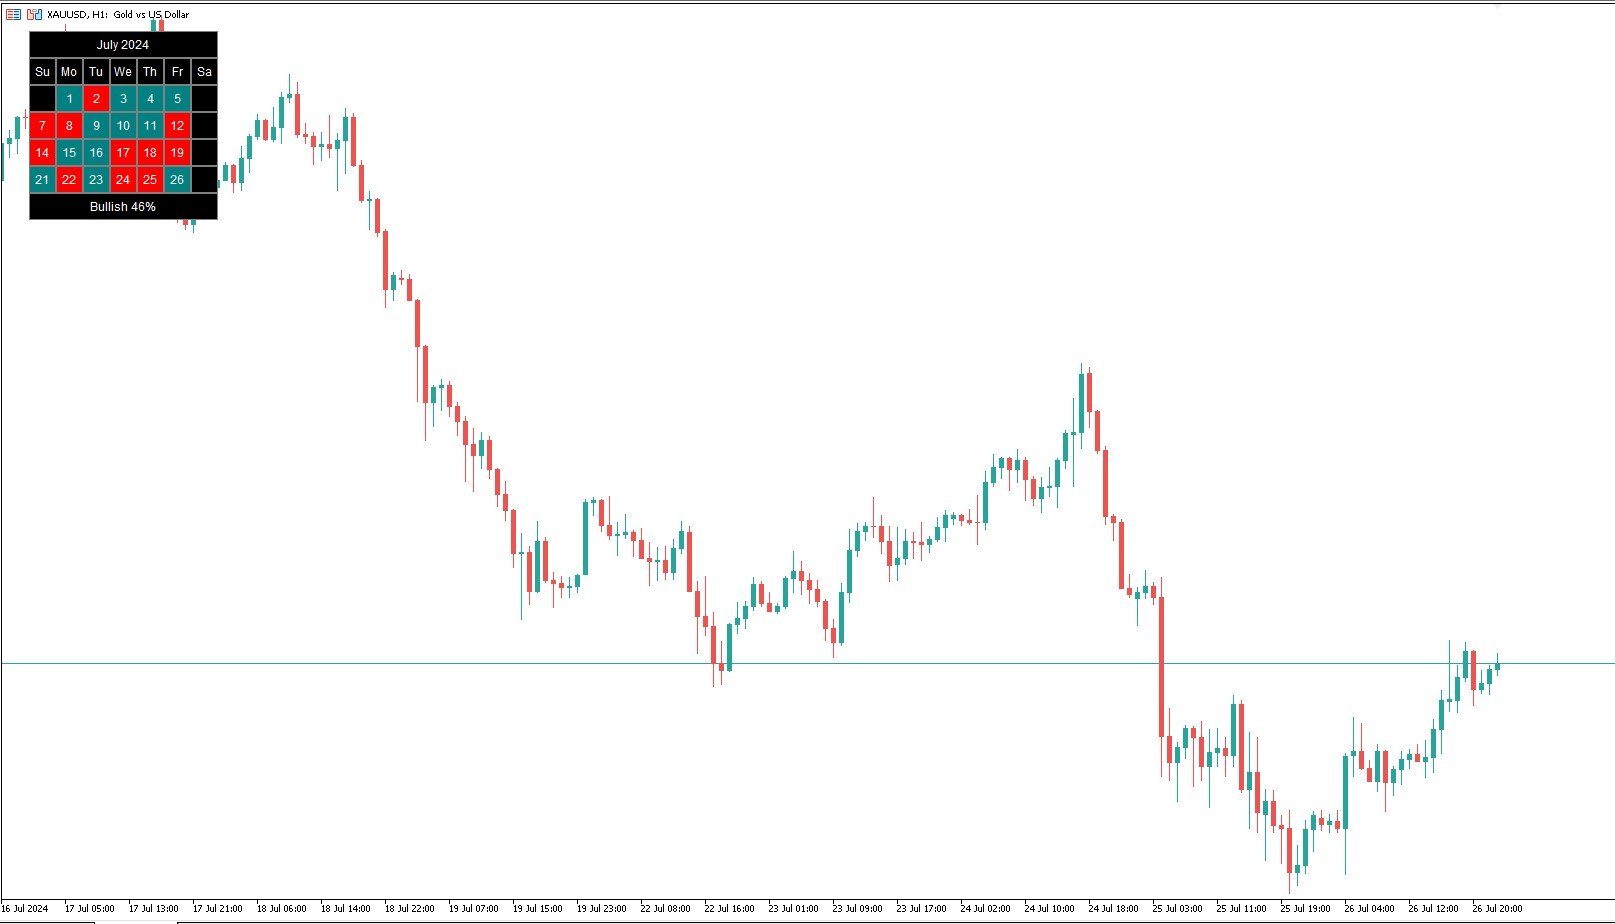
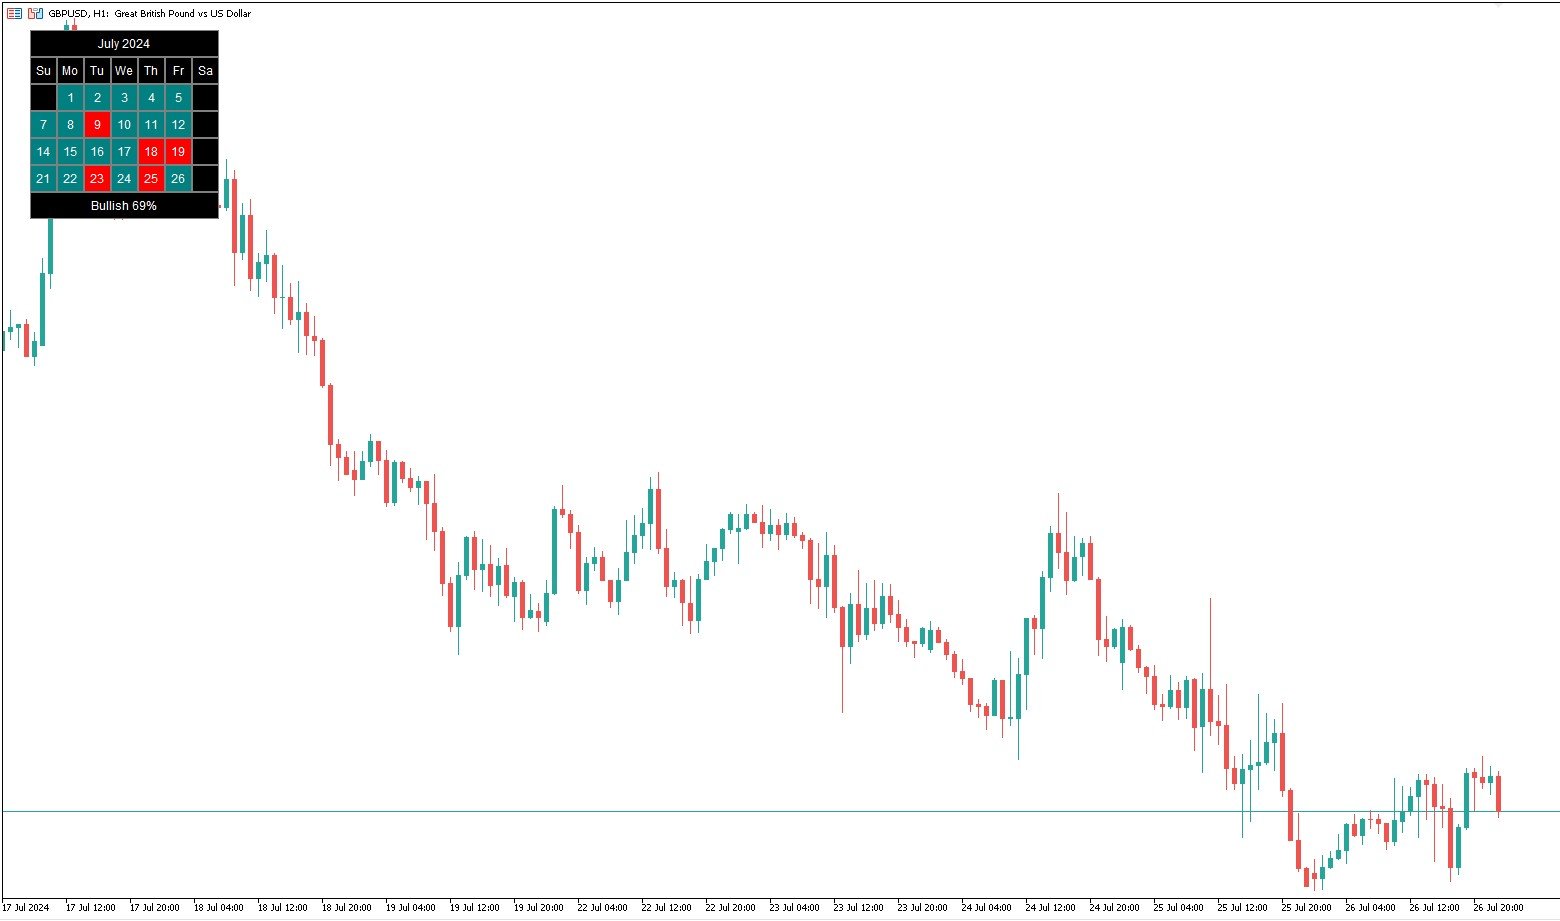
The Market Sentiment calendar provides a visual representation of market sentiment for each day or month. It will display daily and monthly BIAS.
The calendar also highlights the percentage of bullish days or months within a given month or year.
MT5 version - https://www.mql5.com/en/market/product/120768/
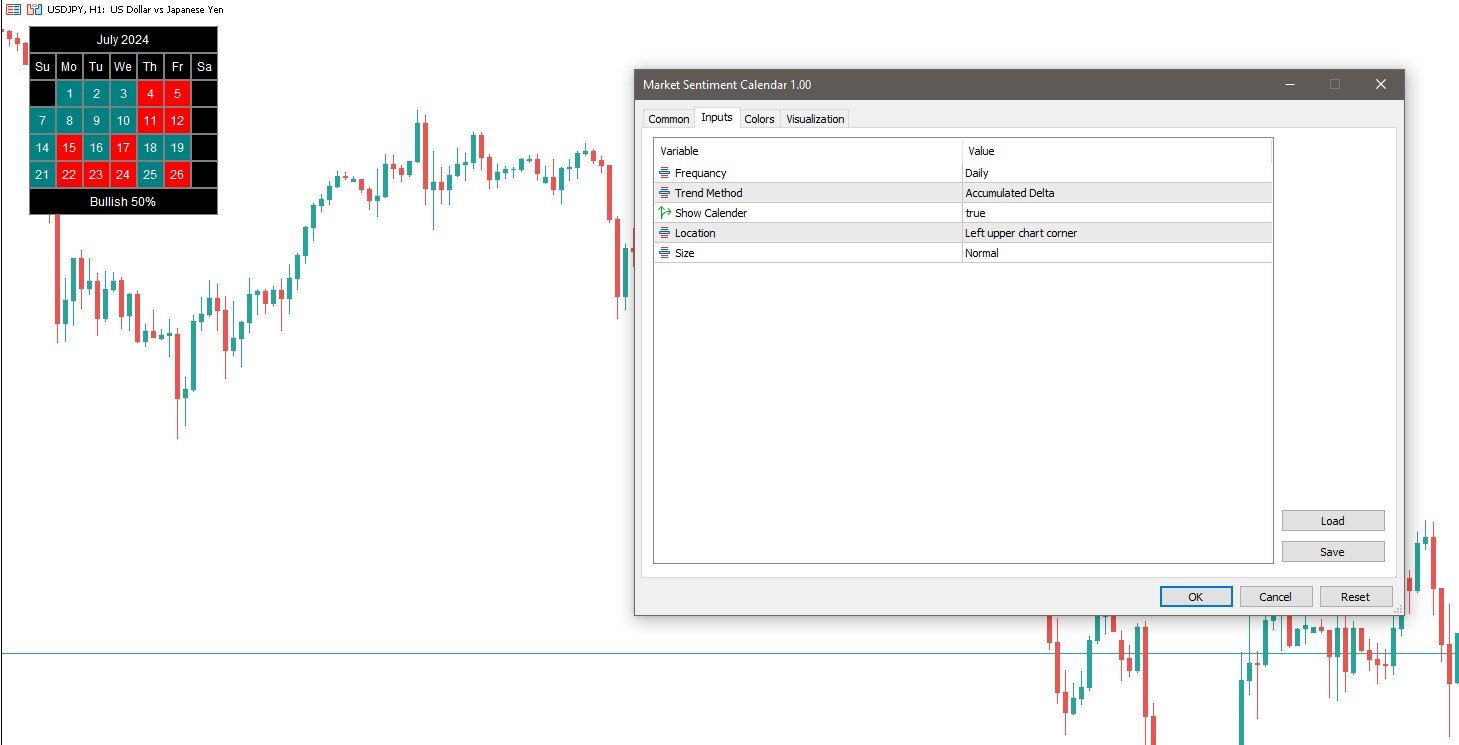
Inputs
- Frequency: Choose between "Daily" and "Monthly" calendar views.
- Sentiment Method: Select the method to determine daily or monthly sentiment: "Linear Regression", "Accumulated Deltas" or "Max/Min".
Calendar Options
- Show Calendar: Toggle the display of the calendar on or off.
- Location: Set the position of the calendar on the chart.
- Size: Adjust the size of the calendar.
How it works :
This script helps users quickly identify whether a specific day or month is bullish or bearish. Bullish days/months are marked in green, while bearish ones are marked in red.
Vertical lines are also drawn at the beginning of new days or months, color-coded to indicate the sentiment. Note that these colors may change retrospectively as new data is analyzed.
Sentiment Methods
Three methods are used to determine if a day or month is bullish or bearish, all based on the closing price and varying depending on the timeframe chosen:
- Linreg: Uses linear regression to fit lines between days/months. The slope of the line indicates sentiment: a rising line signifies a bullish trend.
- Accumulated Deltas: Calculates the net bullish and bearish price changes for the current day/month. The sentiment is determined by the direction with the highest magnitude.
- Max/Min: Computes trailing maximum and minimum prices for the current day/month. The sentiment is bullish if the price is above the average of these values.
This tool is designed to enhance trading decisions by providing clear, visual sentiment indicators directly on the chart.
Feel free to contact me if you need any assistance.