Stats Dashboard
- Utilidades
- Apex Software Ltd
- Versión: 1.2
- Actualizado: 22 septiembre 2024
- Activaciones: 10
Resumen
Utiliza el Panel de Estadísticas para seguir, analizar y mejorar tu rendimiento en el trading. Visualiza una selección de estadísticas clave en varios periodos, incluyendo diario, semanal, mensual y personalizado. Identifica fácilmente tus instrumentos con mejor y peor desempeño usando el gráfico interactivo de líneas.
El EA no se ejecuta en el probador de estrategias. Contáctanos para una prueba gratuita.
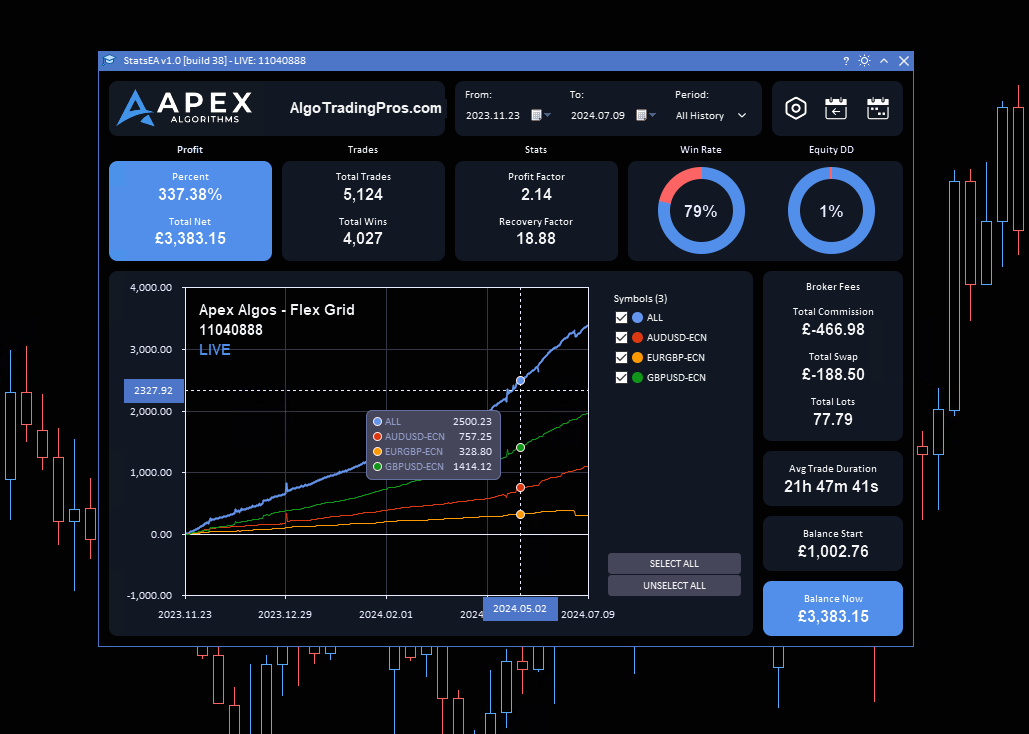
Estadísticas Mostradas:
- Beneficio - % de Beneficio y Total Neto $
- Operaciones - Total de Operaciones y Ganadas
- Estadísticas - Factor de Beneficio y Factor de Recuperación
- Porcentaje de Ganancias
- Reducción - Reducción de Capital % y Reducción de Saldo %
- Comisiones del Broker - Comisión Total y Total de Tarifas Swap
- Total de Lotes Operados y Duración Promedio de la Operación
- Saldo Inicial y Saldo Actual
Características Principales
- Métricas Detalladas de Beneficio y Rendimiento
- Análisis de Datos en Tiempo Real
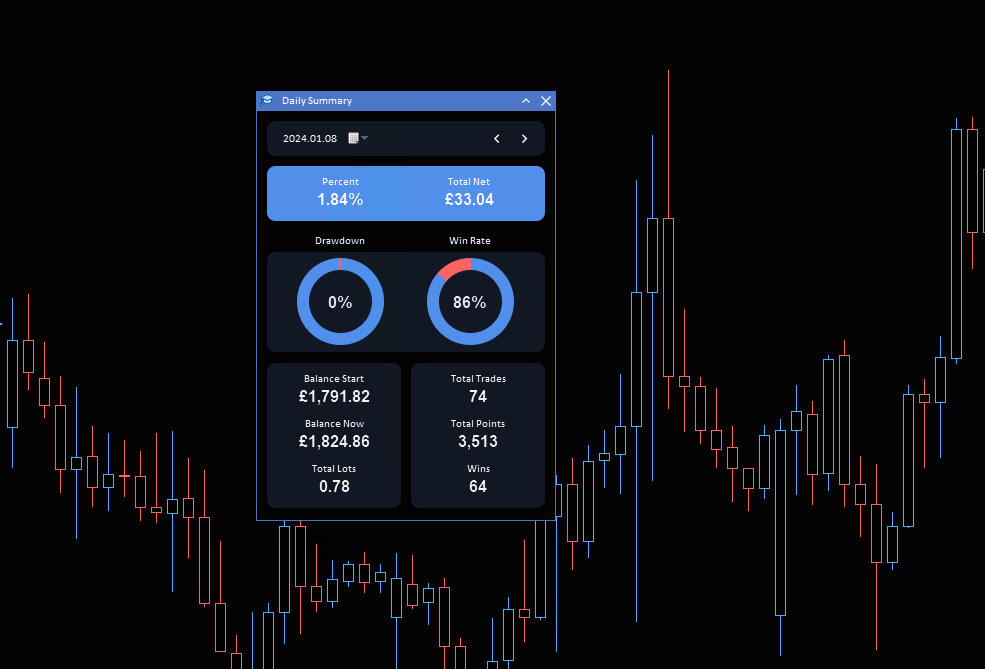
- Informes Resumidos Diarios
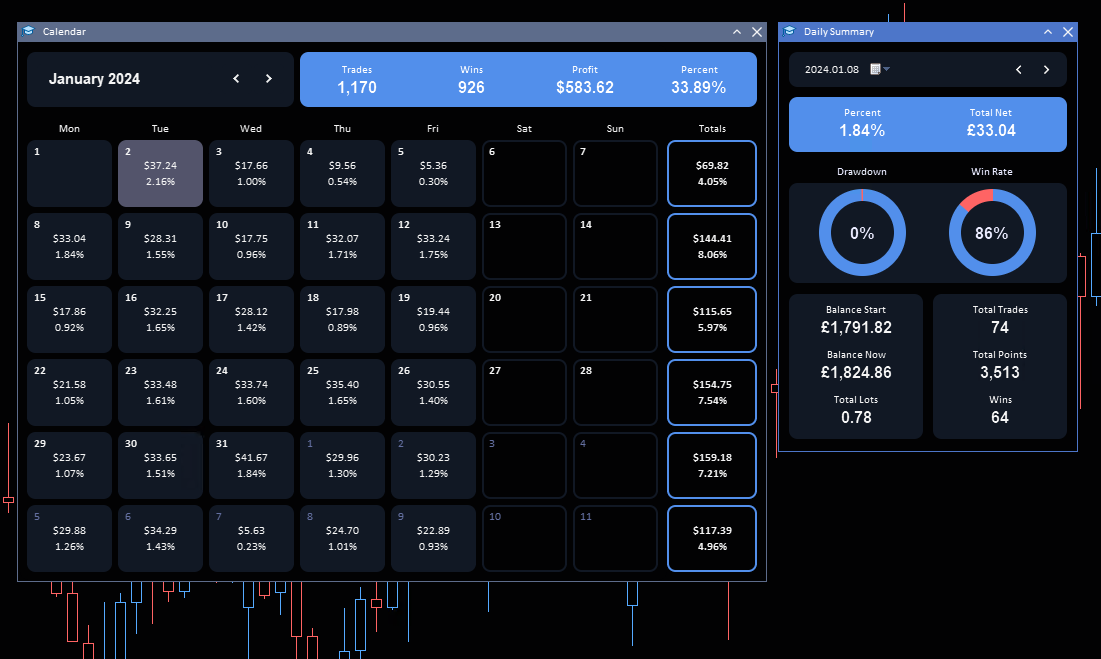
- Vista del Calendario Mensual
- Filtrado por Algoritmos Específicos (Números Mágicos)
Análisis de Datos en Tiempo Real
- Acceso a Datos de Trading en Tiempo Real: Mantente actualizado con los últimos movimientos del mercado y el rendimiento de tus operaciones.
- Toma Decisiones Informadas Basadas en Análisis del Mercado en Vivo: Utiliza datos actualizados para tomar decisiones de trading rápidas y precisas.
Informes Resumidos Diarios
- Mantente Informado con Resúmenes Diarios de Rendimiento: Revisa tus actividades diarias con informes detallados al final del día para asegurar que estás alineado con tus objetivos.
- Métricas Exhaustivas: Sigue indicadores clave de rendimiento como el total de operaciones, porcentaje de ganancias, factor de beneficio y más para entender mejor tu comportamiento y resultados en el trading.
Filtrado por Algoritmos Específicos
- Filtra Operaciones Usando Números Mágicos: Aísla y evalúa cómo están rindiendo los diferentes algoritmos o estrategias de trading.
- Filtros Personalizables en el Gráfico: En el gráfico, puedes filtrar datos por todos los símbolos de trading, seleccionar múltiples símbolos o enfocarte en pares de trading específicos, en cualquier rango de fechas.
Esta herramienta está diseñada para simplificar tu experiencia de trading y ayudarte a obtener mejores resultados.


A really great tool for providing insights into your trading performance, so that you can understand better what's working, when it's working and potentially how any adjustments may lead to better results. Highly recommended!