Macd ema crossover signals
- Indicadores
- Mattijs Roelof Jacob Nugteren
- Versión: 1.0
Cruce de MACD y EMA
El Cruce de MACD y EMA es un poderoso indicador de MetaTrader 5 (MT5) diseñado para generar señales de trading basadas en las intersecciones entre la Convergencia y Divergencia del Promedio Móvil (MACD) y el Promedio Móvil Exponencial (EMA). Este indicador ayuda a los traders a identificar oportunidades de compra y venta, con un enfoque específico en las inversiones de tendencia.
**Características:
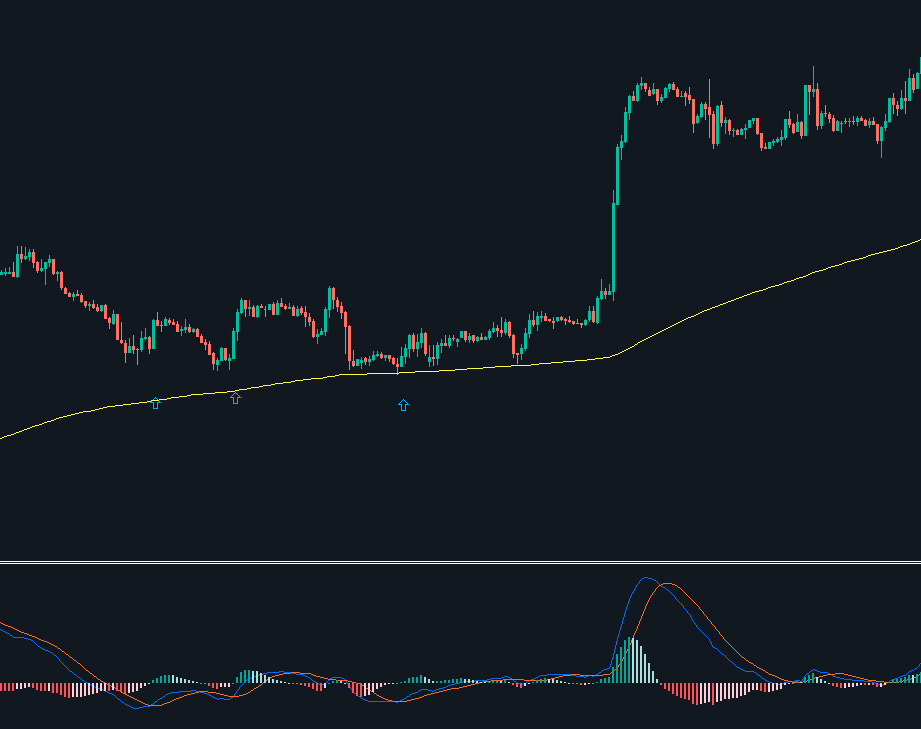
1. **Cruce de MACD por debajo de la línea 0 (Señal de Compra):**
- Cuando la línea MACD cruza la línea de señal y está por debajo de la línea 0, simultáneamente con el precio operando por encima del EMA (Promedio Móvil Exponencial), se genera una fuerte señal de compra. Esto indica un posible inicio de una tendencia alcista.
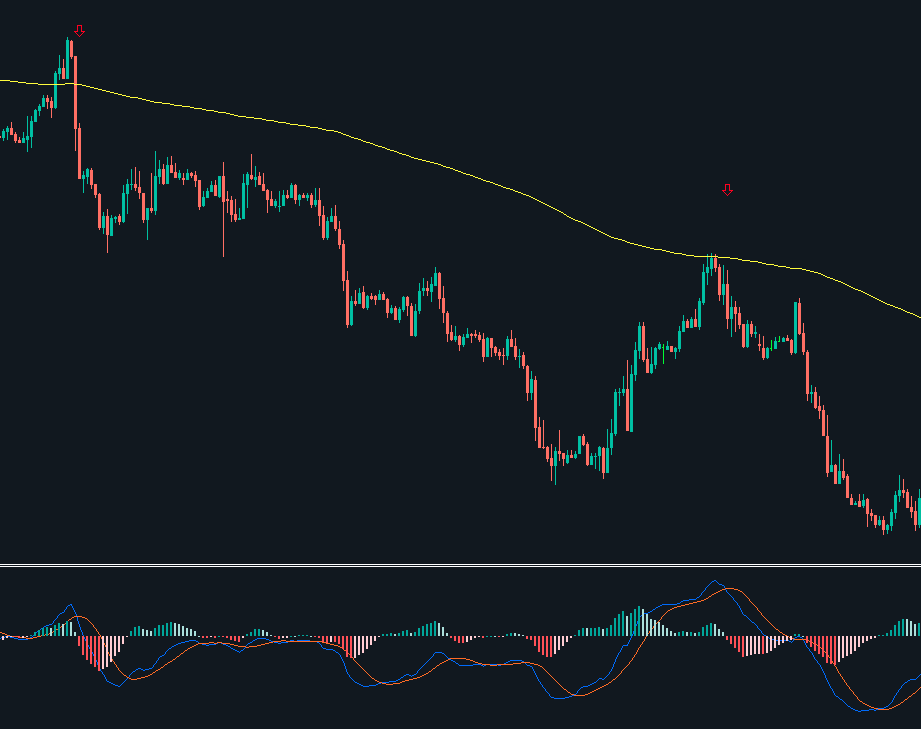
2. **Cruce de MACD por encima de la línea 0 (Señal de Venta):**
- En el escenario de venta, el indicador emite una señal de venta cuando la línea MACD cruza la línea de señal y está por encima de la línea 0, mientras que el precio está por debajo del nivel del EMA. Esto sugiere una posible inversión a una tendencia bajista.
**Uso y Aplicación:**
El indicador de Cruce de MACD y EMA está diseñado para ayudar a los traders a identificar posibles inversiones de tendencia, permitiéndoles capitalizar en puntos críticos del mercado. Esto puede ayudar a los traders a tomar decisiones informadas sobre la apertura o cierre de posiciones.
**Configuraciones:**
- **Período de MACD:** Establecer el período para el cálculo del MACD.
- **Período de EMA:** Definir el período para el Promedio Móvil Exponencial.
- **Línea de Señal:** Especificar el período para la línea de señal del MACD.
**Alertas:**
El indicador se puede personalizar con alertas para notificar a los traders de inmediato cuando haya una posible oportunidad de trading según los criterios definidos.
**Conclusión:**
El indicador de Cruce de MACD y EMA es una herramienta valiosa para los traders que buscan señales claras de inversiones de tendencia en los mercados financieros. Al enfocarse en las intersecciones de MACD y EMA, este indicador proporciona un enfoque estructurado para tomar decisiones de trading, lo que puede resultar en mejores resultados de trading.
El Cruce de MACD y EMA es un poderoso indicador de MetaTrader 5 (MT5) diseñado para generar señales de trading basadas en las intersecciones entre la Convergencia y Divergencia del Promedio Móvil (MACD) y el Promedio Móvil Exponencial (EMA). Este indicador ayuda a los traders a identificar oportunidades de compra y venta, con un enfoque específico en las inversiones de tendencia.
**Características:
1. **Cruce de MACD por debajo de la línea 0 (Señal de Compra):**
- Cuando la línea MACD cruza la línea de señal y está por debajo de la línea 0, simultáneamente con el precio operando por encima del EMA (Promedio Móvil Exponencial), se genera una fuerte señal de compra. Esto indica un posible inicio de una tendencia alcista.
2. **Cruce de MACD por encima de la línea 0 (Señal de Venta):**
- En el escenario de venta, el indicador emite una señal de venta cuando la línea MACD cruza la línea de señal y está por encima de la línea 0, mientras que el precio está por debajo del nivel del EMA. Esto sugiere una posible inversión a una tendencia bajista.
**Uso y Aplicación:**
El indicador de Cruce de MACD y EMA está diseñado para ayudar a los traders a identificar posibles inversiones de tendencia, permitiéndoles capitalizar en puntos críticos del mercado. Esto puede ayudar a los traders a tomar decisiones informadas sobre la apertura o cierre de posiciones.
**Configuraciones:**
- **Período de MACD:** Establecer el período para el cálculo del MACD.
- **Período de EMA:** Definir el período para el Promedio Móvil Exponencial.
- **Línea de Señal:** Especificar el período para la línea de señal del MACD.
**Alertas:**
El indicador se puede personalizar con alertas para notificar a los traders de inmediato cuando haya una posible oportunidad de trading según los criterios definidos.
**Conclusión:**
El indicador de Cruce de MACD y EMA es una herramienta valiosa para los traders que buscan señales claras de inversiones de tendencia en los mercados financieros. Al enfocarse en las intersecciones de MACD y EMA, este indicador proporciona un enfoque estructurado para tomar decisiones de trading, lo que puede resultar en mejores resultados de trading.