• Información general
  • Comentarios (8)
  • Discusión (11)
  • Novedades

Enigmera

5

ENIGMERA: El núcleo del mercado

Importante: La demostración de MQL5.com se ejecuta en el Strategy Tester y puede no reflejar completamente la funcionalidad de Enigmera. Consulta la descripción, las capturas de pantalla y el video para más detalles. ¡No dudes en contactarme si tienes alguna pregunta!

El código del indicador ha sido completamente reescrito. La versión 3.0 añade nuevas funcionalidades y elimina errores acumulados desde el inicio del indicador.
Introducción
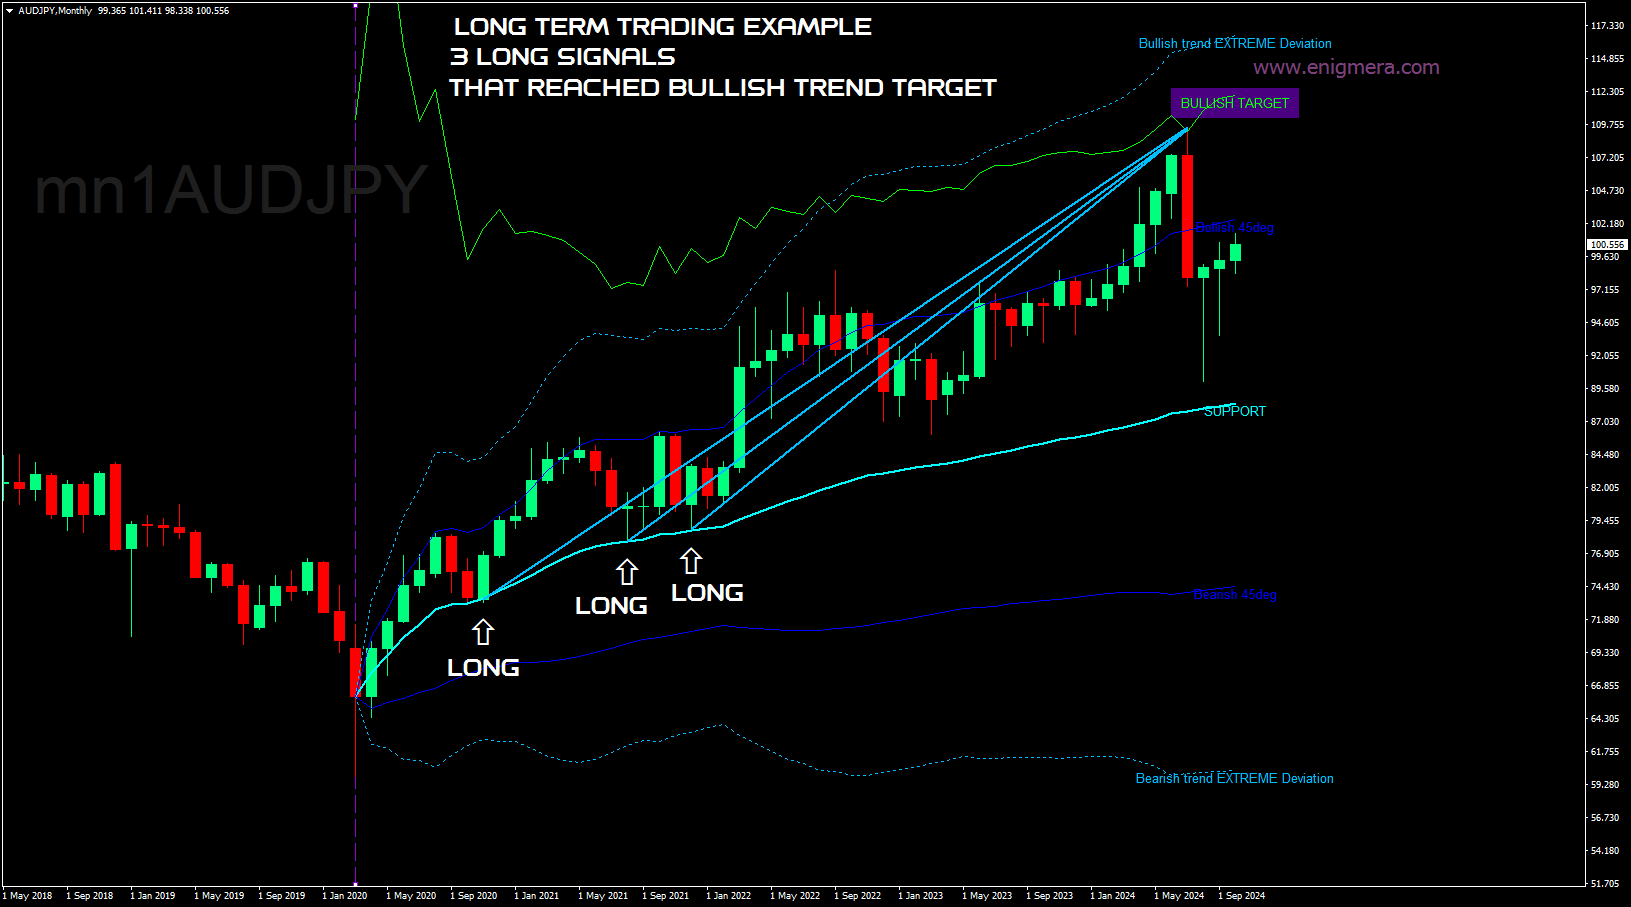
Este indicador y sistema de trading es un enfoque notable para los mercados financieros. ENIGMERA utiliza ciclos fractales para calcular con precisión los niveles de soporte y resistencia. Muestra la fase auténtica de acumulación y proporciona dirección y objetivos. Un sistema que funciona tanto en tendencias como en correcciones.

Cómo funciona
La mayor parte de la funcionalidad del indicador se controla mediante botones en el lado izquierdo del gráfico, lo que permite una respuesta rápida ante diferentes condiciones del mercado.

Botones

  1. ON/OFF – Muestra o esconde todo el indicador.
  2. Channel – Activa el canal de soporte, indicando un rango aceptable de desviación.
  3. Dev1 (Primera desviación) – Indica el movimiento del precio dentro de la desviación de soporte, señalizando consolidación del mercado o acumulación de fuerza.
  4. Dev2 (Segunda desviación) – Muestra el movimiento del precio entre las desviaciones, señalizando la formación y dirección de la tendencia.
  5. Dev3 (Tercera desviación) – Indica una aceleración significativa de la tendencia y alta volatilidad.
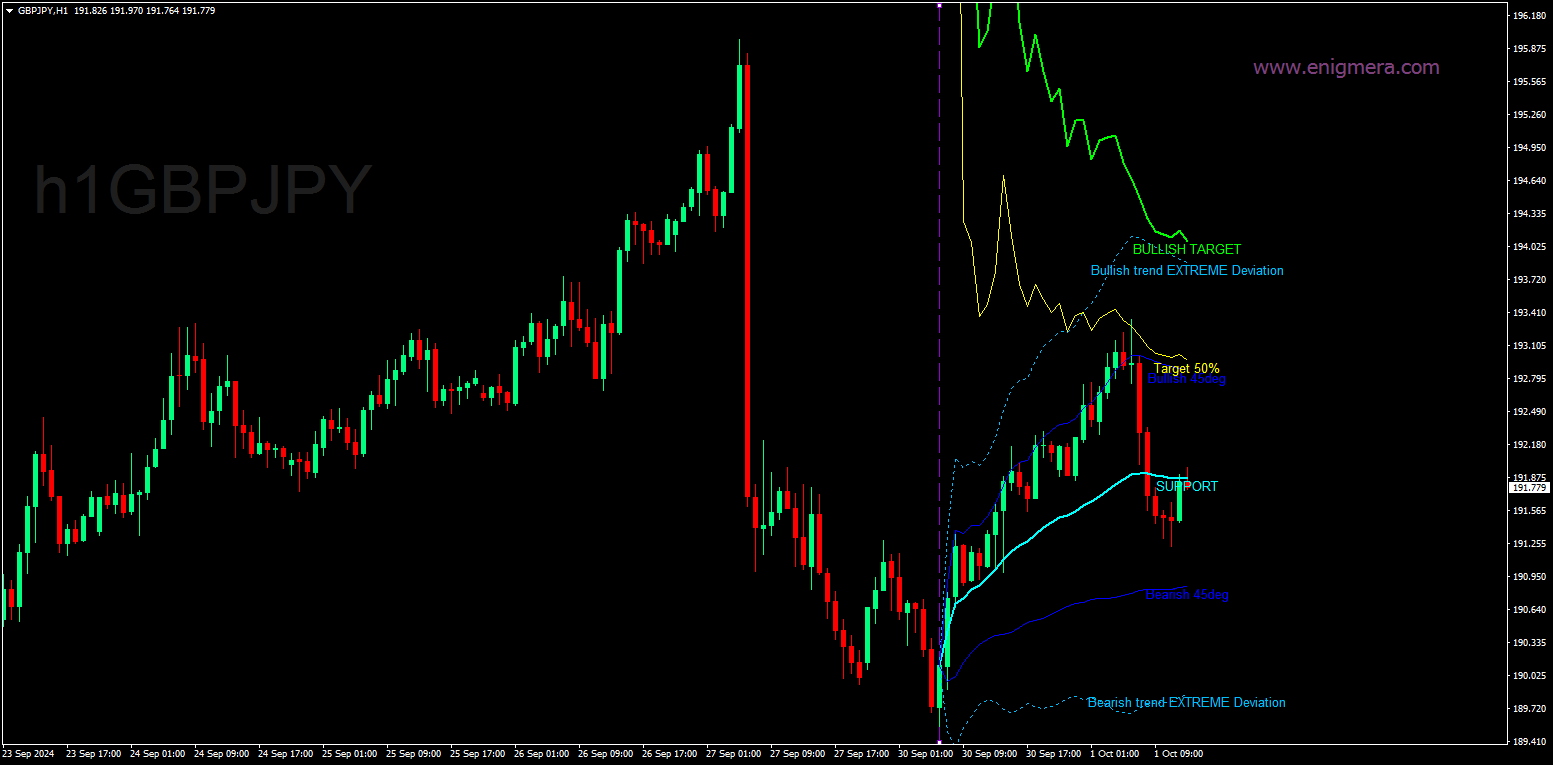
  6. 45deg (45 grados) – Muestra el ritmo del mercado y la estabilidad del movimiento en relación con la línea de 45 grados.
  7. Tgt1/2 (Objetivo medio) – Representa la mitad de la línea de objetivo de la tendencia, utilizada en la fase final del mercado.
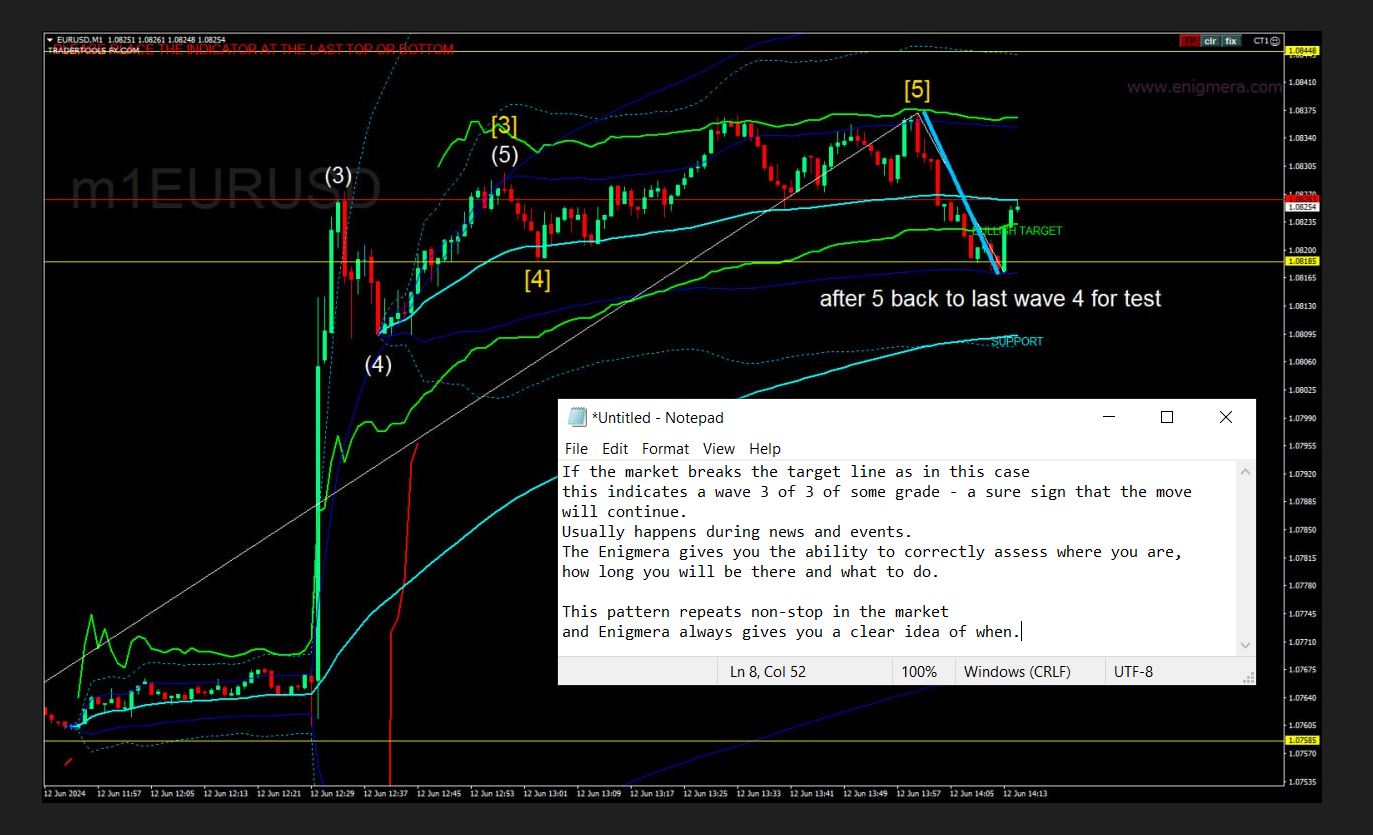
  8. Tgt (Objetivo) – La línea objetivo de la tendencia, indicando niveles para cerrar posiciones.
  9. Vol (Volumen) – Muestra puntos de volumen en las velas, indicando cambios significativos en el volumen del mercado.
  10. X – Muestra una "X" cuando el mercado alcanza la línea de objetivo.
  11. Lbls (Etiquetas) – Muestra o esconde las etiquetas en las líneas.
  12. RandC (Colores aleatorios) – Cambia los colores de las líneas y etiquetas del indicador para una mejor visualización.

Sistema
ENIGMERA proporciona una imagen completa del presente, a diferencia de los indicadores de mercado típicos que solo extrapolan datos pasados al presente y futuro. Si estás en soporte, es soporte real; si estás en resistencia, es resistencia real. Un nivel roto indica un cambio en la tendencia.

ENIGMERA está diseñado para analistas financieros y consultores que necesitan compartir información confiable con los clientes, así como para inversores que exigen la máxima precisión y confianza.

Destaca por su precisión óptima, permitiendo a los traders evaluar sus opciones con claridad y confianza.

Combinando 20 años de experiencia en trading y conocimientos en un solo paquete, ENIGMERA es tanto intuitivo como dependiente del usuario. Su efectividad depende de la configuración adecuada por parte del usuario para maximizar el rendimiento.

Recomendaciones:

  • Par de divisas: Todos los pares, todos los mercados
  • Plazo: Todos los plazos
  • Depósito mínimo: Sin depósito mínimo
  • Tipo de cuenta: Sin limitaciones
  • Corredores: Sin limitaciones

Este sofisticado indicador es ideal para estrategias efectivas de trading diario y scalping. Optimiza tu trading discrecional con los algoritmos avanzados de Enigmera, adecuado para mercados de Forex, acciones, índices y criptomonedas. Diseñado para MetaTrader 4, Enigmera simplifica la gestión de stop-loss y riesgos.

Todas las herramientas que necesitas para convertirte en un trader exitoso. Enigmera funciona en todos los mercados y plazos, sin redibujar.

¿Estás listo para llevar tu toma de decisiones financieras al nivel más alto?


Comentarios 8
smso9466eiou
85
smso9466eiou 2025.02.23 15:38 
 

a very good indicator that composes all in one, entry, exit and reverse. Great!

Osazeme Usen
432
Osazeme Usen 2024.12.31 12:38 
 

This is probably the best indicator I have seen in marketplace. Fantastic analysis with phenomenal success rates.

Update: Not great for direction, but fantastic for TP and SL.

vincenzo1964
984
vincenzo1964 2024.07.11 15:59 
 

Assolutamente straordinario a cominciare da chi l'ha ideato Ivan, Sono assolutamete felice dell'affito/prova fatto, Enigmera è sorprendente, ti accompagna sempre sul lato giusto della tendenza sino alla fine del percorso. Se poi parliamo del dott. Ivan e della sua disponbilità, se potessi postare gli screenshot e la guida passo passo che mi ha concesso, è commovente e sorprendente. Se volete fare buon trading con giudizio e responsabilità potete tranquillamente perdere qualche giorno del vostro tempo a capire la logica ed il ragionamento che c'è dietro enigmera, solo così sarete sempre dal lato giusto del trend sino alla fine, sopratutto quando ci sono le news ed enigmera già vi sta indicando i livelli di tp da raggiungere. Proprio oggi ero già lon su eurusd e sell su usdchf ed entrambe dopo le notizie chiuse in tp. Consiglio anche l'indicatore Speed, leggetene l'utilizzo, la forza e ciò che vi può indicare, io ci sto lavorando sodo seguito da ivan perchè l'unione di enigmera e speed è devastante, alla fine dell'affitto acquisterò engmera mentre affitterò mensilmente speed (il costo è di 30.00€ mentre l'acquisto è di 3000€), ma il suo potenziale per il trend followhing e immenso, saluti e buon trading a tutti, grazie Ivan...

Productos recomendados
This is an arrow indicator without a future function,developed based on the most advanced profit trading algorithms.It has the most innovative and advanced dual trend analysis module, as well as the latest and highly effective market trend prediction algorithm.Trends are your friends, and following larger trends can earn the maximum profit in foreign exchange. This indicator helps traders identify current trends and track them. Someone once made a profit of 10 times in a week by relying on it.No
Robot revendedor para marco de tiempo M5. Opera en el par de divisas GBPUSD. Este robot ha sido especialmente desarrollado por una empresa de comerciantes profesionales para operar con la libra esterlina. El robot abre aproximadamente de 5 a 15 operaciones por día. Lo mejor es operar con corredores que tengan un margen bajo en GBPUSD de hasta 10 pips. El depósito mínimo recomendado para comenzar es de $500 o más. ventajas: no usa martingala. no una red. cada operación tiene un stop loss. bot p
VR Cub
Vladimir Pastushak
VR Cub es un indicador para obtener puntos de entrada de alta calidad. El indicador fue desarrollado para facilitar los cálculos matemáticos y simplificar la búsqueda de puntos de entrada a una posición. La estrategia comercial para la cual se diseñó el indicador ha demostrado su eficacia durante muchos años. La simplicidad de la estrategia comercial es su gran ventaja, que permite que incluso los operadores novatos negocien con éxito con ella. VR Cub calcula los puntos de apertura de posiciones
The Penta-O is a 6-point retracement harmonacci pattern which usually precedes big market movements. Penta-O patterns can expand and repaint quite a bit. To make things easier this indicator implements a twist: it waits for a donchian breakout in the right direction before signaling the trade. The end result is an otherwise repainting indicator with a very reliable trading signal. The donchian breakout period is entered as an input. [ Installation Guide | Update Guide | Troubleshooting | FAQ | A
El indicador "Auto FIBO Pro" de Crypto_Forex es una gran herramienta auxiliar para operar. - El indicador calcula y coloca automáticamente en el gráfico los niveles de Fibonacci y las líneas de tendencia locales (color rojo). - Los niveles de Fibonacci indican áreas clave donde el precio puede revertirse. - Los niveles más importantes son 23,6 %, 38,2 %, 50 % y 61,8 %. - Puede usarlo para scalping de reversión o para operar en cuadrículas de zonas. - También existen muchas oportunidades para m
Blahtech Market Profile
Blahtech Limited
4.53 (15)
Was: $249  Now: $149   Market Profile defines a number of day types that can help the trader to determine market behaviour. A key feature is the Value Area, representing the range of price action where 70% of trading took place. Understanding the Value Area can give traders valuable insight into market direction and establish the higher odds trade. It is an excellent addition to any system you may be using. Blahtech Limited presents their Market Profile indicator for the MetaTrader community. In
Night ghost
Dmitriy Kashevich
Night Ghost - Indicador de flecha para opciones binarias. ¡Este es un asistente confiable para usted en el futuro! - Sin redibujar en el gráfico -¡Funciona muy bien en todos los pares de divisas! -Indicador de precisión de hasta el 90% (Especialmente de noche) -No es necesario configurar durante mucho tiempo (configurar perfectamente para opciones binarias) - Señales no tardías - La aparición de una señal en la vela actual. -Perfecto para el período M1 (¡No más!) - Color de vela agrada
Advanced Trend Regime
Shellard Securities (Pty) Ltd
The indicator has been designed to function on any time-frame and any pair.   This regime filter will help the trader better evaluate whether the current market is trending, and in which direction. It quickly reacts to changes in market dynamics using a series of advanced calculations. The user is able to select whether the calculation remains standard, or if a further filter constraint is added to the calculation.   A Yellow moving average of the signal has been included for the trader to smoot
Alpha Trend sign has been a very popular trading tool in our company for a long time. It can verify our trading system and clearly indicate trading signals, and the signals will not drift. Main functions: Based on the market display of active areas, indicators can be used to intuitively determine whether the current market trend belongs to a trend market or a volatile market. And enter the market according to the indicator arrows, with green arrows indicating buy and red arrows indicating se
Gold Phoenix
Yaroslav Varankin
The perfect tool for Scalng in the Forex markets You can trade both from signal to signal and using take profit  The algorithm does not use Zigzag!  No redrawing!  This is a channel instrument that uses a moving average as a filter. Moving Average  There are 2 parameters for the settings Ma Period = 5 period Moving Average  Channel 1.0 distance of channel lines from the chart Price Signal Filter - calculation of signal opening and filter There is a complete set of Alert There is a multi-timefram
Renko, Heiken Ashi, Ticks Bar, Range Bar.    Easy switching, easy setup, all in one window.        Place the Custom Chart indicator and view Renko, Heiken Ashi, Tick bar, Range bar charts in real time at real chart.    Position the offline chart window so that the indicator control panel is visible.    Switch the chart mode by click of a button.    Connect to the output chart any indicator, expert advisor without any restrictions.    No, it doesn't work in the tester.    Yes, you can use an
The main idea of this indicator is rates analysis and prediction by Fourier transform. Indicator decomposes exchange rates into main harmonics and calculates their product in future. You may use the indicator as a standalone product, but for better prediction accuracy there is another related indicator - FreqoMaster - which uses FreqoMeterForecast as a backend engine and combines several instances of FreqoMeterForecast for different frequency bands. Parameters: iPeriod - number of bars in the ma
Binary Options Support Resistance Indicator This indicator is designed for binary options trading and effectively shows retracements from support and resistance levels. Signals appear on the current candle. A red arrow pointing downwards indicates a potential selling opportunity, while a blue arrow pointing upwards suggests buying opportunities. All that needs adjustment is the color of the signal arrows. It is recommended to use it on the M1-M5 timeframes as signals are frequent on these timef
The indicator provides a superior alternative to price action analysis. It enables the identification of normalized patterns, which are then transformed into a graphical representation to forecast future steps within a time series. In the top-left corner, you'll find information regarding the expected prediction accuracy, determined through a complex MSQE calculation. You have the flexibility to adjust the time window, making it easy to validate the indicator's performance. Additionally, you can
Trend lines master
The Trading Team Ltd
5 (1)
Launch promotion For a limited time only:  30$ instead of 157$ Summary Create precise trend lines in a second Description This indicator will draw your trend lines automatically with great precision, saving you some precious time. It uses Bill Williams Fractals to identify the key points and draws both inner and outer trend lines. Features Automatically draws precise trend lines
Fourteen plus nine TD Sequential
MOHAMMED IMAD HUSSEIN BASSEE
Fourteen plus nine What is it for? Applying Tom DeMark’s TD Sequential serves the purpose of identifying a price point where an uptrend or a downtrend exhausts itself and reverses. . What are the main components of TD Sequential? TD Sequential has two parts – TD Setup and TD Countdown. The first phase of TD Sequential starts with a TD Setup and is completed with a 9 count. When the 9 count is completed, it is at that point, a price pause, price pullback, or reversal is likely. It is also at tha
Trend Flasher Trend is your friend is the age old saying quote in trading arena, there are though many ways to gauge the trend and its direction, more scientific measure and logically meaningful will be an ATR break outs to identify and spot the trend and its acceleration, so we created this easy to use trend identification panel and optimized super trend based multi time frame panel entry system to aid and help the traders to make their trading decision. Unique Features of Trend Flasher 1. H
PABT Pattern Indicator - it's classical system one of the signal patterns. Indicator logic - the Hi & Lo of the bar is fully within the range of the preceding bar, look to trade them as pullback in trend. In the way if indicator found PABT pattern it's drawing two lines and arrow what showing trend way.  - First line - it's entry point and drawing at: 1. On the high of signal bar or on middle of the signal bar (depending from indicator mode) for buy; 2. On the low of signal bar or on middle of t
Trend Ray
Andriy Sydoruk
The indicator shows the potential trend direction by cyclical-wave dependence. Thus, all the rays of the intersection will be optimal rays, in the direction of which the price is expected to move, taking into account the indicator period. Rays can be used as a direction for potential market movement. But we must not forget that the approach must be comprehensive, the indicator signals require additional information to enter the market.
Easy Trade indicator
Felipe Carvalho De Queiroz
Easy Trade Indicator – Your Path to Profitable Trades! Work any Time Frame! Maximize your profits with precise and assertive trades! ️ Trade with comfort – the indicator does the analysis and you only open the order in the direction in which the indicator shows you!  Exclusive panel with past trade counter and accuracy tracking! Simplify your analysis, boost your performance, and trade with confidence! Get it now and take your trading to the next level
Trade with Gann on your side!! MASTER CIRCLE 360 CIRCLE CHART, originally created by Gann admitted that this is “The Mother of all charts”. It is one of the last studies that this great trader left for us. The numeric tab le is apparently quite simple like all the tables and is based on square numbers, the SQUARE OF 12 and is by evolution, one of the most important square numbers. Here we can find CYCLE, PRICE AND TIME thanks to angles and grades, to show past and future support and resistance.
The Chaikin Oscillator is a technical indicator developed by Marc Chaikin that combines price and volume data to measure the accumulation and distribution of a financial instrument. It aims to identify potential buying and selling opportunities in the market. The Chaikin Oscillator is calculated by subtracting a 10-day exponential moving average of the Accumulation Distribution Line (ADL) from a 3-day exponential moving average of the ADL. Here's how to use the Chaikin Oscillator indicator in tr
Elliott Wave Trend was designed for the scientific wave counting. This tool focuses to get rid of the vagueness of the classic Elliott Wave Counting using the guideline from the template and pattern approach. In doing so, firstly Elliott Wave Trend offers the template for your wave counting. Secondly, it offers Wave Structural Score to assist to identify accurate wave formation. It offers both impulse wave Structural Score and corrective wave Structure Score. Structural Score is the rating to sh
Gartley Projection D
Oleksandr Medviediev
3.71 (7)
El indicador identifica los patrones armónicos (XABCD) según los desarrollos de H.M.Gartley ("Beneficios en el mercado de valores", 1935г). Proyecta el punto D como un punto en la proyección en perspectiva (especifique ProjectionD_Mode = true en la configuración). No vuelve a dibujar. Cuando se cierra una barra del período de trabajo, si el punto del patrón identificado no se ha movido durante las barras Patterns_Fractal_Bars, aparece una flecha en el gráfico (en la dirección del movimiento e
Master Scalping M1 es un indicador innovador que utiliza un algoritmo para determinar la tendencia de forma rápida y precisa. El indicador calcula el tiempo de apertura y cierre de posiciones, los algoritmos del indicador le permiten encontrar los momentos ideales para ingresar a una operación (comprar o vender un activo), lo que aumenta el éxito de las transacciones para la mayoría de los comerciantes. Beneficios del indicador: Fácil de usar, no sobrecarga el gráfico con información innecesari
Atomic Analyst
Issam Kassas
5 (2)
En primer lugar, vale la pena enfatizar que este Indicador de Trading no repinta, no redibuja y no se retrasa, lo que lo hace ideal tanto para el trading manual como para el automatizado. Manual del usuario: configuraciones, entradas y estrategia. El Analista Atómico es un Indicador de Acción del Precio PA que utiliza la fuerza y el impulso del precio para encontrar una mejor ventaja en el mercado. Equipado con filtros avanzados que ayudan a eliminar ruidos y señales falsas, y aumentan el poten
Trend PA
Mikhail Nazarenko
5 (3)
The Trend PA indicator uses   Price Action   and its own filtering algorithm to determine the trend. This approach helps to accurately determine entry points and the current trend on any timeframe. The indicator uses its own algorithm for analyzing price changes and Price Action. Which gives you the advantage of recognizing, without delay, a new nascent trend with fewer false positives. Trend filtering conditions can be selected in the settings individually for your trading style. The indicator
How to use Pair Trading Station Pair Trading Station is recommended for H1 time frame and you can use it for any currency pairs. To generate buy and sell signal, follow few steps below to apply Pair Trading Station to your MetaTrader terminal. When you load Pair Trading Station on your chart, Pair Trading station will assess available historical data in your MetaTrader platforms for each currency pair. On your chart, the amount of historical data available will be displayed for each currency pai
Los compradores de este producto también adquieren
La VELOCIDAD DE TRANSACCIÓN es el indicador de mayor calidad que muestra dónde y cuándo se acumulan grandes órdenes en el mercado y los beneficios de ello. Detecta los cambios de tendencia en una fase muy temprana. Es a la vez un indicador y un sistema de trading. El concepto es único e increíblemente rentable. En Forex, el volumen de ticks se denomina engañosamente volumen. En realidad, se trata de la variación del precio por unidad de tiempo, que de hecho es la VELOCIDAD DE TRANSACCIÓN. Este
Bomb Bank Signal
Igor Pereira Calil
5 (1)
Señal de Bomb Bank: su indicador de confianza en MetaTrader 4 Bomb Bank Signal es un poderoso indicador para MetaTrader 4, diseñado para identificar las tendencias más relevantes en el mercado financiero. Si buscas una herramienta que anticipe los movimientos con precisión, el Bomb Bank es el aliado que necesitas. Cómo funciona: Este indicador combina tres métodos distintos (análisis de volumen, cierre de velas y tendencia simétrica) para detectar y señalar oportunidades de compra y venta. B
Gann Zone Pro
Kirill Borovskii
This indicator identifies and displays zones, as it were areas of strength, where the price will unfold. The indicator can work on any chart, any instrument, at any timeframe. The indicator has two modes. The indicator is equipped with a control panel with buttons for convenience and split into two modes. Manual mode: To work with manual mode, you need to press the NEW button, a segment will appear. This segment is stretched over the movement and the LVL button is pressed. The level is displayed
Trade Invest Pro - Boss in the world of cryptocurrency! This indicator is ideal for cryptocurrency trading! Work on Trade Invest Pro took us half a year! But not in vain! Now only accurate signals near support - resistance levels! He showed himself well on timeframes m5 m15 for binary options! Optionally, it can be configured for forex for timeframes m30 and more! Reacts well to news! Doesn't paint! and does not disappear from the schedule! As soon as a red arrow appears, open a deal fo
Gann Swing Structure
Kirill Borovskii
5 (1)
This indicator is based on the mathematics of the great trader W.D. Ganna. With its help, you can easily find strong levels by analyzing swings to find the optimal entry point. The indicator works on all instruments and all timeframes. The indicator is fully manual and has control buttons. All you need to do is press the NEW button, a segment will appear, which you can place on any movement, swing or even 1 candle that you want to analyze. By placing the segment, press the OK button. A grid (th
API Reversal Master
Idowu Peter Afuye
1 (1)
API Reversal Master – The Reversal Detection Indicator for MT4 Spot Reversals with API Reversal Master API Reversal Master is MT4 indicator designed to help traders identify possible market reversals . Whether you're trading forex, stocks, or commodities, this tool provides alerts and visual cues to enhance your decision-making. Key Features: Alerts and Notification – Get notified when a possible reversal point is detected. Color Changes – Visual indication of possible trend shifts.
ZO Trend
Trung Le Hoang
4 (4)
Important!! ZO Trend can't work on MN timeframe. /*--------------------------------------------------------------------------------------------------------------------------------------------------------------------------------------------- ZO Trend an indicator used to search for entry point. With the session candle algorithm on many timeframe, ZO Trend creates an area for traders find good Entry Point. ZO SYSTEM BASIC SETUP :  https://www.youtube.com/watch?v=qdNOXHWozNw ZO TREND User guide : 
Connect Indicator
Sukunthakan Ngernbamrung
Connect Indicator is a tool used for connecting indicators between the MQL market and MT4. The connected indicators are made by our group and can be used for other applications, such as sending messages to the Line application or Telegram application. If you have any questions, please don't hesitate to ask us to receive support. Function and indicator buffer Buffer one is the high price of the previous candle. Buffer two is the high price of the previous candle. Usage To connect indicators to fu
Por supuesto, aquí tienes la traducción al español: Presentamos el Indicador de Astronomía para MT4: Tu Compañero Celestial Definitivo en el Trading ¿Estás listo para elevar tu experiencia de trading a alturas celestiales? No busques más allá de nuestro revolucionario Indicador de Astronomía para MT4. Esta innovadora herramienta trasciende los indicadores de trading tradicionales, aprovechando el poder de algoritmos complejos para proporcionarte una visión astronómica sin igual y cálculos de pre
Mafaranga
Phillimon Shumbusho
The real market buy/Sell signals, you can trust.  This indicator tracks the trend strength, the market strength, the real current volume, and the price direction to give traders and investors the optimum point for entry in the form of signals. The time frames range from 5 minutes to one (1) hour chart. Trading on higher time frames produce the best outcomes, but also do produce less frequent trades, compared to trading on lower time frames.
Smooth price for Monarch MT4
Konstantin Gruzdev
3.67 (3)
The Smooth Price technical indicator is used for plotting a smoothed line as close to the price of the financial instrument as possible, and serves to eliminate its noise components. The indicator is part of the Monarch trading system, but here it is presented as an independent technical analysis tool. The indicator is based on the cluster digital filter , which, unlike the ClusterSMA , is applied directly to the price time series. Smooth Price does not redraw (except the very last, zero bar) an
Jeslyn
Justine Kelechi Ekweh
This is a multipurpose system that adapts both to manual Forex traders as a speculation system or a strategy to obtain a very strong boost, binary options traders or to be used by universal EAs in automated trading. Jeslyn es una estrategia basada en años de investigación y se enfoca en una estrategia de acción de precio particular. Puede parecer un simple indicador de flecha, pero tiene algoritmos sofisticados y lógicos. No extrae sus cálculos de otros indicadores, solo basa sus cálculos en
Arbitrage Indicators is a professional and easy-to-use Forex trading indicator that uses the best trading principles of the latest AI arbitrage models. This indicator provides accurate buy and sell signals. Applies to currency pairs only. It has six different metrics options, MACD, KDJ, RSI, CCI, RVI, DEMARK. It can be freely switched by users, and intuitively shows the direction and reversal signal of the currency pair. When the two lines cross colors, the currency has a high probability of rev
Market Interest
Paul Edunyu Carissimo
Indicador de interés del mercado: su ventaja en el análisis del sentimiento comercial Beneficios clave: Cuantifica la participación de los participantes del mercado en tiempo real Combina la acción del precio y la dinámica del volumen. Revela el sentimiento oculto del mercado más allá de los indicadores tradicionales Adaptable a múltiples marcos temporales y activos. Sistema de alerta temprana para posibles cambios de tendencias Ventajas para el comerciante: Identificar períodos de aumento/dismi
Oni Scalper
Goh Cheng Wai
3.67 (3)
Dear Onis, This Indicator is used for   GBPUSD, US30 and GOLD on 1-Min Chart . For US30 , Depending on your broker, Minimum Lot Size will differ from 0.01 to 1.0 lots. My Current Account is trading at 1.0 lots at $1 per point . Please check with your Broker what's the Margin Required for your Minimum lot sizes before you trade on your Real account. I have Forward Tested the indicator for around 6 months before releasing it to the public. ( No Demo is available for the Indicator, Strategy Teste
Automatic, live & interactive picture of all trendlines. Assign push, email and sound alerts to the lines of your choice and be informed about price rollback, breakout, rollback after breakout, number of rollbacks, line expiration by double breakout. Correct, drag or delete the lines and interactively tune the line system. https://youtu.be/EJUo9pYiHFA . Chart examples https: //www.mql5.com/en/users/efficientforex Price Interaction Events All events are effective immediately and only after one
The indicator displays the probable ( Support and resistance ) levels. The indicator draws horizontal and trend levels of support and resistance. The indicator settings: Trends - the mode for displaying trend lines or horizontal lines of support and resistance Yes - display trend lines only No - display horizontal lines only UseResource - use the resources built into the indicator. Yes - use the ZigZag indicator from the resources of the product. No - use a custom ZigZag indicator. HistoryBar -
The [GRAFF] III manual trading system is based on multiple MetaTrader (MT4) indicators. Together, the entire PACK of GRAFF III indicators makes an advanced trading tool. The system consists of over 20 different custom-built indicators which have been carefully selected and tested in the long term to produce strong and efficient trading signals. The particular indicators are based on different mathematical formulas, so the entire system is calibrated to remove false signals from its own indicator
This indicator allows you to see the strength of the trend on all timeframes. It can be used for all currency pairs. The indicator can be displayed in the form of a column (from left to right): status buy / sell / strong buy / strong sell, strength of the trend in percentage, pips last candle, body candle now, remaining time, and the timeframe of M1 to MN. Information contained below (from left to right): total trend percent, sell percent, buy percent.
You can fins our other products from link : https://www.mql5.com/en/users/drbastem/seller   Also, you can ask all your questins from email : haskayafx@gmail.com or mobile : +90 530 867 5076 or @MehmetBastem    on telegram application This indicator is used to determine the trend. Standard Osma indicator is used. It has the indicator warning system: beep, e-mail and has three types of alerts, including messages to mobile phone. It shows the best performance on the chart of 5 minutes. When the
You can fins our other products from link : https://www.mql5.com/en/users/drbastem/seller   Also, you can ask all your questins from email : haskayafx@gmail.com or mobile : +90 530 867 5076 or @MehmetBastem    on telegram application This indicator is used to determine the trend. Standard Three Moving Average and ADX indicators are used. It has the indicator warning system (audio, e-mail) and three types of alerts, including messages to mobile phone. It shows the best performance on M5. When
This indicator is used to determine the trend. Standard Three Moving Average and ADX indicators are used. It has the indicator warning system (audio, e-mail) and three types of alerts, including messages to mobile phone. It shows the best performance on M5. When the trend value reaches the value set, the warning system is activated. This indicator works only with Forex symbols. Inputs SoundAlarm = true - Sound Alert Sendmail=true - Send an e-mail in case of a buy or sell signal Sendnotification
You can fins our other products from link : https://www.mql5.com/en/users/drbastem/seller   Also, you can ask all your questins from email : haskayafx@gmail.com or mobile : +90 530 867 5076 or @MehmetBastem    on telegram application This indicator is used to determine the trend. Standard MACD indicator is used. It has the indicator warning system: beep, e-mail and has three types of alerts, including messages to mobile phone. It shows the best performance on the chart of 5 minutes. When the
Este indicador ofrece un sólido método de análisis de mercado centrado en el concepto de 'Herramienta de Canal de Regresión'. Al aprovechar esta herramienta, los traders pueden obtener un control excepcional sobre el canal de regresión de sus gráficos, lo que les permite tomar decisiones comerciales más informadas. La Herramienta de Canal de Regresión es un instrumento poderoso en el arsenal de un trader. Está diseñada para proporcionar información valiosa sobre las tendencias de precios y los p
A simplistic indicator informing a user on RSI divergence by sending messages to mobile device and email. The indicator draws 2 vertical lines, marking two RSI extrema that formed the divergence. You get the alert, open the charts and make a decision. The indicator does not show past divergences, thus when you attach it to a chart for the first time you see nothing. Graphics and alerts will appear as soon as divergences do. Drop it in Tester to see how it works. Parameters: RSIPeriod - number of
ZLevels
Sergio Andres Zuleta Lopez
Este indicador está basado en la metodología del Market Profile, que contiene el Z-Zone , a diferencia de este último, permite la visualización de múltiples marcos de tiempo en un mismo gráfico.  Esta metodología ha mostrado ser muy efectiva para: Disminuir el número de ventanas para analizar o hacer seguimiento a un activo. Visualizar zonas importantes de resistencia (RoZ), soporte (SoZ) y distribución media (PoC) en diferentes periodos de tiempo.  Definir zonas para tomar utilidades y ubicar s
Green Wall Arrows
Daniel Luchinger
1 (1)
El Nombre Green_Wall_Arrows : Usando un Tp pequeño y mucho free margin, nos da la oportunidad de generar una muralla verde de profits que van saliendo, a medida que vamos tomando TP. Sin necesidad de usar SL para equilibrar los Tp pequeños de salida. Esta estrategia es una forma de operar los mercados, creada por mi y el indicador tan solo una herramienta mas. Puede ser Usado en Binarios. Este indicador Funciona en Barras Abiertas, Las flechas desaparecen si el mercado en contra de las flechas.
Golden Monowave
Ahmed Mohamed Ali
Golden Monowave is monowave indicator, the monowave theory is one of Elliott wave approach and one of most complicate and accurate method. Golden Monowave can shortcut many major steps to identify and describe the monowave. It works on any timeframe and with any trading instrument, including currencies, indices, futures, etc. Input Parameters initial_Bars - set the initial number of bars to calculate. wave_color - select the color of the wave. label_color - select the color of labels. temp_labe
Shark Surfer is a new generation indicator applying a well-established trend-following trading. The product is good both for scalping, as well as medium- and long-term trading. Shark Surfer analyzes a selected symbol and shows the recommended market entry, take profit and stop loss levels. Shark Surfer trades on all symbols and timeframes. It also features email and push notifications concerning the new trading signals. The indicator searches for suitable market entry points on an already formed
Otros productos de este autor
Meravith
Ivan Stefanov
El indicador analiza el volumen desde cada punto y calcula los niveles de agotamiento del mercado para ese volumen. Consiste en tres líneas: Línea de agotamiento del volumen alcista Línea de agotamiento del volumen bajista Línea que indica la tendencia del mercado. Esta línea cambia de color para reflejar si el mercado es bajista o alcista. Puedes analizar el mercado desde cualquier punto de inicio que elijas. Una vez que se alcance una línea de agotamiento de volumen, identifica un nuevo punto
La VELOCIDAD DE TRANSACCIÓN es el indicador de mayor calidad que muestra dónde y cuándo se acumulan grandes órdenes en el mercado y los beneficios de ello. Detecta los cambios de tendencia en una fase muy temprana. Es a la vez un indicador y un sistema de trading. El concepto es único e increíblemente rentable. En Forex, el volumen de ticks se denomina engañosamente volumen. En realidad, se trata de la variación del precio por unidad de tiempo, que de hecho es la VELOCIDAD DE TRANSACCIÓN. Este
GANN Master
Ivan Stefanov
5 (1)
Los objetivos precisos de GANN se calculan según sus métodos probados a lo largo del tiempo y se presentan justo frente a ti. Esta herramienta está diseñada para hacer que el trading sea más sencillo e intuitivo. Al mover la línea blanca hacia arriba o la línea verde hacia abajo, verás de inmediato por qué las técnicas de GANN siguen siendo influyentes en el mundo del trading. Las estrategias de GANN se centran en predecir los movimientos del mercado con gran precisión, y esta herramienta pone
Imbalance Pro
Ivan Stefanov
5 (3)
El indicador mide el desequilibrio entre alcistas y bajistas durante un periodo elegido y muestra una línea recta entre los dos puntos. Si los toros tienen más volumen que los osos, la línea se vuelve verde.  Si los osos tienen más volumen, se vuelve roja. La línea también muestra la diferencia porcentual de volumen. El indicador muestra los mismos datos en una ventana separada. También puede ver el volumen dividido. El indicador tiene dos modos. Para ello, hay un botón en la parte superio
Fifty Pro
Ivan Stefanov
5 (1)
El indicador FIFTY ahora está disponible en una versión automatizada, eliminando la necesidad de dibujar los niveles manualmente. Esta versión traza automáticamente los niveles diarios, semanales, mensuales y anuales en el gráfico, garantizando precisión y ahorrando tiempo. Además, incluye botones para alternar la visibilidad de estos niveles, permitiendo una personalización total. Para quienes lo prefieran, la versión gratuita del indicador sigue estando disponible y completamente funcional, br
Sense
Ivan Stefanov
5 (2)
SENSE es un sistema automatizado que combina métodos GANN seleccionados con cálculos fractales. El sistema nos dice dónde abrir y cerrar operaciones. Ya no es necesario perder tiempo en cálculos complejos: SENSE lo hace todo por usted. Sólo tiene que instalar el indicador. Principios básicos: El mercado es alcista cuando el precio está por encima de las líneas blancas. Compre por encima de las líneas blancas, pare por debajo Las líneas verdes son objetivos alcistas El mercado es bajista cuan
Fortex
Ivan Stefanov
5 (1)
Fortex: Indicador de Fuerza de Divisas Fortex es una herramienta poderosa para medir la fuerza de las principales divisas: USD, EUR, JPY, GBP, AUD, CAD, CHF y NZD. Simplemente agregue el indicador a su gráfico, y automáticamente mostrará las divisas más fuertes y más débiles para cualquier marco de tiempo. El indicador incluye una opción personalizable para establecer el número de velas utilizadas en el cálculo. De forma predeterminada, utiliza 100 velas, pero puede ajustar fácilmente esta confi
FREE
Este indicador se basa en la experiencia práctica.  Introduce la fecha/hora de tu top/bottom. Calcula el nivel más visitado desde el top/bottom hasta el momento actual. Se actualiza automáticamente con cada nueva vela. Puede utilizar simultáneamente varios indicadores para diferentes tendencias y plazos. La duración se traza siempre desde el inicio del periodo hasta el momento actual. Útil herramienta PRO.
FREE
Levelss
Ivan Stefanov
5 (1)
El indicador LEVELSS muestra: - Zona diaria alcista y bajista. Es visible todos los días de 00:00 a 23:59.  - La zona semanal alcista y bajista. Es visible desde las 0:00 del lunes hasta las 23:59 del viernes de cada semana. - Canal especialmente calculado de un marco temporal específico que se muestra en todos los demás marcos temporales. Por defecto, se trata del marco temporal de 4 horas que puede cambiar a cualquier otro marco temporal en el que desee operar. Se calcula sin parar. En la p
Two Snakes
Ivan Stefanov
5 (2)
2 SNAKES es un sistema de scalping de primera clase. Como las entradas son bastante precisas, es probable que se convierta en adicto a este sistema muy rápidamente.  Usted tiene 2 serpientes. Cuando usted ve una vela por encima o por debajo de ellos que no los toca - que es su señal de scalping. Si utiliza un marco de tiempo mayor, el scalping puede convertirse en seguimiento de tendencia. Las serpientes se calculan con precisión en relación con el estado actual del mercado. NO SON medias
Fifty
Ivan Stefanov
The 50% level holds significant importance in the market because it acts as a dividing line between bullish and bearish movements. Traders often rely on this midpoint to analyze trends and predict potential reversals. It is among the most logical and widely recognized concepts in financial markets. The 50% level also serves as a psychological barrier, influencing decisions of both retail and institutional traders, making it a cornerstone in technical analysis. One of the few indicators on the ma
FREE
Separated Volume
Ivan Stefanov
5 (1)
Este indicador separa eficazmente el volumen de ticks en el mercado de divisas en categorías alcistas y bajistas. Además, proporciona la funcionalidad de calcular y mostrar la suma de los volúmenes de ticks alcistas y bajistas para cualquier período seleccionado de su elección. Puede ajustar fácilmente el periodo moviendo las dos líneas azules del gráfico, lo que permite un análisis de volumen personalizable y preciso adaptado a sus necesidades de negociación. Si lo encuentra útil, ¡sus come
FREE
Este es el indicador Rolling VWAP para MetaTrader. Calcula el Precio Promedio Ponderado por Volumen (VWAP) basado en el volumen de ticks a lo largo de un número determinado de velas, con bandas opcionales de desviación estándar para un análisis más profundo del mercado. Este indicador no se redibuja y no está anclado. Descripción del Indicador Cálculo de Rolling VWAP : La línea principal (color aqua) calcula el VWAP para un número específico de barras ( barsToCalculate ). Este VWAP se ajusta ten
Stefanov
Ivan Stefanov
The indicator displays support and resistance zones defined logically using the MACD. The entire concept is explained in the video, with specific examples shown. The indicator works on any instruments and timeframes. It does not repaint. After placing it on the chart, please go through all the timeframes sequentially, from monthly to 1-minute, so that all lines load correctly. After that, you can start using it. The concept is unique and has not been seen in other systems or indicators.
Versuss
Ivan Stefanov
Versuss es una herramienta especial. El indicador puede crear nuevas herramientas para tu análisis. Puedes comparar dos instrumentos cualesquiera en tu plataforma. Ejemplo 1 Si estás operando USDJPY, tu análisis también puede incluir SP500 y NIKKEI225. Con Versuss, puedes comparar cómo se mueve un índice en relación con otro y luego comparar esto con el par USDJPY. Si el mercado de divisas sigue los movimientos de los índices, puedes obtener un pronóstico claro de lo que sucederá a continuación
FREE
En el mundo del trading, una tendencia que sigue un ángulo de 45 grados se considera sostenible.  Sin embargo, medir con precisión este ángulo crítico sigue siendo un reto, ya que no existe un método claro descrito. Los operadores sólo pueden adivinar cómo se calcula, cuántas velas deben contarse y cuál es el zoom adecuado para el gráfico. Hemos resuelto este problema y definido todas las condiciones de forma lógica, y ahora le presentamos Trend Angle 45. Se trata de una herramienta que visual
Filtro:
smso9466eiou
85
smso9466eiou 2025.02.23 15:38 
 

a very good indicator that composes all in one, entry, exit and reverse. Great!

Ivan Stefanov
2900
Respuesta del desarrollador Ivan Stefanov 2025.02.23 18:12
Thank you! Wishing you profits!
Rutt Tungkiratichai
1630
Rutt Tungkiratichai 2025.02.01 00:11 
 

This is very good and accurate indicator.

Ivan Stefanov
2900
Respuesta del desarrollador Ivan Stefanov 2025.02.01 11:30
Thank you for the good words! Brgds / Ivan
Osazeme Usen
432
Osazeme Usen 2024.12.31 12:38 
 

This is probably the best indicator I have seen in marketplace. Fantastic analysis with phenomenal success rates.

Update: Not great for direction, but fantastic for TP and SL.

Ivan Stefanov
2900
Respuesta del desarrollador Ivan Stefanov 2025.01.02 16:45
Osazeme Usen 2024.12.31 12:38 # EN
This is probably the best indicator I have seen in marketplace. Fantastic analysis with phenomenal success rates. Thank you for the good words! Brgds/Ivan
vincenzo1964
984
vincenzo1964 2024.07.11 15:59 
 

Assolutamente straordinario a cominciare da chi l'ha ideato Ivan, Sono assolutamete felice dell'affito/prova fatto, Enigmera è sorprendente, ti accompagna sempre sul lato giusto della tendenza sino alla fine del percorso. Se poi parliamo del dott. Ivan e della sua disponbilità, se potessi postare gli screenshot e la guida passo passo che mi ha concesso, è commovente e sorprendente. Se volete fare buon trading con giudizio e responsabilità potete tranquillamente perdere qualche giorno del vostro tempo a capire la logica ed il ragionamento che c'è dietro enigmera, solo così sarete sempre dal lato giusto del trend sino alla fine, sopratutto quando ci sono le news ed enigmera già vi sta indicando i livelli di tp da raggiungere. Proprio oggi ero già lon su eurusd e sell su usdchf ed entrambe dopo le notizie chiuse in tp. Consiglio anche l'indicatore Speed, leggetene l'utilizzo, la forza e ciò che vi può indicare, io ci sto lavorando sodo seguito da ivan perchè l'unione di enigmera e speed è devastante, alla fine dell'affitto acquisterò engmera mentre affitterò mensilmente speed (il costo è di 30.00€ mentre l'acquisto è di 3000€), ma il suo potenziale per il trend followhing e immenso, saluti e buon trading a tutti, grazie Ivan...

Irfan
1276
Irfan 2024.06.21 13:44 
 

El usuario no ha dejado ningún comentario para su valoración

Ivan Stefanov
2900
Respuesta del desarrollador Ivan Stefanov 2025.01.02 16:46
Irfan 2024.06.21 13:44 # EN
Enigmera gives you an entirely different way of looking at the market. It does not look into the past, what has happened in the past stays in the past it gives you a picture of what is going on in the market right now and gives you logical understanding for trading. The author is so confident about his product the he gave me a full version of the indicator so that I could try it for a week before I decided to buy it. Ivan spent a lot of time chatting with me, educating me how to use the indicator. He is very quick and replies to your questions. I have already seen good results with this indicator and it has increased my confidence. Thank you for the good words, Irfan!
Sajid Iqubal
178
Sajid Iqubal 2024.06.08 21:59 
 

Enigmera is an exceptional trading indicator that has greatly improved my trading performance. Ivan Stefano offers the best support and guidance, always going above and beyond like an elder brother to me. His guidance and the effectiveness of Enigmera make a winning combination. I highly recommend using Enigmera.

eman11
1104
eman11 2023.11.22 20:29 
 

El usuario no ha dejado ningún comentario para su valoración

Ivan Stefanov
2900
Respuesta del desarrollador Ivan Stefanov 2025.01.02 16:47
eman11 2023.11.22 20:29 # EN
I was an institutional trader for a decade and rarely write reviews or spend more then 50 or a 100 on any indicator as my trading is well established, but always open to something interesting and new. The author is an intelligent and real trader , per many chats with him, and this indicator compliments well existing trading as is from a unique perpective. The price is not cheap , but it it is a legit and unique system, is as decribed, which can be put to good use particulalry with experienced traders who may best integrate multiple styles and ideas successfully. Great work Ivan. Thank you for the good words, Eman11 / Brgds / Ivan
ebel
1221
ebel 2023.11.22 14:41 
 

This indicator is undoubtedly expensive but I believe it to be the Ferrari of indicators and the only one you will ever need. The video in the overview is self explanatory, take the time to find the setups as described and the R:R can be extremely good. I have only been using the indicator for a week but have found several very profitable trades and feel confident that I can make back more than sufficient each month to cover my 6 monthly rental. The author is extremely responsive and helpful and is starting a telegram group so that we can share prospective setups. I believe the indicator is difficult to get to work in Strategy Tester but the author is open to free trials which demonstrates his trust in the product. I can't post images here but I will post a trade I made this morning in the comments. I can't promise it is the perfect setup as I am still learning but just this one trade covered my monthly rental cost. IMPORTANT - do not try to change to a lower timeframe while the indicator is loaded. The code is incredibly complex and trying to recalculate everything on a lower tf over a significant period will freeze your MT4 installation. You will need to delete the indicator from your MT4, force a shut down, restart and re-install. Once you understand the complexity it is not a problem, just open another chart on a lower tf or delete the indicator, change the tf and put it back on.

UPDATE 23/11

I have just seen that the author has been debarred from selling! I have just paid for 6 months rental and this is a good indicator that is making me money. What to I do after 6 months if I can't renew? And why has this happened, the author is very courteous and helpful.

Respuesta al comentario
Versión 3.0 2025.02.19
The indicator has been completely rewritten.

All functions are displayed as buttons on the chart, ensuring quick responsiveness during trading. The right tool at the right moment.
Second and third deviations have been added.
Volume analysis has been added.
A signal when the target line is reached.
Automatic color change of the indicator, resulting in new themes being applied automatically.
Versión 2.60 2025.01.12
Version 2.60

In the new version, the indicator automatically assigns the next identifier number. This allows you to add as many indicators as you want to your charts without mixing the buffers of individual indicators, ensuring the indicator's position remains unaffected. Previously, this was done manually.
Versión 2.50 2025.01.04
Good new functionality added.

1. First bullish and and first bearish deviation lines

The first deviation line in Enigmerа refers to measuring the deviation of the price from its average value, that is, how much the price has deviated from the support line.
High deviation indicates high volatility, while low deviation indicates stability.

Traders use this information to determine entry and exit points. For example, in high volatility, breakout strategies can be applied, while in low volatility – range trading strategies.
Sensitivity to Anomalies: Single sharp movements can distort the calculation of deviation.

2. Support channel of two additional optional support lines (a bearish and bullish)
Versión 2.40 2024.12.26
Two new lines added to Enigmera in ver. 2.4
These are the first bullish and bearish deviations of the support line.

If the price primarily moves between the Enigmera line and its 45 deg lines, the market is in consolidation or sideways movement, which does not indicate a clear trend.

What is the difference between 45 deg line and Single deviation line?
45 deg lines defines the trend. If below non-sustainable, if over strong, if alongside the 45 deg line - sustainable.

Deviation line defines the acceptable distance whithin we consider lack of trend.
Outside the first devition is a trend sign, and it is simply because the market reached a new land.

The first standard deviation often acts as a boundary for normal price fluctuations around this average value.
Versión 2.30 2024.10.07
- Bugs removed.
- 50% target line added. Be default is off.
- Non-Enigmera functionality removed.

Generally better performance.
Versión 2.24 2024.08.06
More friendly labels.
Versión 2.23 2024.06.18
The update is quite important. The convenience is undeniable:

- Just add the indicator to the chart. It is no longer necessary to enter the date and time.
- Putting a top or bottom is done by pulling and dragging the indicator.
- Reestimation of the trend is much more faster.

Enjoy!
Versión 2.1 2024.06.09
- Warning when target is reached
- Line labels added. On/Off option
- Warning if indicator is not placed correctly
- Indicator identifier (when using more than one indicator on a graphic)
Versión 2.0 2024.06.02
1. Canal de Elliott añadido. Ahora puede utilizar cualquier marco de tiempo que desee para el canal de Elliott. Por defecto es de 4 horas. Esto puede facilitar su conteo.
2. Añadido Auto Fibonacci zonas horarias. Esto también puede facilitar su conteo.
3. Auto 50% línea añadida. Significativo para cualquier nivel de movimiento.
4. Hay una opción para limitar el número de velas que el indicador calcula. El valor por defecto es 377. Este número es suficiente para medir la mayoría de los movimientos. Puede cambiarlo según sus ideas.
5. Se ha eliminado la falta de respuesta debida a los cálculos fractales masivos al pasar de un marco temporal alto a uno bajo. Ya no es un problema.
6. Mayor rendimiento gracias a la optimización del código.
7. Añadidas opciones para colores y líneas.
8. Se ha añadido un identificador. Si desea utilizar el indicador varias veces en un gráfico, es una buena idea utilizar un nuevo identificador para cada instancia. De esta forma el indicador utilizará buffers diferentes para cada instancia.
9. Algunos cambios en la interfaz. Las líneas objetivo se han puesto en negrita para hacerlas más importantes y llamar la atención.

Traducción realizada con la versión gratuita del traductor DeepL.com
Versión 1.3 2024.01.05
En la nueva versión
instrumentos de evaluación de tendencias añadidos:

- Línea de ángulo de 45 grados
- Líneas de desviación de 45 grados