Double MACD Plus MT5
- Indicadores
- Dequan Li
- Versión: 1.0
- Activaciones: 5
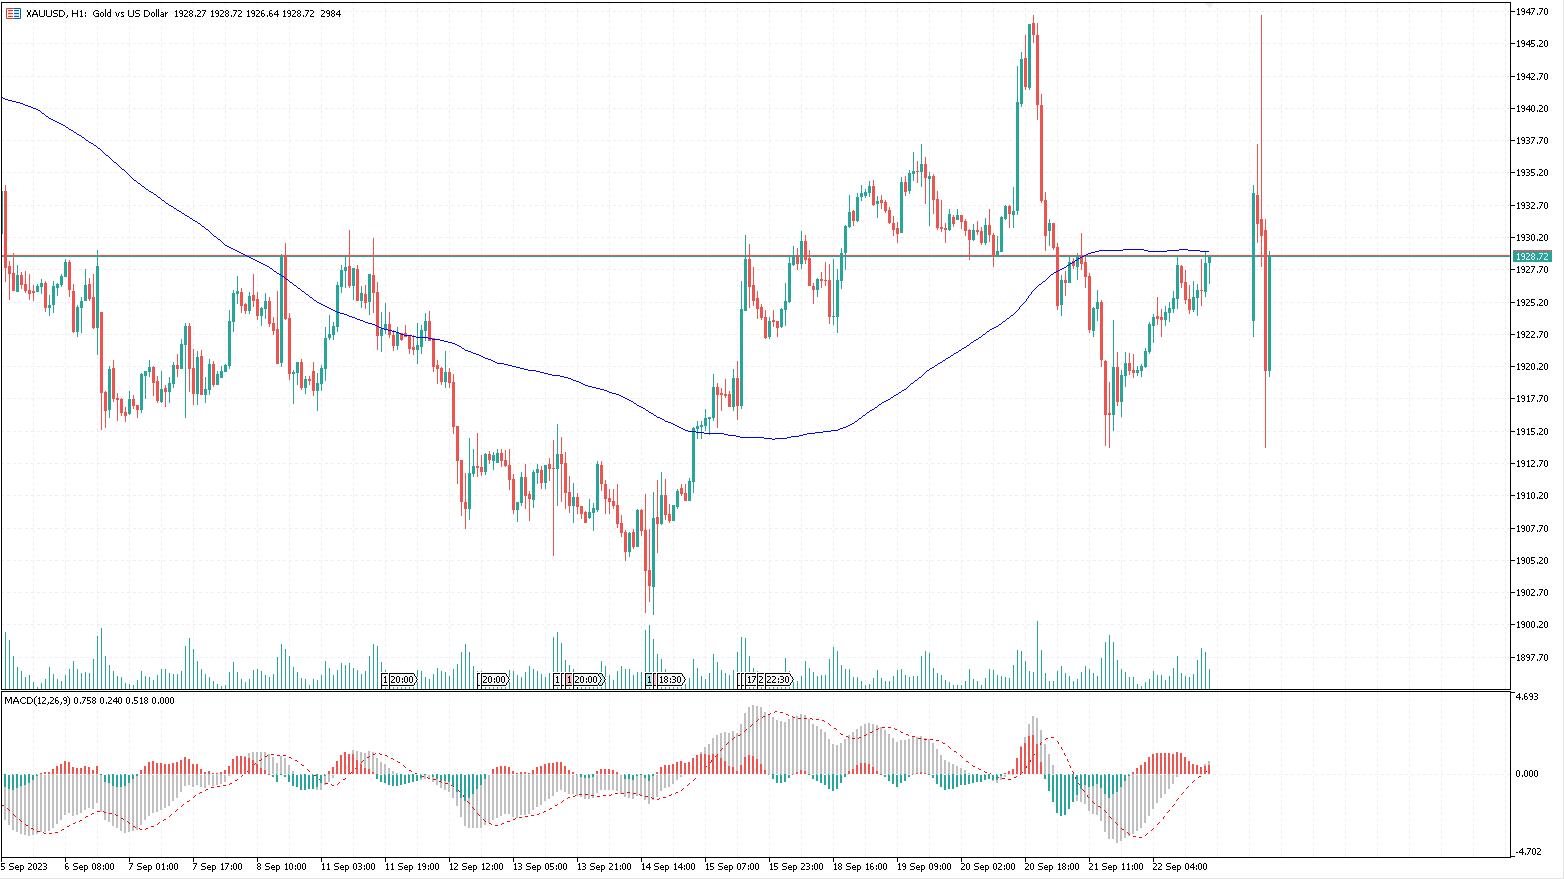
//--- input parameters
input int InpFastEMA = 12; // Fast EMA period
input int InpSlowEMA = 26; // Slow EMA period
input int InpSignalSMA = 9; // Signal SMA period
input ENUM_APPLIED_PRICE InpAppliedPrice = PRICE_CLOSE; // Applied price
Una versión combinada de dos indicadores que reúne las plataformas tradicionales MACD y mql puede analizar eficientemente las tendencias del mercado, más eficaz, concisa e intuitiva.
Gracias por su compra y uso. si tiene mejores sugerencias, deje un mensaje en el área de comentarios. responderé lo antes posible. felicitaciones por ganar suficiente dinero en el mercado.