Nuevos robots comerciales e indicadores para MetaTrader 5 - 39

Special Offer ... It is totally free for all. New one coming soon...................
About This Indicator: RSI vs SMA Indicator: A Comprehensive Technical Analysis Tool for Better for Identify the Short and Long Signals.
The RSI vs SMA Indicator is a powerful technical analysis tool designed to understanding Market Price Fluctuation for Long or Short signals. This user-friendly Indicator good for both novice and experienced traders, providing valuable indication in price chart and separate wi
FREE

The Schaff Trend Cycle indicator is the product of combining Slow Stochastics and the moving average convergence/divergence (MACD). The MACD has a reputation as a trend indicator, but it's also notorious for lagging due to its slow responsive signal line. The improved signal line gives the STC its relevance as an early warning sign to detect currency trends. this indicator is converted from Trading View code of STC Indicator - A Better MACD [SHK]

The Choppery notifier is an indicator that has been developed and tested for the purpose of alerting you that a candle is about to form, it takes away the trouble of having to play a guessing game as to when next a candle will form after a trend, therefore most of the time it eliminates the thought of having to predict which direction price will begin to move at. This indicator can be used in any timeframe, a notification will be sent out to you via email when price moves. you can start at a min
FREE

JCRC风险控制EA 1.显示账户信息 姓名、账号、净入金 余额、净值、持仓 日收益(收益率) 周、月、总收益(收益率) 2.风险控制模块,选择性 按净值风控、按百分比风控,默认全都关闭,自行调整。 ①选择性启动:日熔断,昨日结算余额计算当日比例,浮亏达到,则立即强制平仓,今日不得交易,第二交易日恢复交易。 ②启动风控直接开启本金强平机制:本金回撤直接强制平仓,作为风控第三方后台,通知该交易员,账号已经冻结,不得交易。 ③按净值强平,到达则强平。 可以定制风控,日熔断比例,本金回撤比例,可以作为第三方风控,监管旗下交易员。禁止权力绕过制度,给个人或团队公司造成重大的损失。 备注:如需帮助联系邮箱:16692618587@163.com
FREE
啟用TrailingTrader腳本後 報價視窗的交易品種 將會進行移動止損
設定參數 TrailingDistance 啟動移動的點數 TrailingCallBack 移動止損的回調點數
工作原理 持倉單在獲利的條件下 市價超過設定的點數時 腳本自動設定止損線在市價回調的點數位置 當市價繼續往獲利的方向運行時 止損線會持續往運行方向調整 直到市價回調到止損線時獲利平倉 當同一品種持有多張持倉單時 移動止損會分開運行 當盈利超過一定的範圍時 移動止損線會形成同步狀況
特點 當交易員習慣手動開單 又無法長時間盯盤時 可以啟用移動止損 當持倉單一旦觸發工作 就可以確認該單會在獲利的條件下出場
起用條件 需要使用MT5交易的電腦全天候開機運行 可以啟用腳本後 再同步到官方VPS 此時同步的腳本可以全天候監視交易帳戶
FREE
Best Solution for any Newbie or Expert Trader! This indicator is a unique, high quality and affordable trading tool because we have incorporated a number of proprietary features and a new formula. With this update, you will be able to show double timeframe zones. You will not only be able to show a higher TF but to show both, the chart TF, PLUS the higher TF: SHOWING NESTED ZONES. All Supply Demand traders will love it. :)

Unlock the power of precise trend analysis and supercharge your trading strategy with Momentum Trend on MT5! Our cutting-edge trading tool is designed to provide traders with the essential insights and data needed to navigate the dynamic world of financial markets. Key Features: Accurate Trend Analysis : Momentum Trend utilizes advanced algorithms to accurately identify market trends, helping you stay ahead of the curve and make informed trading decisions. Real-Time Data : Stay updated with real

Introducing US30 Innovator , the exceptional MQL5 expert advisor for the legendary US30 pair! Developed by an experienced certified elite trader with development experience of over 11 years.
US30 Innovator EA stands out from other expert advisors due to its remarkable approach to handling losing trades. First in first out, so there is no stress over holding many trades at the same period. This unique strategy allows the EA to optimize its risk management, minimize losses, it demonstrates

ATR Stops is an indicator which shows Dynamic support and resistance lines by considering ATR value and also a multiplier. its highly effective to find out the trend direction and also is useful for using as stop loss levels. it could be used in different ways one usual way is to buy when line becomes green and sell when it becomes red. when its combined with money management rules and risk reward considerations there is good results.

Pivot Point Super Trend is another type of famous super trend indicator which is equipped with pivot points in different way. this indicator used to be available in the Trading view and this is converted from there to the MT5 language. MT4 version of the indicator is also available and you can find in my products. there are also buy/sell signals shown on the screen.

This Automatic support/resistance indicator calculates various peaks and troughs of the price action, identifies relevant levels and draws support and resistance automatically. It uses the built-in "ZigZag" indicator in Metatrader as a data source hence, very much accurate indicator. The support and resistance lines are contineusely updated as new levels and formed. The indicator has only 5 parameters to set, and mostly it can be used with the default values: The description of the settings is

Important Note: Trend Starter Indicator (TSI) detailed settings manual, trading strategies (coming soon) and setfiles (coming soon) are available in this LINK The Trend Starter Indicator (TSI) provides traders with precise and actionable signals for potential market entry points. By capitalizing on the unique interplay of two internal oscillators combined with astute price action monitoring, TSI optimizes and simplifies the decision-making process in the dynamic world of trading. But that'
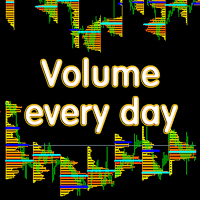
Основные отличия и преимущества индикатора Volume every day от похожего продукта Volume Profile V6 В Volume every day можно параметром Range period задать временной диапазон построения профиля, а параметром Range count задать количество профилей данных диапазонов. Например, на втором скрине Range period=1Day, а Range count=10 - это значит, что профиль будет строиться на периоде один день, десять последних дней. Важно, что переключение тайм фрейма графика не влияет на построение профиля, что т

The VIX Fix is a volatility indicator developed by renowned trader Larry Williams. It's designed to measure volatility in assets that don't have options or futures, such as individual stocks and forex markets. Essentially, it acts as a synthetic VIX (Volatility Index) for any asset , providing a gauge of market uncertainty. This modified version of William's indicator helps you to find market bottoms and market tops. It comes with 2 styles: Stochastic and histogram style. Please see screenshots

Volume Profile is a very useful indicator . it allows you to spot the price levels where important price action took place. It is similar to support and resistance levels but with a different logic. ( Check Out Fixed Range Volume Profile MT5 )
One of the first thing that traders mark up when analyzing a chart is support and resistance. Volume Profile can be used for doing that too.
The indicator scans the defined number of previous bars and calculates the volume of activity at each price
啟用TrailingTrader腳本後 報價視窗的交易品種 將會進行移動止損
設定參數 Symbol 設定需要移動止損的持倉品種 中間需要以","分隔 Magic 輸入需要移動止損的持倉單是別號 不需要識別時輸入-1 Comm 輸入 需要移動止損的持倉單是備註 不需要識別時不做任何輸入 TrailingDistance 啟動移動的點數 TrailingCallBack 移動止損的回調點數
工作原理 持倉單在獲利的條件下 市價超過設定的點數時 腳本自動設定止損線在市價回調的點數位置 當市價繼續往獲利的方向運行時 止損線會持續往運行方向調整 直到市價回調到止損線時獲利平倉 當同一品種持有多張持倉單時 移動止損會分開運行 當盈利超過一定的範圍時 移動止損線會形成同步狀況
特點 當交易員習慣手動開單 又無法長時間盯盤時 可以啟用移動止損 當持倉單一旦觸發工作 就可以確認該單會在獲利的條件下出場 可以跟EA交穿插使用 根據EA設定的Magic或Command做介入式管理
起用條件 需要使用MT5交易的電腦全天候開機運行 可以啟用腳本後 再同步到官方VPS 此時同步的腳本可以全天

SCALP [H] is a panel-shaped robot designed to help the trader [scalper] trade on the Step Index, Step Index 200, Step Index 500, Multi Step 2 Index and Multi Step 4 Index assets [from Deriv.com broker]. From the dashboard, the trader can open new market orders and lock in the stop loss and take profit instantly. On the panel we have: the buttons to open new market orders; the buttons to select the points previously set in the inputs for stop loss and take profit and finally, the button for close

Presentamos el OrderManager : Una herramienta revolucionaria para MT5 Gestiona tus operaciones como un profesional con la nueva utilidad Order Manager para MetaTrader 5. Diseñado con la simplicidad y la facilidad de uso en mente, Order Manager te permite definir y visualizar fácilmente el riesgo asociado con cada operación, permitiéndote tomar decisiones informadas y optimizar tu estrategia de trading. Para más información sobre OrderManager, por favor consulta el manual. [ Manual ] [ Versión

Presentamos el Volatility Doctor Desert Eagle: Su Algoritmo de Scalping Definitivo para el Éxito Explosivo en el Comercio.
¿Está listo para revolucionar su juego de trading? No busque más allá del Volatility Doctor Desert Eagle, el algoritmo de scalping definitivo diseñado para empoderar a traders como usted con precisión, control y rentabilidad. Aquí está por qué el Volatility Doctor Desert Eagle se destaca entre el resto:
1) Simple e Intuitivo: Sin jerga compleja ni una curva de aprendiza
FREE

Descripción :
El indicador "Estructura de mercado HH HL LH LL" es una herramienta potente y al mismo tiempo sencilla para analizar la dinámica de precios en los mercados financieros. Este indicador ayuda a los comerciantes e inversores a identificar cambios en las tendencias e identificar puntos importantes en las series temporales de precios.
Componentes clave del indicador:
HH (máximo más alto): el máximo en el que el precio cierra por encima del máximo anterior. HH indica una tendenc

Este indicador está basado en el famoso indicador fractal pero con mucha personalización y flexibilidad.
Esta es una herramienta poderosa para identificar cambios de tendencias y maximizar su potencial de ganancias.
Con sus funciones avanzadas y su interfaz fácil de usar, es la mejor opción para operadores de todos los niveles. Versión MT4: Ultimate Fractals MT4 Características :
Recuento de velas fractales personalizable. Líneas de inversión. Configuraciones personalizables. Interfaz a
FREE

El indicador "Envelope of Adaptive Moving Average" es una herramienta para ayudarte a tomar decisiones informadas en el mercado financiero. Está diseñado para proporcionarte una visión clara de la dirección de la tendencia y los posibles puntos de entrada y salida en tus operaciones. Este indicador se basa en una media móvil adaptativa, lo que significa que se ajusta automáticamente a los cambios en la volatilidad del mercado. Esto lo hace especialmente útil en mercados que pueden ser tanto tran
FREE

Presentamos el Volatility Doctor Edición Básica: ¡Su Supremo Maestro del Mercado!
¿Está listo para embarcarse en un viaje para desbloquear el verdadero potencial del trading de precisión? Permítanos presentarle al Volatility Doctor, su aliado de confianza en el mundo siempre cambiante de los mercados de divisas. Este extraordinario asesor experto multicurrency no es solo una herramienta de trading; es un virtuoso director de orquesta que orquesta sus inversiones con una precisión y elegancia
FREE

El Indicador de Medias Móviles Exponenciales (Doble o Triple) Envolventes es una herramienta de análisis técnico diseñada para ayudarte a identificar tendencias y posibles puntos de reversión en el mercado financiero. Este indicador ofrece a los traders la flexibilidad de elegir entre dos tipos de medias móviles exponenciales: la Media Móvil Doble Exponencial (DEMA) o la Media Móvil Triple Exponencial (TEMA).
Características Principales : Doble o Triple Exponencial : Cambia entre DEMA y TEMA s
FREE
TradeFlow Dashboard MT5 representa un cambio de paradigma en la gestión comercial, ofreciendo una solución sólida y versátil diseñada para elevar sus estrategias de gestión de riesgos y agilizar la toma de decisiones dentro de la plataforma Meta Trader 5. Con su interfaz elegante y fácil de usar, esta herramienta trasciende la experiencia comercial convencional, especialmente dirigida a operadores manuales que buscan amplificar su rendimiento.
Profundicemos en los aspectos más destacados de T
FREE

The Stochastic Oscillator is one of the main indicators used in the analysis of financial assets. It is one of the highlights in the study of price movements and can be an important indicator of changing trends in the capital market. Stochastic is an oscillator used to identify when an asset is overbought or oversold. It consists of two lines: %K, which is calculated from the highs and lows of a period, and %D, which is a moving average of %K. Our version contains color filling, which facilitate
FREE

Presentando el Asesor Experto Definitivo de Forex: una bestia diseñada para conquistar el Trading Automatizado con facilidad. Esto no es solo otro Asesor Experto; es una verdadera potencia diseñada para revolucionar tu experiencia de trading. Después de 14 años de pruebas incesantes, perfeccionamiento y dedicación inquebrantable, estoy orgulloso de presentar un Asesor Experto que ha ganado su nombre y precio merecidamente. Aquí está por qué se destaca del resto: Flexibilidad sin igual:
Este Ase

IMPORTANT: I've decided to reduce the price to the cheapest possible, as I'm currently working hard on my next EA and therefore don't have time to keep my old EAs as up-to-date as I would normally like to. I'm still available for support though!
NEW 2024 set file can be downloaded by clicking here . (All set files can be found in the comment section) The Dow Jones index, also known as the US30, is a very well diversified index with a unique way of weighting it’s components. These factors ofte

This is a simple Candle Stick Pattern Indicator, which shows in the current time period all standardisized Patterns in the chart. All Patterns will be calculatet automatically based on standard conditions. Following Candle Stick Patterns are included: Bullish Hammer | Bearish Hammer Bullish Inverted Hammer | Bearish Inverted Hammer Bullish Engulfing | Bearish Engulfing Piercing | Dark Cloud Cover Bullish 3 Inside | Bearish 3 Inside There are only a few settings at the begining to take. Every Pat
FREE

Forex Scalper EA trades three currency pairs simultaneously! The strategy is very simple: limit orders are placed in both directions until one is triggered. Pyramid scheme (multiple limit orders) increase profits when price moves in one direction or another.
This EA provides functions: Start Trading, End Trading, Сlose Order(Time), Pending Order Placement (Time), Tralling stop (automatically according to strategy), trading can be switched off, daily range (strategy), stop loss per day (risk m
FREE
Robô para Operações com Opções da B3 - Versão Mapa Demo
Ele permite executar operações com opções de ativos da B3, desde a montagem de uma posição simples com opções e o ativo, até 4 pernas, e operações estruturadas, rolagens, rodar strike, e fechar posição, tudo de forma simples e intuitiva.
Mostra o mapa das opções por vencimento, com seus principais valores, as gregas, preço teórico, últimos volumes, e diversos indicadores relacionados as opções, além de indicar as opções que se está pos
FREE
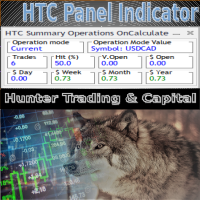
HTC Panel Indicator is an operational summary dashboard for use in conjunction with trading EA.
It provides a concise summary of the current year's trades, open positions and profit history.
The summary can be filtered by the current chart asset, by the ID (magic number) of an EA or by all trades performed in the year.
The panel must be inserted into the chart as an indicator, making it possible to add it to a chart that already has a trading EA.
FREE

This indicator created based on original John Carter's TTM_Squeeze indicator and represents "squeeze" of the market which can be followed (or maybe not) by significant moves. Original indicator prints black dots when Bollinger Bands are inside Kelthner Channels and exactly this implemented in this custom version. Instead of original implementation as momentum indicator MACD indicator with standard settings 12-26-9 is being used. Mainly, the indicator is useful for understanding when it's better
FREE
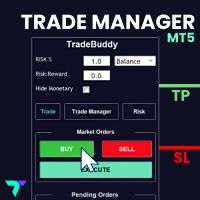
This adds an easy to use trading panel to your MetaTrader5 chart, enabling you to enter the market at lightning speed with your risk automatically calculated. Plus, it will help you automate your trade management with automatic & one click partial profits, stop loss to breakeven and more. Click here for the full Trade Buddy user guide If you want to test Trade Buddy before you purchase, please message us by visiting our profile and we will provide you with a 7 day free trial. Best of all, it’s c

Introducing Auto Trendline Pro : Your Ultimate Trading Companion Are you tired of manually drawing trendlines on your forex charts? Do you wish for a tool that can simplify your trading while providing timely alerts? Look no further, because Auto Trendline Pro is here to revolutionize your trading experience. In the fast-paced world of forex trading, staying ahead of the curve is essential. Identifying trends, both upward and downward, can be a game-changer. This is where Auto Trendline Pro ste

"Triple Performance" Trading Strategy Harness the market's full potential with this dynamic strategy! Key Indicators: MACD (Moving Average Convergence Divergence): Identifies trend reversals. RSI (Relative Strength Index): Signals market conditions. CCI (Commodity Channel Index): Measures market strength. Main Benefits: Maximize profits by utilizing clear signals. Automatic position control with MACD. Easy customization with configurable RSI and CCI levels.
Works perfectly with EUR/
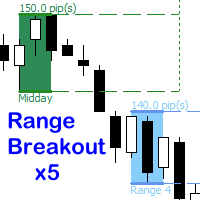
Trade multiple time range breakouts.
This EA offers up to 5 different time range zones all individually customizable. Bracket one candle or a whole range of candles. Enable all five ranges or just one. Each range have individual stop loss, break even or take profit options. Select the number of historical breakout zones to display on the chart. Each breakout zone indicates the number of pips in the range. Customise each range label in the EA, this will be displayed in the comments section of t

Hello Traders..
Tried deals without stop-lose? :)
=-=-=-=-=--- Grid EA Robot { Simple Moving Average } crossover 4sma & 11sma Strategy ---=-=-=-=-=
BY below pics you will know what strategy doing by automatic open and close Trades.
[ BUY ]
4.sma crossover 11.sma
https://ibb.co/0XZFBf2
[ SELL ]
11.sma crossunder 4.sma
https://ibb.co/VpqsLmD
[ backtest ] - XAUUSD - settings below. Note: don't change these settings for ( xauusd pair ) -TF 1 hour
https:/
Unleash the power of precision and innovation in your trading with the KT BreakGrid Pro EA. Seamlessly blending the strategic prowess of breakout and grid trading, this expert advisor is your ultimate solution to navigating the complex Forex landscape with unmatched confidence and efficiency.
Recommendations
Symbol: EURUSD TimeFrame: M5 Account Type: Hedge Leverage: 1:500 Set Files: Not required. Default inputs provides best results.
Features Breakout-Infused Grid Strategy: Experience th

The indicator determines signals on a system of two components:
- correct fractals. The indicator that comes with MT4 and MT5 is quite crude, since some levels are calculated incorrectly. This indicator shows signals for the breakdown of strong levels. - wave level for fractals. Not to be confused with zigzag.
It is better to use on higher timeframes (M15 and higher), where the indicator perfectly shows entry points and reversal situations.
Of course, you can use standard indicators from

Note: minimum investment 1000 usd or (100 usd is Account Cent (10000 Cent)) Run At 0.01 lot start. Trading with an Expert Advisor (EA) on the M1 timeframe (1-minute chart) can be quite challenging due to the rapid price movements and increased noise in such short timeframes. However, it's not impossible, and some traders do use EAs on the M1 chart for specific strategies. Here are some considerations for trading with an EA on the M1 timeframe: 1. Strategy Selection: Choose a trading strategy
To access the MT4 version of this EA you can contact via private message. Also you can contact for further modifications. strategy description: - Detect underlying trend using the BxTrender indicator in daily time frame. - Trigger entry using supertrend indicator in M15 time frame. - Also use supertrend indicator to set SL and TP accordingly. EA setup - Nasdaq and other indices(like DAX40) are suggested to be traded. - Risk per trade is hard coded to 0.5%. - Risk:Reward ratio is hard coded to 1:
FREE

The Stochastic Momentum Index (SMI), developed by William Blau and featured in the January 1993 edition of Technical Analysis of Stocks & Commodities magazine, introduces a unique perspective to trading analysis. Distinguished from the conventional Stochastic Oscillator, which evaluates the current close in relation to the recent x-period high/low range, the SMI assesses the close's position relative to the midpoint of this range. This innovation yields an oscillator with a range of +/- 100, re
FREE
KT Momentum Histogram provides traders with a visualization of the momentum of a particular asset, which helps determine the strength and potential direction of a market trend. The indicator calculates and operates based on momentum in trading.
What Exactly is a Momentum Histogram
Momentum is the rate of acceleration of an asset's price or volume. In other words, it measures the speed at which the price of an asset is moving in a particular direction over a specific period of time. Positive
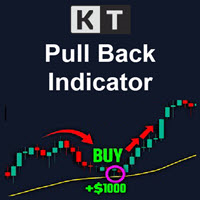
The KT Pull Back Arrows shows the pull back arrows using the RSI (Relative Strength Index) to identify suitable pull-back entry areas within the overbought and oversold zones. The indicator effectively pinpoints favorable moments for initiating pull-back trades by leveraging these RSI thresholds. Trend trading is often considered the most profitable strategy in the Forex market. It is the equivalent of riding the wave, going with the flow, and capitalizing on market momentum. However, timing is
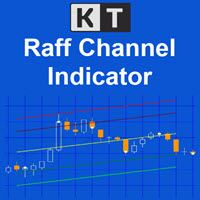
The KT Raff Channel is an enhanced and refined iteration of the original Raff channel concept pioneered by Gilbert Raff in 1996. This indicator builds upon Raff's initial work, incorporating modifications and advancements to provide traders with a more sophisticated and powerful tool. Gilbert Raff, a renowned name in the field of financial market analysis, is the developer of the Raff Regression Channel. This technical tool is designed for discerning and validating possible market price trends.

This is the Full Version, to get the free version please contact me.
The free version works on “AUDNZD” and “XAUUSD” charts.
All symbols and time frames scanner
Head and Shoulder
One of the most popular Price Action patterns is the Head and Shoulders pattern. The pattern has three local tops that resemble the left shoulder, head, and right shoulder. The head and shoulders chart pattern appears in all kinds of markets, including Forex, cryptocurrency, commodities, stocks, and bonds. The
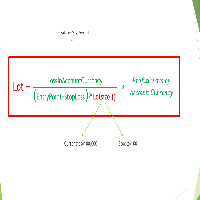
Important Note: Before using it in a real account test it in your demo account.
//+------------------------------------------------------------------+ //| Optimum_Lot_Size.mq5 | //| Copyright 2023, MetaQuotes Ltd. | //| https://www.mql5.com | //+------------------------------------------------------------------+ #property copyright "Copyright 2023, MetaQuotes Ltd." #propert

This indicator is used to find support and resistance lines
The support and pressure of different time periods can be found in the same icon cycle, and two time periods are provided here
Parameter Description:
---------------------- Main ---------------------
Timeframe //Used to select the main time period (recommended as the default PERIOD_D1);
Retracement interval //This value is the root number of backtracking k-lines (recommended to be 20 by default);

Basic Gold Predictor is a sophisticated Expert Advisor meticulously crafted for traders and investors with a keen interest in the precious metal, gold. This advanced algorithm combines the power of multi-timeframe analysis and fundamental technical analysis to provide accurate and timely predictions for gold price movements.
Key Features: Multi-Timeframe Analysis: Basic Gold Predictor leverages multiple timeframes, from short-term intraday charts to longer-term daily charts. By considering var

The KT Knoxville Divergence is a powerful tool that reveals unique price divergences in a financial instrument by employing a carefully crafted combination of the Relative Strength Index (RSI) and a momentum oscillator. This indicator effectively captures subtle variations in market dynamics and assists traders in identifying potentially profitable trading opportunities with greater precision. Knoxville Divergences is a type of divergence in trading developed by Rob Booker. Divergence in tradin

The KT 4 Time Frame Trend is an invaluable forex indicator for traders seeking to identify the trend direction across 4-time frames accurately. This innovative indicator allows users to simultaneously observe and analyze price trends across four different timeframes. Whether you're a beginner or an experienced trader, this tool offers an enhanced understanding of trend dynamics, leading to improved trading strategies on your trading platform. The capability to concurrently monitor multiple timef

- This is the exact conversion from TradingView: "Support/Resistance" By "BarsStallone". - This indicator lets you read the buffers for R/S values. - This is a non-repaint and light processing load indicator. - This is not a multi time frame indicator If you want the multi time frame version you should create a personal order and I deliver two files that you need them both to have the multi time frame indicator running on your system. - The MT4 version of the indicator is not light load from pr

The Average Cross System indicator is a versatile tool designed for traders using the MetaTrader 4 (MT4) platform. This indicator provides a straightforward yet effective way to identify potential buy and sell signals based on moving average crossovers, a widely used technical analysis strategy. Key Features: Moving Average Crossovers: The heart of the Average Cross System is the detection of moving average crossovers. It automatically identifies when a shorter-term moving average crosses above
FREE
Daily Trading Statistics is expert advisor that count: -Today entries: sum of all in entries of the day; -Today winning deals profit: sum of the profits of all winning entries of the day; -Today lossing deals profit: sum of the profits of all losing entries of the day; -Today deals profit: balance of profits between the winning entries and the losing entries of the day.
FREE

Infinity Indicator MT5 1.0 Panel Asset Rate % EURUSD 96.0% GBPUSD 94.1% AUDCAD 90.5% USDCHF 87.8% BTCUSD 78.4% Panel Win Rate based on CandleMT4 Exit Button Calculates the StdDev standard deviation indicator on the RSI data, stored in the matrix similar to the keltner. input int HourCalculate = 12; RsiLength = 5; RsiPrice = PRICE_CLOSE; HalfLength = 4; DevPeriod = 100; Deviations = 0.9; UseAlert = true; DrawArrows = true; TimerWork=300; LevelUp = 80; LevelDown = 20; MoreS
This EA will automatically close all open order when profit or loss is reached according to users setting. You need to select close by percentage or close by amount. If close by percentage or close by amount is set to true the EA will exit. When the setting is set to true, the value of profit and loss can not be 0. Please set to true the option for Close Order with Same Symbol or Close All Order.
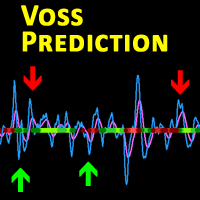
Description This is a modified version of the popular Voss Predictive Filter - A peek into the future by Dr. John Ehlers. It contains 2 lines - V-Line (blue) and F-Line (red), a trend indication and BUY/SELL signals.
Usage Buy Green dots indicate an up trend. Open a BUY position if the V-Line crosses the F-Line from below and an up trend is signaled (green dots) Close BUY position if V-Lines falls beneath F-Line again Sell Red dots indicate a down trend Open a sell position if V-Line falls

The KT Buy Sell Volume is a powerful tool traders use to gauge the strength and weakness of price movements. In the whirlwind of the Forex market, traders aim to identify and ride the waves of a bullish or bearish trend that exudes strength and potential. However, recognizing these trends necessitates a method, metric, or indicator to quantify their strength. One crucial factor that traders examine for this purpose is volume. Volume refers to the number of shares or contracts traded in a securit
The KT Risk Management Indicator provides a comprehensive overview of the profit/loss and risk management characteristics of your Metatrader account, offering valuable insights and information. It efficiently categorizes the displayed information at account and symbol levels, ensuring a clear and organized presentation of crucial data. Risk is inherent when trading the Forex market - a reality that seasoned traders acknowledge and beginners quickly realize. To succeed in this volatile market, t

The KT Trades Info indicator is useful for traders wishing to stay informed about their trading performance. This indicator provides real-time updates on the profitability of all ongoing and completed trades, enabling traders to make well-informed decisions. By incorporating key financial metrics, it provides a comprehensive picture of a trader's financial status at a glance. This means traders can monitor their performance with increased accuracy and precision, facilitating better risk manageme

About This Indicator: RSI vs SMA Oscillator: A Comprehensive Technical Analysis Tool for Better View of Market Price
The RSI vs SMA Oscillator is a powerful technical analysis tool designed to understanding Market Price Fluctuation for buy or sell signals. This user-friendly Oscillator good for both novice and experienced traders, providing valuable insights into market trends and price movements. Key Features: - RSI Cross Alert: The indicator is based on the Relative Strength Index (RSI), a po
FREE

Este producto filtra todos los asesores expertos y los gráficos manuales durante el tiempo de noticias, por lo que no tendrás que preocuparte por los repentinos picos de precios que podrían destruir tus configuraciones de negociación manuales o las operaciones realizadas por otros asesores expertos. Este producto también viene con un sistema completo de gestión de órdenes que puede manejar tus posiciones abiertas y órdenes pendientes antes del lanzamiento de cualquier noticia. Una vez que compre

El estrategia de trading Moving Average Convergence Divergence (MACD) es una herramienta popular de análisis técnico que se utiliza para identificar cambios en el impulso y la dirección de la tendencia. El MACD se calcula restando la media móvil exponencial (EMA) de 26 períodos de la EMA de 12 períodos. Luego se traza una EMA de 9 períodos, llamada "línea de señal", sobre el MACD para actuar como un disparador de señales de compra y venta. El MACD se considera en territorio alcista cuando la lín
FREE

Doctor Volatility - ¡Su asesor experto para dominar los ritmos del mercado!
¿Está listo para desbloquear el poder de la negociación de precisión? Conozca al Doctor Volatility, su compañero de confianza en el dinámico mundo de los mercados de divisas. Este asesor experto de múltiples divisas no es solo una herramienta de negociación; es un director de orquesta de la sinfonía, guiando sus inversiones con una precisión incomparable.
Descubra las características clave:
1. Experiencia en la bú
FREE
Este es el script necesario para utilizar El Filtro de Noticias. Este script selecciona cualquier gráfico que desee filtrar y envía las entradas al programa Filtro de Noticias. Cada entrada es específica para ese gráfico, por lo que tiene la flexibilidad de establecer diferentes entradas para cada gráfico. A continuación encontrará enlaces a The News Filter (demostración gratuita): Guía del filtro de noticias + enlaces de descarga
Selección de noticias
La fuente de noticias se obtiene del cal
FREE

El popular indicador "SuperTrend" es una herramienta de análisis técnico que ayuda a identificar la dirección de una tendencia y posibles puntos de entrada o salida en los mercados financieros. El indicador se basa en el Average True Range (ATR), que mide la volatilidad del mercado en función de los rangos de precios. !Es gratuito en otras plataformas y aquí no tiene por que ser la excepción! Se utiliza comúnmente de tres maneras: Para identificar la Tendencia Actual: Cuando el precio está por e
FREE

Contact me to send you instruction and add you in group.
QM (Quasimodo) Pattern is based on Read The Market(RTM) concepts. The purpose of this model is to face the big players of the market (financial institutions and banks), As you know in financial markets, big traders try to fool small traders, but RTM prevent traders from getting trapped. This style is formed in terms of price candles and presented according to market supply and demand areas and no price oscillator is used in it. RTM con
Chart Range es un asesor experto que trabaja en soporte y resistencia en función de los precios de cierre.
El Asesor Experto fue sometido a pruebas retrospectivas de 2012 a 2022 en cada tick real, con un depósito por cada cruce de 10.000 $ (100 $ en cuenta de centavos).
Para conocer el conjunto de monedas, consulte los comentarios.
SEÑAL EN VIVO: https://www.mql5.com/es/signals/2058817
Recomendaciones:
Par de divisas: GBPUSD,AUDNZD,AUDCAD,EURGBP,AUDUSD,NZDCAD Plazo: H4

"Hypercon Pro MT5" es un asesor experto multidivisa basado en estrategias comerciales clásicas. Los puntos de entrada al mercado se determinan automáticamente, teniendo en cuenta las características de volatilidad y la dinámica actual del par de divisas negociado. Para reducir los riesgos, se recomienda utilizar cuentas de centavos. Señales. Datos de entrada: 1. ABRIR UN PUESTO "Period_": El período de tiempo del gráfico determina la intensidad de las posiciones de apertura. Cuanto más corto se
¿Sabe usted por qué MetaTrader Market es el mejor lugar para vender estrategias comerciales e indicadores técnicos? Con nosotros, el desarrollador no tiene que perder tiempo y fuerzas en publicidad, protección del programa y ajustes de cuentas con los compradores. Todo eso ya está hecho.
Está perdiendo oportunidades comerciales:
- Aplicaciones de trading gratuitas
- 8 000+ señales para copiar
- Noticias económicas para analizar los mercados financieros
Registro
Entrada
Si no tiene cuenta de usuario, regístrese
Para iniciar sesión y usar el sitio web MQL5.com es necesario permitir el uso de Сookies.
Por favor, active este ajuste en su navegador, de lo contrario, no podrá iniciar sesión.