Nuevos robots comerciales e indicadores para MetaTrader 5 - 108

Индикатор Envelopes gaussian - это стандартный Envelopes с обработкой фильтром Гаусса. Преимущество данного индикатора в меньшем запаздывание от стандартного индикатора.
Входные параметры: Period - период индикатора по умолчанию 14 Deviation - ширина канала по умолчанию 0.1 Shift - смещение индикаторных линий от цены в барах. По умолчанию 0 Индикатор пригоден для использования в советниках
Буфер 0 — верхняя линия индикатора;
Буфер 1 — нижняя линия индикатора;
FREE
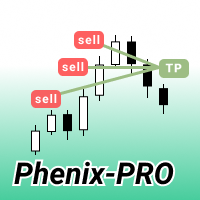
Phenix - PRO MT 5 – это полностью автоматизированный торговый робот. Данный робот торгует на хорошо известной валютной паре EUR JPY . По умолчанию параметры подобраны для валютной пары EUR JPY с Т аймФреймом 1М. Стратегия основана на системе мартингейла. В качестве точки входа в рынок советник использует математическую модель, основанную на значениях индикатора скользящей средней. Дополнительно можно настроить робота, чтобы он торговал с учетом баланса, для этого необходимо вкл AutoLot и Auto

Gold Stuff mt5: un indicador de tendencia diseñado específicamente para el oro, también se puede usar en cualquier instrumento financiero. El indicador no se vuelve a dibujar ni se retrasa. El marco de tiempo recomendado es H1.
IMPORTANTE! Póngase en contacto conmigo inmediatamente después de la compra para obtener instrucciones y bonificación! Puede obtener una copia gratuita de nuestro indicador Strong Support y Trend Scanner, por favor envíe un mensaje privado. ¡a mí!
PARÁMETROS
Draw

Breakout based strategy, generates market entry signals when the price crosses a border of a certain price range. To create the strategy, we have used the history data with 99,9% quality for the last 15 years. The best signals had been selected and the false signals have been filtered out. The Expert Advisor performs technical analysis and considers only the breakouts that show the best result.
It uses a system of filtering false signals. The EA uses adaptive trailing stop. The EA uses a v
El experto comercial CatchPositionByStopOrder está diseñado para trabajar en el mercado de tendencia cuando se conoce la dirección del comercio, puede comerciar con órdenes SELLSTOP y BUYSTOP, puede confiar la elección de la dirección al experto. Coloca órdenes de STOP pendientes y las mueve detrás del precio para determinar el punto de entrada más efectivo. Período de tiempo recomendado para el comercio M5 / M15 / H1. El asesor experto puede trabajar con s/l y T/p fijos, y con la ayuda de Thra

https://youtu.be/Ze9zPpYtIrI Gridcatchcandlelimitorderonesymbol-asesor plano de Rejilla, para abrir órdenes desde los límites del canal al centro, trabaja en retrocesos desde el nivel de soporte y el nivel de resistencia, desde el indicador de ancho de canal personalizado TMA, con s/L y T / P. Cuando no hay un movimiento de tendencia determinado y duda de la continuación de la tendencia, los Niveles se desplazan automáticamente por el precio a lo largo de los límites del canal y esp

El indicador 2indtompson es un indicador de comparación de dos herramientas para determinar los volúmenes, para equilibrar las operaciones de negociación de pares o para el comercio de arbitraje, preparado a partir de una versión analógica para el terminal MT4. Por lo tanto, si necesita comparar cuánto pesarán las dos herramientas y no sabe cómo hacerlo, coloque el indicador en el gráfico y calculará automáticamente los volúmenes necesarios para el equilibrio. Además, el indicador muestra el est
FREE

El indicador analítico BodySizeHistogram está diseñado para observar el movimiento real del tipo de cambio en el cuerpo de la vela. El cuerpo de la vela es un medio universal para analizar el gráfico de precios sin el uso de indicadores que utilizan fórmulas matemáticas. En mi opinión, el cuerpo de la vela es prácticamente todo lo que se necesita para comprender el evento que está sucediendo con el precio. Este indicador muestra los histogramas de los cuerpos de las velas en puntos. Cuanto mayor

El indicador DuettoFXTompson está diseñado para trabajar con dos instrumentos que tienen un alto nivel de correlación, el indicador se puede utilizar para el comercio de pares de divisas, acciones, etc. instrumentos financieros. El indicador muestra el momento de la divergencia de los instrumentos y la suma de los dos instrumentos ( línea amarilla), además se calcula el parámetro del valor promedio de MA Marco de tiempo recomendado para el trabajo M5. Contactos para la comunicación 777basil@mail
FREE

Excellent dashboard for analytics. The panel helps to analyze the values of the Alligator indicator and its signals.
With this panel you can: watch the current signal from Alligator on all timeframes; watch the current signal from Alligator for different symbols; watch the current Alligator value; several types of signals for analytics.
Values in a table cell: Jaw Teeths Lips Jaw - Teeth Jaw - Lips Teeth - Lips
Signal type: Lips - Teeth - green line (lips) crosses red line (

This indicator is an extended implementation of Weis waves. It builds Weis waves on absolute volumes (which is the classical approach) or delta of volumes (unique feature) using different methods of wave formation and visualization. It works with real volumes, if available, or with tick volumes otherwise, but also provides an option to use so called "true volume surrogates", as an artificial substitution for missing real volumes (for example, for Forex symbols), which was introduced in correspo

This is a non-parametric ZigZag providing 4 different methods of calculation. Upward edge continues on new bars while their `highs` are above highest `low` among previous bars, downward edge continues on next bars while their `lows` are below lowest `high` among previous; Gann swing: upward edge continues while `highs` and `lows` are higher than on the left adjacent bar, downward edge continues while `highs` and `lows` are lower than on the left adjacent bar. Inside bars (with lower `high` and
FREE

Victory Price Direction I'm glad to present you my new indicator.
This indicator includes all the best strategies that I have researched. When developing and optimizing, I used ML algorithms. The indicator is very easy to use.
Now the indicator has 3 basic strategies and the ability to customize your own strategy. I am constantly looking for better strategies.
You get: A simple and effective indicator of reversals. The indicator will help you place Take Profit correctly. It w

Buy and sell signals based on the Wave Setup strategy for entering a trade on the pullback after a reversal.
How does the indicator work? The indicator activates the buy and sell signal when their respective conditions are met. For an uptrend, we need a reversal up on the EMA9 followed by prices above the ascending SMA21 making a pullback and a touch on it. For a downtrend, we need a reversal down on the EMA9 followed by prices below the descending SMA21 making a pullback and a touch on it.

PROMO: ONLY 10 LEFT AT $90!
Next price: $199 Price will be kept high to limit number of users for this strategy.
This EA starts trading at the open of London (UK) Session . It is based on analysis of advanced statistical distributions combined with short to medium term reversal patterns which have mean-reversion attributes. The EA includes several smart features and allows you to trade with a fixed or automatic lot size. The EA is not sensitive to spreads but can be backtested on bo

Indicator of the colour display of the zones of buyers and sellers in the bar with a change of colour as the volume increases.
From bar maximum to bar closing - this is the sellers' zone.
From bar closing to bar minimum - this is the buyers area.
As the bar volume increases in comparison to the previous bar, the respective zones are coloured in a different colour.
Input parameters volumes (tick or real)

Max ScalperSpeed MT5 is a fully automated expert advisor. This system has been developed to improve the efficiency of generating more returns. Rely on scalping trading strategies and recovery strategies with appropriate trading frequencies, and also able to work well in all market conditions, whether trend or sideways, able to trade full time in all conditions. Enable or disable news filtering according to user needs. Added a proportional lot size adjustment function, where users can choose t

this is a multi-functional orders all closing script
MT4 version
Feature: 1, it can close all orders of the chart symbol or all symbols. (select mode) 2, it can close all orders of buy, sell or both type. 3, it can close all orders of profit, loss, or any. 4, you can specify magic number, order comment as filters for the order closing operation. 5, it can also do partial closing by percentage to all orders.
it's strongly recommended to set a "hotkey" to this script when you use it. wish
FREE

Общие сведения Советник определяет наиболее вероятные места движения графика и открывает ордера на Buy или Sell. Не использует высокорискованные стратегии, такие как Мартингейл. Ордера закрываются по наиболее возможному профиту или небольшой потерей. Что имитирует Take Profit и Stop Loss. Мультивалютный.
Важно перед запуском прочитать! Для запуска советника достаточно запустить его на одном единственном графике например EURUSD. Во вкладке "Обзор рынка" в идеале отобразить все символы для
Indicator summary Индикатор информационная панель отображает значения и торговые действия, а так же выводит сводную информацию о торговых действиях, основанных на 11 встроенных индикаторах. Встроенные индикаторы:
RSI (Relative Strength Index )- пересечение зоны перекупленности сверху вниз - сигнал на продажу. Пересечение зоны перепроданности снизу вверх - сигнал на покупку. При колебаниях в зоне между перекупленостью и перепроданостью сигнал формируется в зависимости от нахождения значения о

El asesor de FOREX HERO utiliza la estrategia de cuadrícula (apertura de ofertas contra el movimiento de la tendencia) y piramidal (apertura de ofertas con la tendencia). El EA funciona solo con órdenes de mercado. La apertura de las primeras operaciones se produce en la ruptura de los extremos en el tiempo asignado, donde se concentra N número de órdenes límite (el precio ha probado este nivel varias veces). Si el precio rompe el nivel pero N número de pintas no pasa en N segundos, entonces la

El indicador VolumeTick https://youtu.be/tmHZKdMCMGo
se fabrica para determinar por adelantado el posible punto de reversión, en condiciones de consolidación y comercio multidireccional de los comerciantes, el número de volúmenes en el mercado aumenta dramáticamente, lo que muestra el interés de los participantes en cambiar la dirección del movimiento del instrumento en el mercado y cuenta el número de ticks en cada barra, se realiza en forma de un oscilador. Por lo tanto, tenemos la oportunid

Excellent dashboard for market analytics. The panel helps to analyze the values of the Stochastic indicator and its signals.
With this panel you can: watch the current signal from Stochastic on all timeframes; watch the current signal from Stochastic for different symbols; watch the current Stochastic value; several types of signals for analytics.
Values in a table cell: Stochastic - Main line Stochastic - SIgnal line Stochastic - Main line minus signal line
Signal type: Sto

This is an advanced multi-timeframe version of the popular Hull Moving Average (HMA) Features Two lines of the Hull indicator of different timeframes on the same chart. The HMA line of the higher timeframe defines the trend, and the HMA line of the current timeframe defines the short-term price movements. A graphical panel with HMA indicator data from all timeframes at the same time . If the HMA switched its direction on any timeframe, the panel displays a question or exclamation mark with a tex

The indicator is based on a proven successful strategy. It shows buys and sello signals with suggested stop and target. In the same way, it calculates the essential trading analysis statistics as successful and profit ratio. KEY LINKS: Indicator Manual – How to Install - Frequent Questions - All Products Indicator features Effective and understandable signals. It can be used as a complete trading strategy. Complete trading statistics to evaluate the indicator performance. It shows exact
Sputnik it is a Secure Automated Software for trade Forex market and indices.
The architecture is a Fully Automatic Autonomous Robot Expert capable of
Independently analyzing the market and making trading decisions
Sputnik It is an advanced trading system. This is a fully automatic Expert Advisor. Sputnik is a plug and play system Sputnik It is a 100% automatic system, The system is self-sufficient, performing all the work. You can download the demo and test it yours

The indicator plots a curve of the difference between the values of two trading instruments (currency pairs).
The purpose of the indicator is to observe the processes of divergence and convergence of the values of two trading instruments. The results obtained can be used for trading strategies of statistical arbitrage, pair trading, correlation, and others.
Trading strategy
The indicator is attached to the chart of any trading instrument. In the input parameters, the names of trading i
FREE

The previous day's vwap is used by some traders as a support and resistance point, after all it is one of the ways to consider the fair price of that asset or that pair the day before. Possible defenses can occur in this region indicating a reversal, or triggering stops starting a new, more directional movement. It is a matter of analyzing how it will add to your operational.
To avoid manually drawing the previous day's vwaps and saving time for your analysis, use the Vwap Freeze indicator,

Hello This Indicator will draw Green (Up) and Red (Down) small arrows from Multi TimeFrames based in ( MACD ) to help you to take decision to buy or sell or waiting If there 4 green arrows in same vertical line that's mean (Up) and If there 4 Red arrows in same vertical line that's mean (Down) and the options contain (Alert , Mobile and Mail Notifications). Please watch our video for more details https://youtu.be/MVzDbFYPw1M and these is EA for it https://www.mql5.com/en/market/product/59092 G

Hello This Indicator will draw Green (Up) and Red (Down) small arrows from Multi TimeFrames based in ( Ichimoku ) to help you to take decision to buy or sell or waiting If there 4 green arrows in same vertical line that's mean (Up) and If there 4 Red arrows in same vertical line that's mean (Down) and the options contain (Alert and Mobile , Mail Notifications). Please watch our video for more details https://youtu.be/MVzDbFYPw1M and these is EA for it https://www.mql5.com/en/market/product/590

SR Breakup Indicator it is an indicator based on support and resistance . It makes price breakout levels visible by opening the trader's mind to spot market opportunities.
Attention!!! This Indicator can be used in any time frame.
Suggestion of use Wait until the support and resistance lines are horizontal and closer. Do Trade (BUY): if price breakout resistance level (outside line). Do Trade (SELL): if price breakout support level (outside line). Use internal lines as Sto

WT Vwap 5 Bands
The WT Vwap Bands indicator is an indicator that combines price and volume, helping to show whether the price is within the "fair price", overbought or oversold.
The indicator code was designed for performance and has already been tested in a real trading account.
In addition to the visual inputs (color, thickness and line style), the user can define a% value that depends on the price.
The default values work with the most distant band at 1% of the price and then di

新機能:Ver3.5 28通貨ペアの強弱も表示するようにしました。 監視ペアで最強、最弱の通貨ペアとなった場合、四つ葉のマークが出るように変更しました。 15分足、1時間足、4時間足単位での通貨ペアの強弱を表示するようにしました。
詳細な情報はこちらにサイトがあります。 https://toushika.top/tc-cs-plus-cfd/
注:こちらはTitanのデモ口座で動作します。 XMで使用したい場合は こちらのでセットファイル を使用してください。
機能: 一目で現在の通貨の方向性と強弱が確認できます。 15M,1H,4Hでの方向性を表示します。 15M,1H,4Hでの方向が揃った場合にドットが表示されます。 通貨の相関が揃った場合にドットが表示されます。 ※相関はピアソン相関係数を使用しています。 より詳しい情報につきましてはこちらを参照してください。 https://www.mql5.com/ja/articles/5481 通貨の強弱を表示します。 現時点でのボラリティーの状況を表示します。 過去20日/過去5日/今日のボラリティーを

To calculate strength of currencies and to show in table There is 1 parameter: . Show recommended pairs: true/false -> To show top 1 of strong and weak currency Tips to trade: . To trade only with strongest vs weakest currency . When H1, M30, M15, M5 of specific currency is up or down -> consider to open BUY/SELL . It can combine: + strongest currency vs weakest currency + strongest currency vs 2nd weakest currency + 2nd strongest currency vs weakest currency
FREE

It is the very same classic Stochastic indicator, but with a little twist: NO NAME and data is shown in the sub window. It could be stupid, BUT, if you are running out of space in Micro windows like Mini Charts, where the indicator's name is totally useless, you came to the right place. And that's it! I know it seems stupid but I needed the classical version of Stochastic indicator without that annoying name on my Mini Chart, so I did it that way... The original formula is right from Metaquote's
FREE
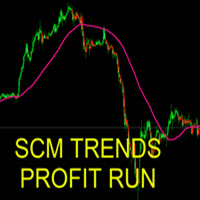
The indicator can be used in several ways. The simplest is to buy when the SCM Trends Profit Run line is painted green and sell when it is red. This indicator that allows you to detect several changes and dynamics in price that many traders can’t estimate or see without an indicator, which highlights its essence and usage.
Accordingly, traders can draw conclusions and make estimates about how the prices will change based on the information they have and then they can modify their strategy fo

The Trend Quality Indicator (by David Sepiashvili) is intended to measure trend activity. Some benchmarks can be used to determine the strength of a trend.
In the range of values from -1 to +1 ( Ignored zone parameter) , the trend is buried beneath noise. It is preferable to stay out of this zone.
The greater the value, the less the risk of trading with a trend, and the more reliable the trading opportunity.
The range from +1 to +2, or from -1 to -2, may be treated as zone of weak tr

Support And Resistance Screener está en un indicador de nivel para MetaTrader que proporciona múltiples herramientas dentro de un indicador. Las herramientas disponibles son: 1. Cribador de estructura de mercado. 2. Zona de retroceso alcista. 3. Zona de retroceso bajista. 4. Puntos pivotes diarios 5. Puntos de pivote semanales 6. Puntos Pivotes mensuales 7. Fuerte soporte y resistencia basado en patrón armónico y volumen. 8. Zonas de nivel de banco. OFERTA POR TIEMPO LIMITADO: El indicador de so

Trend Power Indicator is an indicator which helps to identify trend direction and its power by using moving averages ZigZag pattern and correlations of tradable instruments. It provides trend power data with user-friendly interface which can be read easily and fast. This indicator by default is configured for trading of Adam Khoo's ( Piranhaprofit ) strategies. It saves mass of time for searching of tradable pairs by his strategies. It indicates when all required moving averages are align
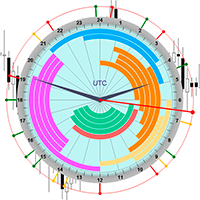
The professional browser of News and Trading Sessions is now available in MetaTrader 5.
Now all the most important market information is collected on one dial!
News located on the Time scale. Planning your working time has never been so easy and convenient ... The news scale can be switched a day, two, a week, a month forward or backward (see the details in the short video). All news updates in real time.
Thanks to the built-in filters, you can configure the display of news by importance,
MT4: https://www.mql5.com/en/market/product/52715
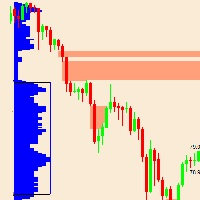
Este indicador se basa en la teoría del perfil de mercado.
¿Qué es exactamente un área de solteros?
Teoría: Perfil de mercado Solteros:
Las impresiones individuales o individuales o el espacio del perfil se colocan en el interior de una estructura de perfil, no en el borde superior o inferior.
Están representados con OPC individuales impresos en el perfil del mercado.
Los solteros llaman nuestra atención sobre lugares donde el precio

El nuevo indicador es un predictor de tendencia para el gráfico actual, así como otros símbolos y marcos de tiempo. Cada botón del tablero es interactivo. De forma predeterminada, tiene 20 pares de divisas en la lista de vigilancia y tres marcos temporales (M5, H1, D1), pero puede elegir los períodos y símbolos que desea mostrar en el menú. Si el indicador es azul, indica el comienzo de una tendencia alcista. Si es rojo, indica el comienzo de una tendencia bajista. En la captura # 3 (modo de luz

Excellent dashboard for market analytics. The panel helps to analyze the values of the Ichimoku indicator and its signals.
With this panel you can: watch the current signal from Ichimoku on all timeframes; watch the current signal from Ichimoku for different symbols; watch the current Ichimoku value; several types of signals for analytics.
Values in a table cell:
Value of Tenkan-Sen Value of Kijun-Sen Value of Senkou Span A Value of Senkou Span B Value of Chikou Span S

Graph configuration and buy and sell signals based on Stormer's (Alexandre Wolwacz, Brazilian trader) swing, position and day trade strategy, described on his youtube channel (https://www.youtube.com/watch?v= 0QZ_NjWkwl0)
The buy and sell indications are based on 2 candle patterns ( Inside Bar [Yellow] and Reversal Closing Price [Blue and Red] ), 3 Moving Averages and 1 Stochastic .
Indicators: Inside Bar - Candle pattern indicating trend continuity, or reversal Reversal Closing Price - Ca
FREE
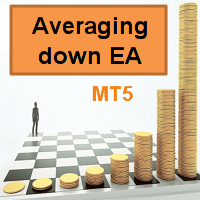
Este asesor experto (EA) de promedio de costos coloca operaciones adicionales en la misma dirección que la orden original (abierta manualmente) cuando el precio va en su contra. Se puede utilizar como un sistema de cuadrícula o como un sistema de martingala puro (aumento exponencial del tamaño del lote) o martingala suavizada (por ejemplo, aumento lineal del tamaño del lote). Debido al riesgo involucrado, este EA es más adecuado para traders de nivel intermedio a avanzado que saben muy bien cómo
VolumeDeltaScanner is a volume delta monitor for multiple (up to 10) time scopes. It works by online ticks or history ticks. Indicator monitors tick volumes for buys and sells separately, and find their delta on every bar and larger scopes, then displays the volume deltas for all the scopes. Every scope is presented by its own buffer/line. The smallest scope is the current timeframe. It's required. All other scopes should be multiples of it. For example, if placed on a M5 chart, it can calculat

ToolBot Probabilistic Analysis - FREE An effective indicator for your negotiations
The toolbot indicator brings the calculation of candles and a probabilistic analysis so that you have more security on your own.
Also test our FREE tops and bottoms indicator: : https://www.mql5.com/pt/market/product/52385#description Also test our FREE (RSI, ATR, ADX, OBV) indicator: https://www.mql5.com/pt/market/product/53448#description
Try our EA ToolBot for free: https://www.mql5.com/market/p
FREE

Moving average indicator to work with the F12 Replay simulation and replay tool.
In this way, the F12 Replay tool now supports the moving average indicator.
F12 Replay: https://www.mql5.com/pt/market/product/38313
This is a product developed by Renato Fiche Junior and available to all MetaTrader 5 users!
Partners: "Águia Traders" team ( Eagle Traders ) by Larissa Sihle #aguiatraders #larissasihle
Input Parameters
Period Shift Method
FREE

O Indicador CoioteChart foi construído pra facilitar desde a leitura de contexto de mercado até a micro estrutura do candle, facilitando ajustes operacionais e tomadas e decisão com alta eficácia.
Possui um controle para habilitar e desabilitar a visualização das pocs, vwap, zonas de máxima e mínima negociação, pode ser utilizado data sources de tempos gráficos para cálculos ou utilizado os ticks de agressão do time and trades, funciona com volume real e volume de ticks.
As colorações são at

It is a Graphical and Trend indicator that brings several advantages. Eliminates noise.
Facilitates the identification of the trends. Can be used as directional force indicator. Identify lateralization: candles with close and open price closer. Identifies high volatility: candles with shadows larger than the body. Attention!!! Works on any asset and any time frame.
Easy setup Symbol: anyone Time frame: anyone Parameters: Indicator Period Recommended Period : betw
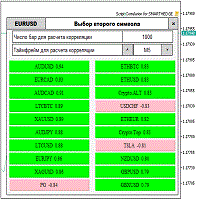
Script for quickly selecting a tool with high correlation. The script is placed on the tool to which you need to select the second correlating one. Then you can change the number of bars to calculate and the timeframe. The script iterates through all available symbols in the market overview and returns the 20 most correlated ones. You can use the selected pairs to trade with THE new SH expert Advisor
FREE

Description
Range Detector is an indicator that identifies ranges in the market and displays their presence on the price chart.
Recommendations
You can use this indicator to determine the flet and, accordingly, to determine the direction of opening a position or closing an opposite position.
Parameters
Maximum History Bars - maximum number of history bars for calculating the indicator. Average True Range Period - ATR indicator period (used to calculate the difference between mov

The indicator identifies two most important patterns of technical analysis - Pin Bar and Engulfing. MT4-version: https://www.mql5.com/en/market/product/53591 Settings: Mincandle size for PinBar - The minimum size of the Pin-Bar candlestick; Percentage of candle body on size - The percentage of the candle body in relation to its length; PinBar Alert - Alert when a Pin-Bar is detected; PinBar Mail - Sends an email when a Pin Bar is found; PinBar Notification - Sends a push notificati

This Indicator is based on the high's moving average and the low's moving average for trend following and/or trailing stops.
How does the indicator work? The indicator plots the uptrend dots until there is a close below the moving average of the lows. When this happens, a downtrend begins and is plotted until there is a close above the moving average of the highs. When this happens, another uptrend begins. And so it goes.
How to use it? - Trend following: You can use it as buy signals when

Do you already know Display N Bars?
Do you already know the Start tool (from Midas indicators)?
In this indicator, we unified the two tools, allowing you to define which candle will start counting, or use the automatic numbering that was already available in the previous version.
Description of the utility follows:
Display N Bars
The Display N Bars utility is a simple tool that aims to help identify candles.
If a trader tries to share the knowledge with a colleague but it i

Mostra a média móvel quando ADX > 20 e pinta de verde ou vermelho quando os valores de ADX estão subindo indicando tendência. Quando o ADX é menor que 20 indica movimento lateral consolidado. O indicador não define pontos de entrada, somente mostra a média colorida quando a tendência está se fortalecendo. Faz parte do grupo de indicadores do Indicador Tavim.
FREE

Description : Rainbow MT5 is a technical indicator based on Moving Average with period 34 and very easy to use. When price crosses above MA and MA changes color to green, then this is a signal to buy. When price crosses below MA and MA changes color to red, then this is a signal to sell. The Expert advisor ( Rainbow EA MT5 ) based on Rainbow MT5 indicator is now available here .
MT4 version is available here .
FREE

O indicador imprime a linha da média longa quando as médias media e curta estão confinadas dentro dos limites de 1 ATR (average tru range) da média longa. Após períodos de congestão os preços se movimentam fortemente em uma direção. Este indicador não fornece pontos de entrada, apenas mostra que as médias estão bastante próximas. Parâmetros: Periodmalongo: Período da média longa. Periodmamedio: Período da segunda média. Periodmamedio2:Período da terceira média. Periodmacurto: Período da média cu
FREE

Candle com coloração de Volume Price Analysis (VPA) segundo as definições da Anna Coulling, é possível configurar períodos de climax e rising, fator de extreme e fator de rising.
Pode-se usar volume real ou volume de ticks. O VPA considera a variação de preço por volume do período, indicando se um movimento está recebendo ignição, está em seu climax ou se já não existe mais interesse.
FREE

Candle de Volume Coiote O Candle de Volume Coiote é um indicador que mede a variação do volume no tempo, seu corpo é pela variação do volume anterior pelo volume atual, sua direção pelo fechamento do preço.
1. identificado um topo no indicador Candle de Volume Coiote (marcado o fechamento do preço).
2. identificado um fundo no indicador Candle de Volume Coiote (marcado o fechamento do preço).
3. fundo 3 igual fundo 2 no indicador Candle de Volume Coiote, preço no 3 é diferente de fundo 2
FREE

This expert advisor joins 18 strategies on crosses and changes, each of them identify a gap on specific custom sessions and try to close the gap. All the parameters are in the code so you can select only the size used for each strategies the base magic number: the real magic numbers used strating from base+1 to base+18. You can specify also the "Suffix" parameters, a special char following the name of the cross in some brokers (eg: EURUSD. EURUSD# EURUSDm) You can also activate/deactivate eve
FREE
Trade with your MT5 Account on a custom API-Endpoint.
1. Activate API on your Signal Site.
2. Enter your Username.
3. Enter your Account-Password.
4. Enter the API-Endpoint URL to your MT5 Account (Extras -> Options -> Experts -> Allow WebRequest).
Lot Size Settings
Auto Lot = 0 and Fixed Lot = 0 : Copy Lot Size.
Auto Lot : Option to send normalized Lot-Size depends from Free Margin on Trading-Account. Because other Traders will start with different Account Size.
For Example:
TrendFollowMT is a fully automated trading system which is using large time frame to determine the trend and use small time frame to find the entry point. Once the trend changed to opposite side, the system will wait for another entry point to recover with bigger lot size. Moreover, the target profit will be moved up when more position had been opened. The aim is to cover the cost of waiting time and risk.
Free version will only trade on buy signal and locked the initial Lot size (0.01). Paid
FREE

Indicador que cria um painel para acompanhamento to total de posições abertas no ativo do gráfivo.
São apresentados os dados: Ativo do gráfico Total de posições de venda em aberto Quantidade do volume de posições de venda em aberto Total de posições de compra em aberto Quantidade do volume de posições de compra em aberto.
Painel simples mas eficiente para o equilíbrio das ordens
FREE
EA finds the largest volume in the market and determines the level for entry. After crossing the level towards the breakdown, a market order is opened. The EA builds a two-sided grid of orders, adapting to the market. Each direction of orders works separately and has its own take-profit. Thus, the adviser covers the whole trend, starting from its start, while the adviser perfectly passes the flat market condition, trading both directions. Please see all my products: https://www.mql5.com/en/user
FREE
Prosperadlo.
CatchCandleLimitOrderOneSymbol - asesor plano, para abrir órdenes desde los límites del canal al centro, trabaja en retrocesos desde el nivel de soporte y el nivel de resistencia, desde el indicador de ancho de canal personalizado TMA, con s/L y T/P. espere la mejor desviación y luego ingrese al mercado con órdenes como buylimit ; selllimit, también pensamos que hemos creado un experto que, siguiendo el movimiento general del precio, determina el punto de entrada para regresar de

Ligeramente cambiado para la velocidad. se requieren probadores para un nuevo asesor, que está interesado en enviarme un correo electrónico 777basil@mail.ru
El cálculo del indicador se basa en el cambio de precio en la historia y se calcula matemáticamente, se vuelve a calcular cada vez que se reciben nuevos datos. Se puede utilizar en diferentes Marcos de tiempo. Desde los límites del indicador en 70% hay un cambio en la dirección del movimiento del precio, o la consolidación. Por lo tanto, p
FREE

El indicador funciona según los indicadores de los indicadores estándar integrados, los indicadores del indicador tienen en cuenta los indicadores actuales de 30 indicadores estándar y dan una señal de compra o venta, de la tendencia general de todas las direcciones de otros indicadores. En los parámetros de entrada, puede configurar parámetros específicos para cada indicador. el indicador se ejecuta en forma de oscilador y muestra la tendencia general y la preponderancia de todos los indicadore
FREE

Este asesor experto cuenta con un indicador de fuerza avanzado que detecta el cambio de impulso y corta la posición mediante el uso de su inteligencia. Donde genera ingresos a largo plazo. El usuario puede cambiar el tamaño del lote según el cálculo de riesgo proporcionado por nuestro equipo. Se diferencia de otros EA. donde esto se adapta a la usabilidad a largo plazo con rendimientos decentes, esto debe ejecutarse en un marco de tiempo de 1 hora de EURUSD y los Clientes pueden aumentar el tama

Excellent dashboard for market analytics. The panel helps to analyze the values of the RSI indicator and its signals.
With this panel you can: watch the current signal from RSI on all timeframes; watch the current signal from RSI by different symbols; watch the current RSI value; several types of signals for analytics.
Values in a table cell: RIS value.
Signal type: RSI crosses level buy out/level sell out (outside); RSI crosses level buy out/level sell out (inside);
RSI is u
El Mercado MetaTrader es la única tienda donde se puede descargar la versión demo de un robot comercial y ponerla a prueba, e incluso optimizarla según los datos históricos.
Lea la descripción y los comentarios de los compradores sobre el producto que le interese, descárguelo directamente al terminal y compruebe cómo testar el robot comercial antes de la compra. Sólo con nosotros podrá hacerse una idea sobre el programa, sin pagar por ello.
Está perdiendo oportunidades comerciales:
- Aplicaciones de trading gratuitas
- 8 000+ señales para copiar
- Noticias económicas para analizar los mercados financieros
Registro
Entrada
Si no tiene cuenta de usuario, regístrese
Para iniciar sesión y usar el sitio web MQL5.com es necesario permitir el uso de Сookies.
Por favor, active este ajuste en su navegador, de lo contrario, no podrá iniciar sesión.