KT Horizontal Lines MT5
- Indicators
- KEENBASE SOFTWARE SOLUTIONS
- Version: 1.0
- Activations: 5
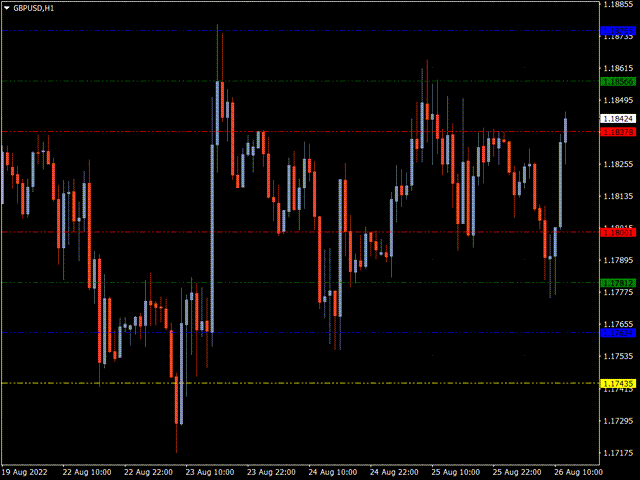
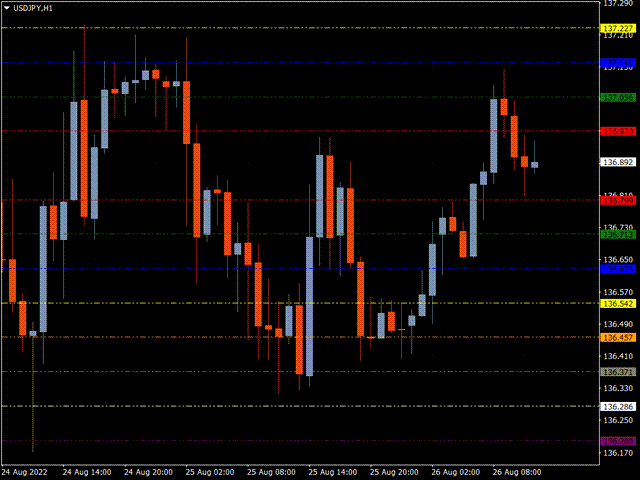
In MetaTrader, plotting multiple horizontal lines and then tracking their respective price levels can be a hassle. This indicator automatically plots multiple horizontal lines at equal intervals for setting price alerts, plotting support and resistance levels, and other manual purposes.
This indicator is suitable for Forex traders who are new and looking for chances to make quick profits from buying and selling. Horizontal lines can help traders find possible areas to start trading when the market is following a trend or is not moving much.
Features
- It can plot multiple horizontal lines in a blink of an eye following the pre-configuration in the input settings.
- A vibrant color theme to differentiate between the multiple horizontal lines.
- A must-have tool to track the range of various trading sessions.
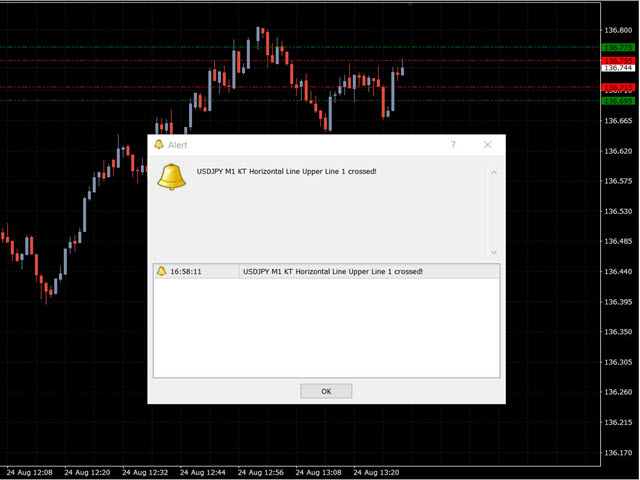
- Sends alerts whenever the price touches a horizontal line.
- Ability to insert a gap between each alert to stop too many annoying alerts.
- Fully customizable.
Explanation
The indicator plot the horizontal lines using the instruction and data from the input settings. Observing how the price reacts at the horizontal lines can identify potential trade opportunities near the critical support/resistance levels.
For example, a bullish pin bar at the horizontal support indicates that the price will likely move to the nearest resistance level.
A bearish candle that closes below the support also indicates that the price has just had a bearish breakout. A false breakout at the horizontal line indicates that the price has failed to break a significant level and intends to reverse.
Some price reversal patterns, such as a pin bar or false break, can be beneficial in detecting trade opportunities at horizontal levels.


