Support Resistance Fibonacci
- Indicators
- Leonid Basis
- Version: 5.10
- Updated: 20 April 2020
- Activations: 5
Support occurs when falling prices stop, change direction, and begin to rise. Support is often viewed as a “floor” which is supporting, or holding up, prices.
Resistance is a price level where rising prices stop, change direction, and begin to fall. Resistance is often viewed as a “ceiling” keeping prices from rising higher.
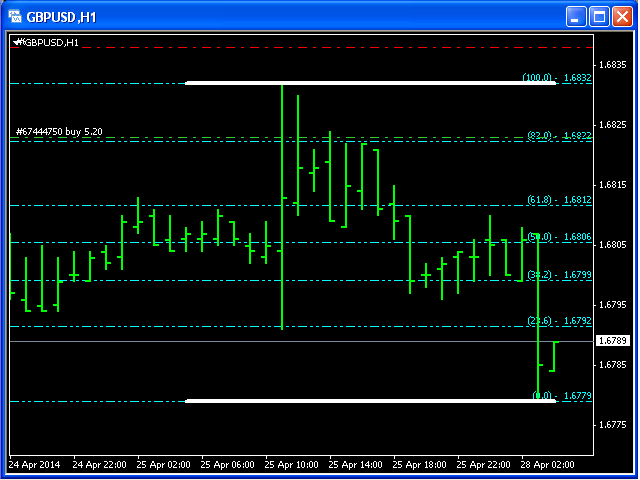
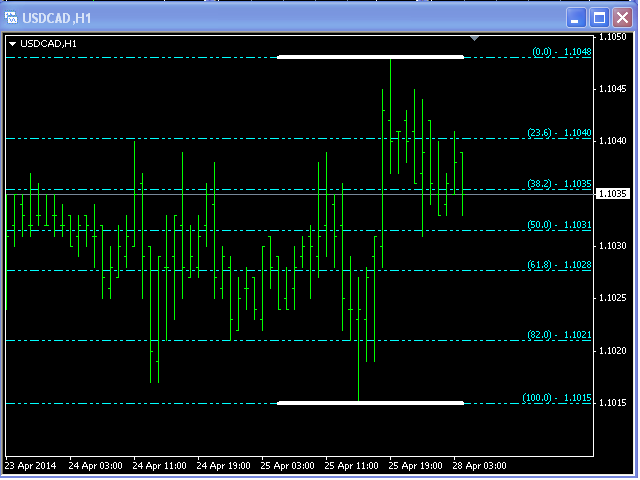
This indicator will draw the Support and Resistance lines calculated on the nBars distance.
If input parameter Fibo = true then the Fibonacci lines will appear between those lines.
User didn't leave any comment to the rating