MinMax Levels
- Indicators
- Ivan Butko
- Version: 1.0
- Activations: 20
MinMax Levels
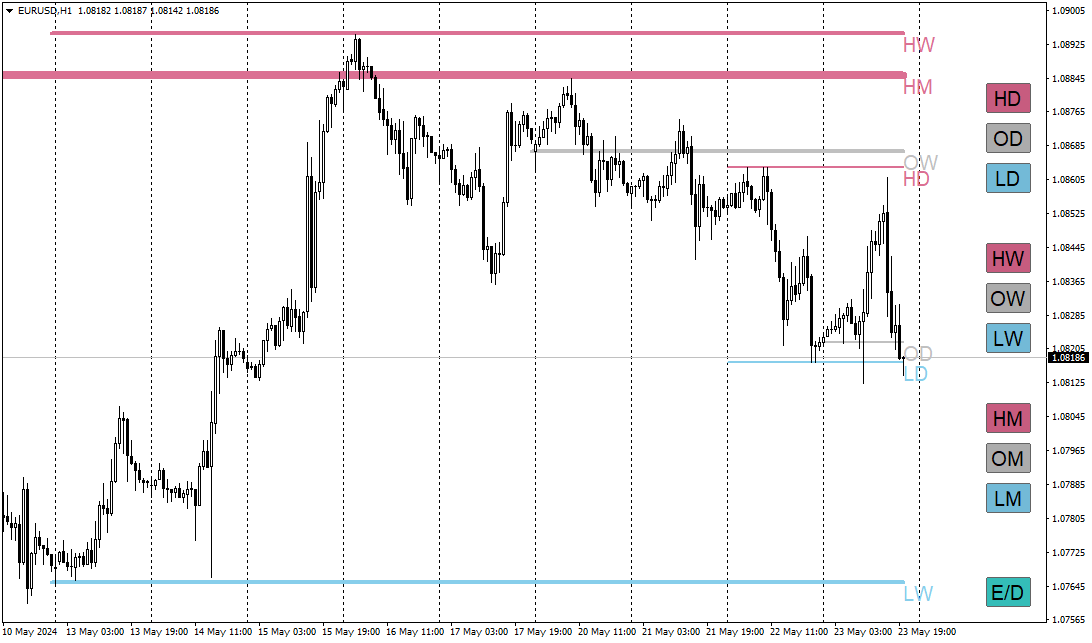
MinMax Levels – is an indicator of the maximum, minimum and opening price levels for important trading periods: day, week and month.
Each Forex market participant uses levels in their trading system. They can be either the main signal for making transactions or an additional one, acting as an analytical tool.
In this indicator, days, weeks and months were selected as important periods, since they are the key trading periods of large market participants. As you know, prices move from level to level and knowledge of the price position relative to important levels gives an advantage in making trading decisions.
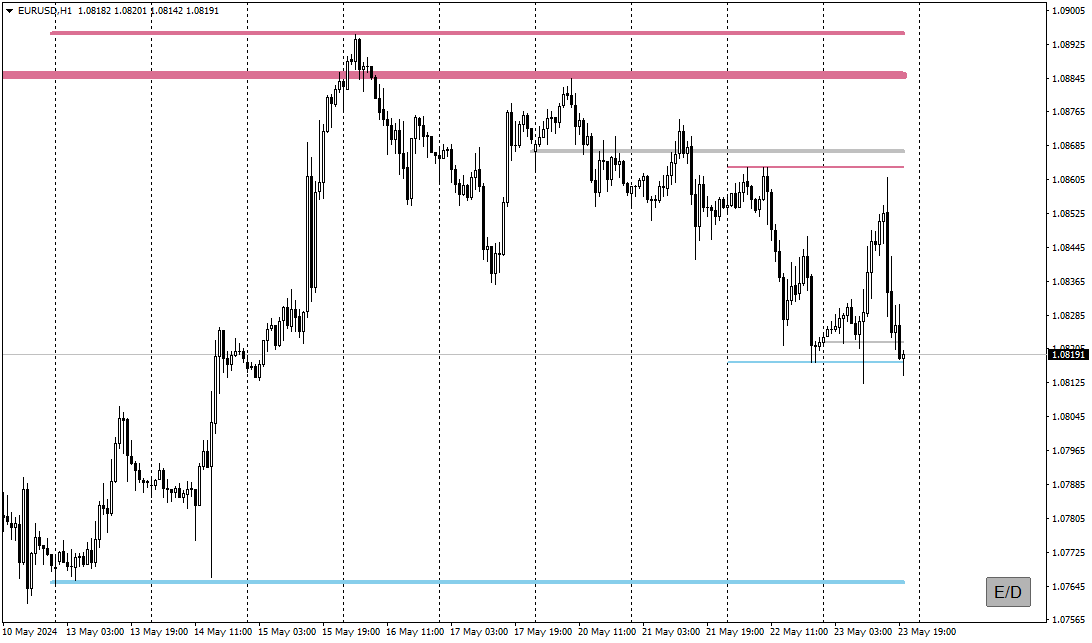
And for convenience, buttons have been added to enable and disable both the levels themselves, and to collapse the buttons to free up space in the working window of the price chart.
Each Forex market participant uses levels in their trading system. They can be either the main signal for making transactions or an additional one, acting as an analytical tool.
In this indicator, days, weeks and months were selected as important periods, since they are the key trading periods of large market participants. As you know, prices move from level to level and knowledge of the price position relative to important levels gives an advantage in making trading decisions.
And for convenience, buttons have been added to enable and disable both the levels themselves, and to collapse the buttons to free up space in the working window of the price chart.
Advantages of this indicator:
- Convenience
- Visibility
- Information content
- Latest levels
- Customizable levels
The indicator is convenient because you do not need to switch to different timeframes when working.
Visibility - the most important levels from smaller to medium and large market movements are visible in one chart.
Information content - visually we get more information about the price chart.
Customizable levels can be disabled directly on the chart, and the buttons themselves can be minimized to free up the chart’s workspace.
Now all trading strategies based on or based on the MinMax Levels indicator will have an additional signal.
Additionally, the highs, lows, and opening prices of days, weeks, and months can act as support and resistance levels. And in some trading strategies, show liquidity levels.
Use the MinMax Levels indicator as an addition to your trading system
Try also my other products in the market https://www.mql5.com/ru/users/capitalplus/seller
Wishing you great profits in trading!