Watch the Market tutorial videos on YouTube
How to buy а trading robot or an indicator
Run your EA on
virtual hosting
virtual hosting
Test аn indicator/trading robot before buying
Want to earn in the Market?
How to present a product for a sell-through
Paid Expert Advisors and Indicators for MetaTrader 5 - 33

Equity X è una utility che chiude tutte le posizioni ed eventuali ordini pendenti ad un importo prestabilito, è possibile fissare il bilancio del tuo conto quando il netto e uguale o superiore oppure uguale inferiore all'importo desiderato Ha integrato un sistema per la notifica mobile instantanea che genera il messaggio ad operazione avvenuta Uno strumento che permette di ottimizzare al massimo il rendimento del tuo investimento, è possibile utilizzarlo anche come gestore virtuale di take prof

Our goal is to empower every trader with their own unique trading system.
Indicator - Red-Green Series
Ultimate simplicity: Red for uptrend, green for downtrend! It can be used independently or in combination with other indicators. This is a red-green indicator based on the crossover of two moving averages. We have more indicators in store and will be adding them gradually. Friends who make a purchase are kindly requested to contact us after their purchase.
In the world of financial tradi
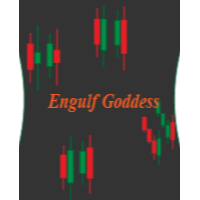
Introducing the Engulfing Goddess Metatrader 5 (MT5) Indicator , a revolutionary tool designed for traders who seek to harness the power of candlestick patterns in their trading strategy. This indicator is built on the principles of engulfing candlestick patterns , a popular method used by successful traders worldwide. Our Engulfing Goddess Indicator stands out with its ability to detect various kinds of engulfing patterns . It employs a range of filters, providing you with a comprehensive anal

MT5TradePanel_V1 The panel supports market and pending orders Closing of positions by order type -trade -statistics - risk management - Trailing Stop -select the variant of risk calculation FIXED_LOTS, // fixed lots RISK_MONEY, // lots based on money RISK_RATIO // risk percent of account - percent of loss warning -percent od loss close all -show symbol info

Introducing Algo Map Lite – a cutting-edge software designed to revolutionize your trading experience. This advanced tool seamlessly integrates with your trading sessions, providing comprehensive breakout level analysis on each occasion.
In addition to its intuitive interface and real-time level printing functionality, Algo Map Lite stands out by incorporating meticulous win rate metrics to fortify its performance claims. Our commitment to transparency and reliability is exemplified through ou

A very simple position sizing calculator to help traders calculate the right lot size per trade. It also places the order with one click. All inputs can be edited. So if you want to change the SL or TP or the lot size, you can do so before placing an order. The inputs are the following: SL - stop loss in pips (not points). set to 0 before placing an order to not add SL. TP - take profit in pips (not points). set to 0 before placing an order to not add TP. RISK - dollar amount to risk. i

The Dragonfly Doji candlestick pattern is formed by one single candle. Here’s how to identify the Dragonfly Doji candlestick pattern: The candle has no body The wick at the bottom must be big At the top, it should have no wick, or be very small This 1-candle bullish candlestick pattern is a reversal pattern, meaning that it’s used to find bottoms. For this reason, we want to see this pattern after a move to the downside, showing that bulls are starting to take control. When a Dragonfly Doji cand
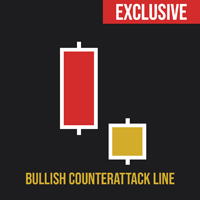
The Bullish Counterattack Line candlestick pattern is formed by two candles. Here’s how to identify the Bullish Counterattack candlestick pattern: The first candle is bearish and big The second candle is bullish and small There’s a gap between the close of the first candle and the open of the second candle They both close at the same level This 2-candle bullish candlestick pattern is a reversal pattern, meaning that it’s used to find bottoms. For this reason, we want to see this pattern after a

The Three Outside Up candlestick pattern is formed by three candles. Here’s how to identify the Three Outside Up candlestick pattern: The first candle is bearish and small The second candle is bullish and engulfs the first one completely The third candle is bullish and closes above the other ones This 3-candle bullish candlestick pattern is a reversal pattern, meaning that it’s used to find bottoms. For this reason, we want to see this pattern after a move to the downside, showing that bulls are

The Tweezer Bottom candlestick pattern is formed by two candles. Here’s how to identify the Tweezer Bottom candlestick pattern: The first candle is bearish The second candle is bullish The lows from both candles should be pretty much at the same level This 2-candle bullish candlestick pattern is a reversal pattern, meaning that it’s used to find bottoms. For this reason, we want to see this pattern after a move to the downside, showing that bulls are starting to take control. When a Tweezer Bott

The Bullish Harami candlestick pattern is formed by two candles. Here’s how to identify the Bullish Harami candlestick pattern: The first candle must be bearish and have a big body The second candle must be small and bullish The second candle is inside the body of the first candle This 2-candle bullish candlestick pattern is a reversal pattern, meaning that it’s used to find bottoms. For this reason, we want to see this pattern after a move to the downside, showing that bulls are starting to
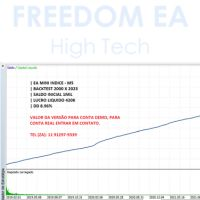
Looking to boost your financial market results?
The EA Mini Index is the answer. Tested and enhanced since 2000, this expert advisor offers operations on the M5 chart, with an initial balance of R$ 1,000 and an impressive net profit of R$ 420,000 until 2023, maintaining a drawdown of only 8.96%.
Seize this unique opportunity to increase your profitability and operate more effectively.

Currency Strength Dynamic Currency Strength Dynamic is an indicator of currency strength. Currency strength refers to the trend direction of most or all currency pairs that a currency is a part of.
The indicator is based on readings of the difference between moving averages, similar to the MACD indicator, on the 28 most popular currency pairs: majors and minors.
Advantages Unique oscillatory calculation method Availability of buttons to disable or enable lines of specific currencies Infor

This indicator helps you identify support and resistance levels. Also it adds break points when level is broken. Price sometimes goes back to break point. It has 4 technical parameters and 4 buffers for expert advisors. Buffer indexes: 0 - Resistance, 1 - Support, 2 - Resistance break point, 3 - Support break point". Number of Levels: Determines how many levels are on graph ( if 3 - 3 levels of support and 3 levels of resistance) Tolerance in percentage %: This parameter is used to filter out
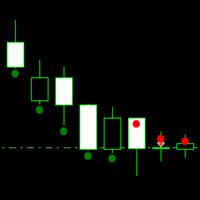
Simple EA with an self-made indicator and Grid. The Expertadvisor opens positions when the market behavior changed from bullish to bearish or vice versa. To determine the market behavior the indicator simply measures how many points it has moved up and down for the last X candles.
It then uses a simple grid strategy if the position turns into a loss. Grid levels can be defined specific to the market.
It depends on your personal preferences and the respective market which parameters should be
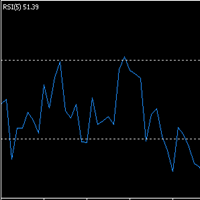
Simple EA with two indicators (SMA + RSI) and Grid. The Expertadvisor opens positions in the direction of the trend when the RSI line turns above 80 or below 20. It then uses a simple grid strategy if the position turns into a loss. Grid levels can be defined specific to the market.
It depends on your personal preferences and the respective market which parameters should be set and how. You have to test it yourself. The EA is programmed in such a way that optimization runs consume little time.

MT4 Version : https://www.mql5.com/en/market/product/90077 MT5 Version : https://www.mql5.com/en/market/product/103136
The "KingKong" Expert Advisor (EA) is a sophisticated trading algorithm designed for the Forex market, leveraging a breakout strategy that activates during periods of increased market liquidity. This EA is crafted to capitalize on significant price movements that occur when trading volume spikes, ensuring that trades are executed at optimal moments of market activity.
Key F
Prop Drawdown Manager is a sophisticated utility tool designed to assist traders in effectively managing and minimizing the impact of drawdowns within their forex trading accounts. Drawdowns, which represent the reduction in capital from peak to trough, are an inevitable aspect of trading, but they can be detrimental if not managed properly. This utility provides traders with a suite of features aimed at controlling drawdowns and preserving trading capital: 1. Drawdown Thresholds : Traders can

Subscribe to the 'MA7 Trading' channel to receive notifications about new programs, updates and other information. Ask questions in the profile on the MQL5 .
Description of work
The 'MA7 Agave' indicator is based on the standard Average Directional Movement Index (ADX) indicator. Shows the intersection of the +DI and -DI lines. Detailed information about the 'MA7 Agave' indicator.
Indicator settings
General settings: ADX period - Average Directional Movement Index indicator period.
'MA7

The underlying strategy of this indicator is based on identifying momentum in the market and attempting to capture the direction of the trend through transitions between bullish and bearish moments. Utilizing bands around the RWMA allows for identifying potential overbought and oversold situations in the market.
1. Calculation of the Range Momentum Index (RMI): The RMI is based on a combination of the Relative Strength Index (RSI) and the Money Flow Index (MFI), both of which are momentum ind

Exclusive FOREX account HEDGE FuzzyLogicTrendEA is based on fuzzy logic strategy based on analysis 5 indicators and filters.
When the EA analysis all this indicators, it decides, based on its fuzzy strategy, which trade will be better: sell or buy.
As additional functions, it´s possible defines spread maximum, stop loss and others.
Recomm. Symbol: EURUSD, AUDUSD, GBPUSD, NZDUSD, USDCAD, AUDCAD, EURCAD e USDJPY
Recomm. timeframe: H1.
Backtest were done on EURUSD, H1, 01/07/2023 - 26/0

Introducing the True Currency Strength Indicator - Your Ultimate Guide to Market Mastery! Are you tired of guesswork when it comes to trading? Ready to elevate your trading strategy to a whole new level? Look no further! We present to you the True Currency Strength Indicator - the game-changer in the world of Forex trading. Unleash the Power of Multi-Currency Analysis: Gain a competitive edge with our revolutionary indicator that goes beyond traditional single-currency analysis. The Tru

Introducing UJ Master EA, a simple yet powerful Expert Advisor for trading the USDJPY pair! Developed, tested and traded by a team of experienced traders with trading experience of over two decades. Prop-Firms Ready Easy To Set up Not sensitive to broker conditions UJ Master EA is updated every 3 months to get the best results!
UJ Master EA utilizes a complex price action strategy and smart money concepts, following strict mechanical rules. For the best possible results, follow these st
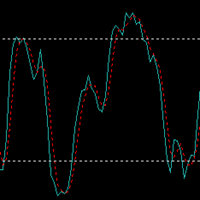
Simple EA with two indicators (SMA + STOCHASTIC) and Grid. The Expertadvisor opens positions in the direction of the trend when the lines of the Stochastic indicator intersect in the swing high or swing low area. It then uses a simple grid strategy if the position turns into a loss. Grid levels can be defined specific to the market.
It depends on your personal preferences and the respective market which parameters should be set and how. You have to test it yourself. The EA is programmed in suc
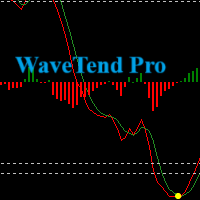
Introducing our Wave Trend Oscillator Indicator , exclusively designed for MetaTrader 5 . This advanced tool is a must-have for traders who seek precision and efficiency in their trading journey. Our oscillator is built on the principles of wave trend analysis , capturing the ebb and flow of market trends with unparalleled accuracy. It helps traders identify potential buying and selling points based on market wave patterns, enabling you to stay ahead of the market. One of the key features of ou

Uncover high-probability opportunities in trending markets with the Brilliant Entries Indicator. Its clear visual signals can be followed and incorporated with market structure to provide you with accurate entries. Give it a try and gain an edge in your trading strategy.
It can be used on it's own but i highly recommend to used it as part of a wider strategy to provide you with confluence.
It works on all timeframes but will work very good doing market structure 2 x timeframes higher and t

Designed by Welles Wilder for daily commodity charts, the ADXW is now used in various markets by technical traders to assess the strength of a trend or even a trend for short- or long-term trades.
The ADXW uses a positive (DI+) and negative (DI-) directional indicator in addition to its trend line (ADX).
According to Wilder, a trend has strength when the ADX signal is above 25; the trend is weak (or the price has no trend) when the ADX is below 20. The absence of a trend does not mean that

The Adaptive Market Navigator(AMN) EA is an automated trend-based trading advisor combining the advantages of ATR, Bears Power and Moving Average indicators. The used strategy is well suited for both beginners and experienced traders.
The minimum deposit is $100 for a 1:100 leverage.
I recommend to use a 1:100 ECN account with a low spread and a fast VPS.
Optimized for EURUSD pair on 1H timeframe.
Due to the simplicity and convenience of this EA every user can give it a try and choose t

Position Manager serves as an expert advisor (EA) designed to enhance your trading experience by providing a user-friendly panel for intuitive management of your positions. This tool empowers you with a seamless interface, allowing for efficient handling of trades and improved control over your trading positions. The primary objective of Position Manager is to simplify and streamline the management of your positions, enabling you to make informed decisions with ease. Through its intuitive design

Nuker shows a practical functionality by examining the length of the preceding candle and taking action when it exceeds a predetermined threshold. By considering the historical context of candle lengths, Nuker response to candle length variations. Backtest was perform using in sample data from 2012 until 2019 and out of sample from 2020 to the middle of 2023. As you can see in the picture below, the results are fantastic in the last 3 years. It is live since August 2023, also providing an excele

CoinHarbor uses a seasonal pattern for the purchase and sale of Bitcoin . The primary aim of this strategy is to minimizing drawdown (DD). It's important to note that this approach is uniquely applicable solely to Bitcoin transactions, demonstrating a clear advantage in this specific asset. In essence, the strategy is structured to ensure a thoughtful balance between risk mitigation and profit optimization in the context of Bitcoin's distinct characteristics. The only configuration required is

Smart Manager Dashboard - with auto virtual TP and auto virtual SL for all trades. [Converted from MT4 version - All screenshots are from MT4]
-this EA is a powerful trade manager that can manage all symbols and all trades at once , all from one chart so it is a must have tool for every trader who keeps more trades at once. -it mainly does 2 things : INFO ABOUT TRADES and CLOSING TRADES (grouped by their symbol, so with this tool it is very easy and fast to manage even hundred

The White Marubozu candlestick pattern is formed by one single candle. Here’s how to identify the White Marubozu candlestick pattern: One single bullish candle The body must be big The wicks should be small or non-existent This 1-candle bullish candlestick pattern is a reversal pattern, meaning that it’s used to find bottoms. For this reason, we want to see this pattern after a move to the downside, showing that bulls are starting to take control. When a White Marubozu candlestick pattern ap

The Three White Soldiers candlestick pattern is formed by three candles. Here’s how to identify the Three White Soldiers candlestick pattern: Three consecutive bullish candles The bodies should be big The wicks should be small or non-existent This 3-candle bullish candlestick pattern is a reversal pattern, meaning that it’s used to find bottoms. For this reason, we want to see this pattern after a move to the downside, showing that bulls are starting to take control. When a Three White Soldi

The Three Inside Up candlestick pattern is formed by three candles. Here’s how to identify the Three Inside Up candlestick pattern: The first candle must be bearish The second candle must be bullish The close of the second candle should ideally be above the 50% level of the body of the first one The third candle should close above the first one This 3-candle bullish candlestick pattern is a reversal pattern, meaning that it’s used to find bottoms. For this reason, we want to see this pattern

The Morning Star candlestick pattern is formed by three candles. Here’s how to identify the Morning Star candlestick pattern: The first candle must be bearish The third candle must be bullish The second candle must be small compared to the others, like a Doji or a Spinning Top The color of the second candle doesn’t matter Ideally, the body of the second candle shouldn’t overlap with the bodies of the other two candles This 3-candle bullish candlestick pattern is a reversal pattern, meaning t

The Piercing candlestick pattern is formed by two candles. Here’s how to identify the Piercing candlestick pattern: The first candle must be bearish The second candle must be bullish The open level of the second candle must be below the first candle (there’s a gap there) The close of the second candle must be above the 50% level of the body of the first candle This 2-candle bullish candlestick pattern is a reversal pattern, meaning that it’s used to find bottoms. For this reason, we want to

Flat è una utility pensata per chi ama operare con take profit e stop loss virtuali ed ordini di copertura come sistema di protezione del capitale, ma a volte ad esempio la notte non è possibile operare quindi si è costretti ad intervenire nel momento e nel modo sbagliato Facciamo un esempio, dopo aver ricevuto un segnale ti posizioni sul mercato con una posizione Long ma il mercato a bassi volumi e comprendi che il tuo posizionamento è valido ma bisogna attendere più di quanto pensavi fosse ne

Простой индикатор тренда в NRTR виде с отрисовкой линий стоплосса и тейпрофита, цвет и направление движения которых определяются действующим трендом. Индикатор имеет возможность подавать алерты, отправлять почтовые сообщения и push-сигналы при смене направления тренда. Следует учесть что значение входного параметра индикатора Deviation of the take profit line in points для каждого финансового актива на каждом таймфрейме необходимо подбирать индивидуально!

I'm proudly introducing "Spread Eliminator" - Your Ultimate Solution against High Spreads in Forex Trading! Are you tired of hitting Stop Losses or having pending orders triggered at a bad price due to high spreads while trading? All this is now over with our revolutionary EA , Spread Eliminator! Can be used on Prop Firms that enforce high overnight spreads and/or high spreads during high volatile market conditions. Key Features: Smart Spread Monitoring: Spread Eliminator constantly monitors mar

A simple script to remove all indicators from the current chart/ all charts.
How to use: Simply double-click the script, choose either delete all indicators from this chart or all charts, and all is set.
Terminate once perform the deletion, so don't worry about constantly deleting your setup indicator.
Thanks for purchasing, wish you happy trading, thanks!

An indicator to show the current U.S. Dollar Index ( USDX , DXY , DX ). It is a weighted geometric mean of the dollar's value relative to the following select currencies: Euro (EUR), 57.6% weight. Japanese yen (JPY) 13.6% weight. Pound sterling (GBP), 11.9% weight. Canadian dollar (CAD), 9.1% weight. Swedish krona (SEK), 4.2% weight. Swiss franc (CHF) 3.6% weight.
You can request me to customize a similar indicator with weighted and currency pairs you desire. Just call me on MQL5, thank

HAshi-E is an enhanced way to analyze Heiken-Ashi signals.
Briefing:
Heiken-Ashi is particularly valued for its ability to filter out short-term volatility, making it a preferred tool for identifying and following trends, helps in decision-making regarding entry and exit points, and assists in distinguishing between false signals and genuine trend reversals. Unlike traditional candlestick charts, Heiken-Ashi candles are calculated using average values of previous bars, creating a smoother,
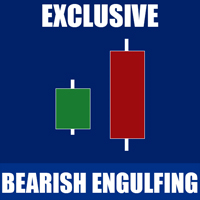
The Bearish Engulfing candlestick, a potent signal in technical analysis, marks a potential shift in market sentiment. This compelling pattern unfolds when a smaller bullish candle is completely overshadowed by a larger bearish candle. The Bearish Engulfing signifies a transition from bullish to bearish momentum, capturing the attention of traders anticipating a downtrend. Savvy investors leverage this pattern to identify potential selling opportunities, signaling a shift towards bearish market

Profit X invia notifiche sul tuo dispositivo mobile mantenendoti aggiornato sul profitto dei tuoi investimenti anche nei momenti in cui non puoi fisicamente controllare i mercati, ad esempio quando sei alla guida, sul posto di lavoro, in una riunione o con amici, con parenti e non puoi distrarti Può essere disattivata e attivata ed è possibile scegliere la frequenza del aggiornamenti in minuti, ore, giorni, settimanale o mensile La configurazione e personalizzazione è molto semplice, di default

**MT5** Elevate your risk management game with Equity Savior, the go-to Expert Advisor designed to safeguard your equity during prop firm challenges. This powerful yet user-friendly tool lets you choose your preferred trading session, set a maximum lot size, and establish a daily trade limit effortlessly. Key Features: Session Selection: Tailor your trading approach by selecting specific sessions, aligning with your strategy and prop firm challenge requirements. Max Lot Size Control: Take co

Elevate your trading experience with Dynamic Trader EA MT5 , a cutting-edge trading robot designed to optimize your investment strategy. This advanced algorithm harnesses the power of four key indicators: RSI ( Relative Strength Index ), Stochastic Oscillator , MACD ( Moving Average Convergence Divergence ) and ATR ( Average True Range ) to make informed and precise trading decisions. ATR is used to dynamically set stop-loss and take-profit levels based on market volatility. IMPORTANT!
Read

The Bullish Engulfing candlestick pattern is formed by two candles. Here’s how to identify the Bullish Engulfing candlestick pattern: The first candle must be bearish The second candle must be bullish The body of the second candle must cover the body of the first candle This 2-candle bullish candlestick pattern is a reversal pattern, meaning that it’s used to find bottoms. For this reason, we want to see this pattern after a move to the downside, showing that bulls are starting to take cont

The Hammer candlestick pattern is formed by one single candle. Here’s how to identify the Hammer candlestick pattern: The candle has a small body The wick at the bottom must be big compared to the body At the top, it should have no wick, or be very small The color of the body doesn’t matter This 1-candle bullish candlestick pattern is a reversal pattern, meaning that it’s used to find bottoms. For this reason, we want to see this pattern after a move to the downside, showing that bulls are star

Master Breakout is a very accurate expert advisor for gold and all pair currencies. This EA is designed with a moving average indicator to see trends, RSI to see momentum, and range/time breakout candles for entry points.
Signal Features : Range breakout Time range breakout Fractal breakout PSAR breakout
Additional Signal : Moving average RSI
Recommendations:
Currency pair: XAUUSD/GOLD and ALL PAIR CURRENCIES Timeframe: M5 Minimum deposit currencies : $250 ($500 recommended) Minimum de

The Hanging Man candlestick, a significant player in technical analysis, provides a crucial signal for potential trend reversals in financial markets. Characterized by its small real body, long lower shadow, and minimal upper shadow, the Hanging Man hints at a shift from bullish to bearish momentum. Savvy traders use this pattern to identify potential selling opportunities, suggesting a possible weakening of an uptrend. Dive into the intricacies of the Hanging Man candlestick to refine your mark

The Shooting Star candlestick, a key player in technical analysis, serves as a harbinger of potential trend reversals in financial markets. Distinguished by its small real body, long upper shadow, and minimal lower shadow, the Shooting Star suggests a shift from bullish to bearish momentum. Traders keen on market insights often use this pattern to identify potential selling opportunities, highlighting potential weakness after an uptrend. Harness the power of the Shooting Star to refine your cand

Vision è un indicatore professionale che legge i dati storici del periodo impostato e in base a tali elabora una previsione scrivendo l'andamento sul grafico, l'impatto visivo eccellente rende chiaro l'andamento del prossimo trend e mette a fuoco il prezzo d'ingresso il posizionamento di ordini e la distanza per SL e TP, di default è impostato con un rapporto bilanciato 24 a 24 ciò significa che in base alle ultime 24 candele prevederà scrivendo sul grafico l'andamento delle 24 candele successi

The Inverted Hammer candlestick pattern is formed by one single candle. Here’s how to identify the Inverted Hammer candlestick pattern: The candle has a small body The wick at the top must be big compared to the body At the bottom, it should have no wick, or be very small The color of the body doesn’t matter This 1-candle bullish candlestick pattern is a reversal pattern, meaning that it’s used to find bottoms. For this reason, we want to see this pattern after a move to the downside, showi

The Liquidation Estimates (Real-Time) experimental indicator attempts to highlight real-time long and short liquidations on all timeframes. Here with liquidations, we refer to the process of forcibly closing a trader's position in the market.
By analyzing liquidation data, traders can gauge market sentiment, identify potential support and resistance levels, identify potential trend reversals, and make informed decisions about entry and exit points.
USAGE (Img 1) Liquidation refer
Simple EA with two indicators (SMA + MACD) and Grid. The Expertadvisor opens positions in the direction of the trend when MACD value crosses MACD signal line in a special constellation. It then uses a simple grid strategy if the position turns into a loss. Grid levels can be defined specific to the market.
It depends on your personal preferences and the respective market which parameters should be set and how. You have to test it yourself. The EA is programmed in such a way that optimization r

The Golden Pattern is a 3-candlestick configuration based on the golden ratio from the Fibonacci sequence. The golden ratio is 1.618. Its variations include 0.618, 2.618, and 3.618. In this indicator, results are best with 2.618.
The Golden pattern is composed of a normal candle, followed by a bigger one, with a close price at least 2.618 times the size of the first candle. Bullish Golden Pattern is made of bullish candles, whereas Bearish Golden Pattern is made of bearish candles.
In add
Simple EA with 3 SMAs and Grid. The Expertadvisor can be run in either “TREND” or “RETRACE” mode. In trend mode, it opens positions in the direction of the movement of the base moving average. In retrace mode, it opens positions in anticipation of the price moving back to the base moving average. It then uses a simple grid strategy if the position turns into a loss. Grid levels can be defined specific to the market. User can set "positive Swap Only"-Mode to reduce trading costs for positions tha
The Expert Advisor uses an Triangle Pattern as a signal and opens positions when the triangle and the price action reach a certain constellation. It then uses a simple grid strategy if the position turns into a loss. Grid levels can be defined specific to the market. User can set "positive Swap Only"-Mode to reduce trading costs for positions that may need to be held for a longer period of time. A news filter, filter by day of the week and fibonacci pricelevel filter are built in. It depends on
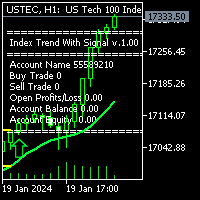
Description: Index Trend with Signal: is the Best working on DE40, USTEC, US30, US500 index on H-1 time chart with default settings. You don't need to change any settings. Easy to install and ready to start working. First of all this Index Trend with Signal Indicator is Non-Repainting, Non-Redrawing Indicator, which is best tool for Index Traders. For limited time only 50% OFF, Now 51$ only. 10 purchases left & the price increases to 30$ and final price will be 300$
Contact me right after t
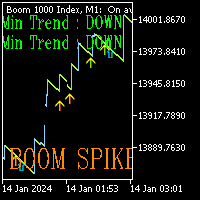
Boom Spike mater is the future for trading Boom markets. It has been designed to run on Boom 300 , 500 and 1000 markets on the 1 minute timeframe. It has 2 different trading modes (Aggressive and Normal) Aggressive mode will plot Yellow and blue arrows. 2 different conditions to help you make the right choice. Enter first trade on yellow arrow and second trade on blue candle. SL in this mode will be 10 Candles from the blue arrow. Normal mode will only plot red arrows on the chart. This mode is

The 'Shuriken' breakout strategy is not only simple but also highly effective! It enters a position based on the previous day's high or low when the market is uncertain, in anticipation of a breakout in one direction. One of the key features of Shuriken is its dollar-based stop loss and profit target, rather than relying on pips. This approach ensures a more confident and decisive trading experience, allowing traders to take control of their trades and maximize their profits! This strategy can

A simple script that closes all current orders.
Terminate once close all positions, so no worries about constantly closing your order.
How to use :
Drag the script from the navigator to the chart, and it will be activated.
Do remember to enable algo trading to use this script.
There are different version of the script that can choose whether to close all buy/sell posiitons, if you need this, do contact me in MQL5.

Gobbo è un indicatore professionale che evidenzia il trend del mercato con un aspetto grafico chiaro e comprensibile, è basato sulla Moving Average e può essere impostato su qualsiasi periodo di intervallo, di default impostato sul periodo 14, scegliendo un periodo più alto evidenzierà meno cambi di tendenza per un approccio sul medio o lungo periodo, con un periodo più basso più cambi di tendenza per un approccio sul breve termine L'aggiornamento e l'adattamento al time frame scelto avviene in
The hedge fund EA Consist of two versions.
version 1.0
- this version trades boom pairs. boom1000,boom500 and boom300 only. dont attempt plugging any other instrument/pair with this version
version 2.0
- this version trades crash pairs. crash1000,crash500 and crash300 only. dont attempt plugging any other instrument/pair with this version.
how the robot works .
- on boom markets. after every strong bullish spike/aggressive move. we have certain conditions/strategy for selling af

Introducing our cutting-edge product, an innovative MACD Oscillator with a dynamic level enhanced by a decimal point Moving Average (MA) also with the versatility of multiple moving average modes. This advanced trading tool brings precision and flexibility to your technical analysis, offering a seamless experience for traders seeking a competitive edge in the financial markets.
Key Features: Dynamic Level Precision Our MACD Oscillator is equipped with a dynamic level feature, providing traders

Exclusive Limited Time Offer! Grab this useful indicator for a lifetime at just $49. Volatility indicator dashboard designed to revolutionize how traders perceive and navigate market volatility. Track volatile for multiple currency pairs one at time for multiple timeframes. Works best with Forex Market, Gold, Silver, Oil. Available in MT4, MT5. Indicator Features: Multi-Symbol, Multi-Timeframe Dashboard: Gain a strategic advantage by simultaneously monitoring volatility across various currenc
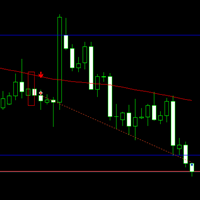
The Expert Advisor uses an SMA and Engulfing Candlestick Pattern as a signal and opens positions when the price closes above or below a moving average and the candlestick pattern engulfing has been previously identified. It then uses a simple grid strategy if the position turns into a loss. Grid levels can be defined specific to the market. User can set "positive Swap Only"-Mode to reduce trading costs for positions that may need to be held for a longer period of time.
A news filter and filter

GIVE A LOOK TO MY OTHER PRODUCTS ! 100 % PER MONTH PROFIT---- MY NEW SIGNAL HERE -------> https://www.mql5.com/en/signals/2162238?source=Site+Signals+My# Smoothed MA cross alert,is a cool indicator that notificate you directly on your telephone or email when 2 Smoothed Moving average ( you choose the parameters ) crosses. This is very important when you want to know a change of trend and you can't stay in front of your pc! The indicator give you the alert just when the next bar opens ,so give

TitanIchimoku The Expert Advisor has been developed for USDJPY H1 based on Ichimoku, MACD, Daily High/Low and pending orders. It has been backtested on over 20-year tick data with 99% quality of modelling. The screenshots attached feature the robustness test by Monte Carlo analysis with 1000 simulations. A broker with a small spread and slippage is recommended for better performance. No need to set up any parameters, these settings are optimized. Check my other products. They work well in combin
The MetaTrader Market is the best place to sell trading robots and technical indicators.
You only need to develop an application for the MetaTrader platform with an attractive design and a good description. We will explain you how to publish your product on the Market to offer it to millions of MetaTrader users.
You are missing trading opportunities:
- Free trading apps
- Over 8,000 signals for copying
- Economic news for exploring financial markets
Registration
Log in
If you do not have an account, please register
Allow the use of cookies to log in to the MQL5.com website.
Please enable the necessary setting in your browser, otherwise you will not be able to log in.