@page { size: 21cm 29.7cm; margin: 2cm } p { margin-bottom: 0.25cm; direction: ltr; color: #000000; line-height: 115%; text-align: left; orphans: 2; widows: 2; background: transparent } p.western { font-family: "Liberation Serif", serif; font-size: 12pt; so-language: en-GB } p.cjk { font-family: "NSimSun"; font-size: 12pt; so-language: zh-CN } p.ctl { font-family: "Arial"; font-size: 12pt; so-language: hi-IN }
ACR DASHBOARD INDICATOR
Hi,
I am here requesting, humbly, from you talented coders of the mql5 community, a multi-symbols and multi-timeframes dashboard indicator:
the ACR dashboard indicator.
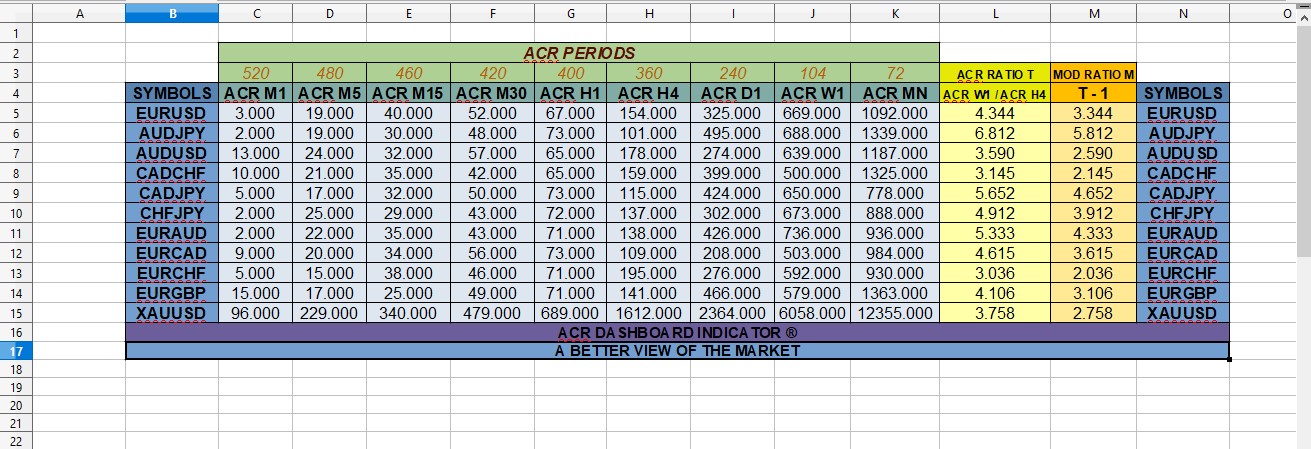
Please find attached below an excel snapshot as an illustration of what I am soliciting.
As you will see from the excel picture, the dashboard is to be populated by the ACRs of each timeframe (9 timeframes: m1, m5, m15, m30, H1, H4, D1, W1, MN) for a maximum of 9 selected symbols or assets.
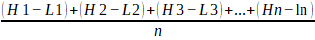
The ACR stands for AVERAGE CANDLE RANGE. The formula is as follow:
@page { size: 21cm 29.7cm; margin: 2cm } p { margin-bottom: 0.25cm; direction: ltr; color: #000000; line-height: 115%; text-align: left; orphans: 2; widows: 2; background: transparent } p.western { font-family: "Liberation Serif", serif; font-size: 12pt; so-language: en-GB } p.cjk { font-family: "NSimSun"; font-size: 12pt; so-language: zh-CN } p.ctl { font-family: "Arial"; font-size: 12pt; so-language: hi-IN }
-with n being the period of calculation
-with (H1 – L1) being the highlow range or size of the first previous candle.
This simply means that the current period candle range is not to be included in the ACR calculation.
So the user will be able to select up to 09 symbols at a time.
And the indicator will display, for each of the symbols, the ACR of each of the 09 timeframes, each timeframe ACR having its own period n.
There will then be for each symbol, 09 columns: ACRm1, ACRm5, ACRm15, ACRm30, ACRH1, ACRH4, ACRD1, ACRW1 and ACRMN.
To these 9 columns, are added 2 extra columns: ACR RATIO T and MOD RATIO M.
The ACR RATIO T is simply the division of the ACR of a higher timeframe HTF to an ACR of a timeframe lower LTF.
With LTF>=m1
HTF<=MN
HTF>LTF
The user should then see an alarm, not as an error notification, but just a recommendation if the chosen LTF>=HTF: ‘Please you should select a LTF lower than HTF’
The MOD RATIO M is simply: M = T – 1
One important feature about either one of these 2 last columns, is the sorting of the symbols in descending order.
If we consider the excel file, we are talking about sorting the array of data from row 5 to row 15 and column B to column N, by descending order of either T or M.
And to avoid visual confusion in finding which asset has a corresponding T, I have opted to add an additional symbols column close to the T and M columns.
Enough of the description. Let’s head to the inputs.
So the inputs come as setting entries for the symbols, the different ACR periods n, the higher and lower timeframes for the ACR ratio T. They also come as basic aesthetics which have been divided to reflect the organisation of the dashboard.
Symbols……………………………………………………….
Symbols (with space not comma) up to 9: EURUSD GBPUSD USDJPY DE30 USDCAD USDCHF EURGBP GBPJPY XAUUSD
………………………………………………………………...
………………………………………….……………………..
ACR PERIODS n……………………………………………..
n m1: 520
n m5: 480
n m15: 460
n m30: 420
n H1: 400
n H4: 360
n D1: 240
n W1: 104
n MN: 72
………………………………………………………………...
………………………………………………………………...
ACR RATIO T………………………………………………...
HTF higher timeframe: W1
LTF lower timeframe: H4
DESCENDING ORDER SORING: true
………………………………………………………………...………………………………………………………………...
COLOURS AND FONTS…………………………………….
………………………………………………………………...
acr periods header and n: yellowgreen
acr periods header italic font: indianred
n values italic font: darkorange
………………………………………………………………
symbols header: steelblue
symbols header font: black
symbols: lightskyblue
symbols font: black
………………………………………………………………
acr TF: teal
acr TF font: black
………………………………………………………………
acr values: lightcyan
acr values font: black
………………………………………………………………
T header: khaki
T header font: black
T values: lemonchiffon
T values font: black
………………………………………………………………
M header: sandybrown
M header font: black
M values: peachpuff
M values font: black
………………………………………………………………
footer title: plum
footer title font: black
footer personal message: lightskyblue
footer personal message font: black
………………………………………………………………
Personal message 90 characters max: A BETTER VIEW OF THE MARKET
Thanks a lot for reading through.
Similar orders
I have an EA that need some changes including integrating the indicator code directly into the Expert Advisor. I will give the detailed doc once we settle on the candidate for the job . Please bid if you can work with the stated amount. Thanks
Hello, Need to convert Tradingview Indicator to MQL4 indicator. or if you have this one converted already, let me buy a copy please. If we're good, then will definitely buy it and ask to convert into EA on new order. Supertrend by KivancOzbilgic
Fix bug or modify an existing Trading view indicator to display correct. The indicator is working but not displaying/plotting all the information i want. So i want it adjusted to plot all the info
Here's a brief requirement you can use: **Description:** I am seeking an experienced MQL5 developer to create a (EA). The EA should include features for placing pending orders (Buy Stop and Sell Stop) based on market spread, managing trades effectively at the opening of new candlesticks, and implementing take profit and stop loss strategies. Additionally, I would like the option to adjust parameters based on market
I have an EA which i need to do below modifications. Variable Inputs to be added Order Type : Market , Pending Trade Type : Buy, Sell , Buy & Sell Pending Pips Step : ( Pips Value can be negative or positive to decide on what type of Pending Order ) // If trade type Buy is selected Close Type : Close All ( Bulk Close Option in MT5 ) , Close Individually Close Option : %of Equity , %of Balance , Amount $ , %of No
Add multiplier to grid recovery system. For example: Grid Trade 2-3 Spacing; 1.0 Multiplier Grid Trade 4-6 Spacing; 2.0 Multiplier Grid Trade 7+ Spacing; 1.6 Multiplier Need quick turn around. Need it done ASAP
Hi I have an indicator that create objects in the chart and using those following some rules the new indicator will create external global variables with value = 0 ( NONE ), = 1 ( BUY ) or = 2 ( SELL ). The global variable will use PIN external integer number . PINS are by now global variables (GV) whose name indicates the pair name and the PIN belonging and their value indicates it direction/action. PINS GV names
I want an indicator and its source code that returns the value of: - two moving averages in different selectable timeframes, with method Exponential and price calculation price_open; - Opening, closing, maximum and minimum of the candle in different timeframes And that returns the values regardless in a chart of one minute. The input parameters: * select timeframe media1 = {1,2,3,4,5,...} * select timeframe media2
Hello, I want offline Renko chart based on pips and time. Trading View Renko chart is a perfect example of what I require, it prints renko bricks at close of time frame chosen which is more cleaner. The Trading View Renko chart wait until end of desired timeframe candle to close before final renko bricks are drawn. Best is to look at Trading View renko charts to see exactly how this works. I currently have an
A simple candle pattern indicator is required that makes a sound alert and draws an arrow when two consecutive bars have the same high or the same low. If two highs, the second bar is a down close and the bar immediately preceding the two highs is a lower high. Vis versa for 2 lows. The second bar is an up close and the bar immediately preceding the two lows is a higher low. Please see attached images for