What should the price glass be like? - page 7
You are missing trading opportunities:
- Free trading apps
- Over 8,000 signals for copying
- Economic news for exploring financial markets
Registration
Log in
You agree to website policy and terms of use
If you do not have an account, please register
Make it so that your glass appears from the mt5 glass, and then another one, and then a bottle. Also, make the flowers around it look nice.
))))) Exactly!
1. Between levels with volumes of 50-200p(4 digits for currencies) respectively the volume around the level is of interest, its width is set or automatically determined by the glass, the glass itself finds these levels. We have a five-digit level, so 200p (4-digit for currencies) is 2000 lines - all 2000 lines are not necessary for review. Actual levels 2-3i with volume grading, the closest graphical representation is the tpo indicator(displayed on the chart, https://www.mql5.com/ru/code/15445 ,https://www.mql5.com/ru/code/15440), something in this idea in the second video. Even the xforex volume indicator shows something yes +/- and allows you to drink coffee when it seems like time (no need to be rude) bricks:
2. Attached video as an example.
3. https://www.mql5.com/ru/code/25414
Please do not engage in flubbing. You are the moderator. Don't forget.
I am moderating. Or do you want to keep everything people write off-topic and below the belt? You, please don't forget - I'm the one who's moderating. I can give up this thankless task.
I moderate it. Or do you want to keep everything people write off-topic and with "below the belt" language? You, please do not forget - I moderate. I can give up this thankless task.
For moderation I am grateful. For flooding, no. You're not doing me any favours, after all, it's your voluntary function.
No offense. That's what flooding is. Why are we discussing this?
That's the way it's always been here.
Just get to the point.
What should the price glass be like?
Well, of course 3D
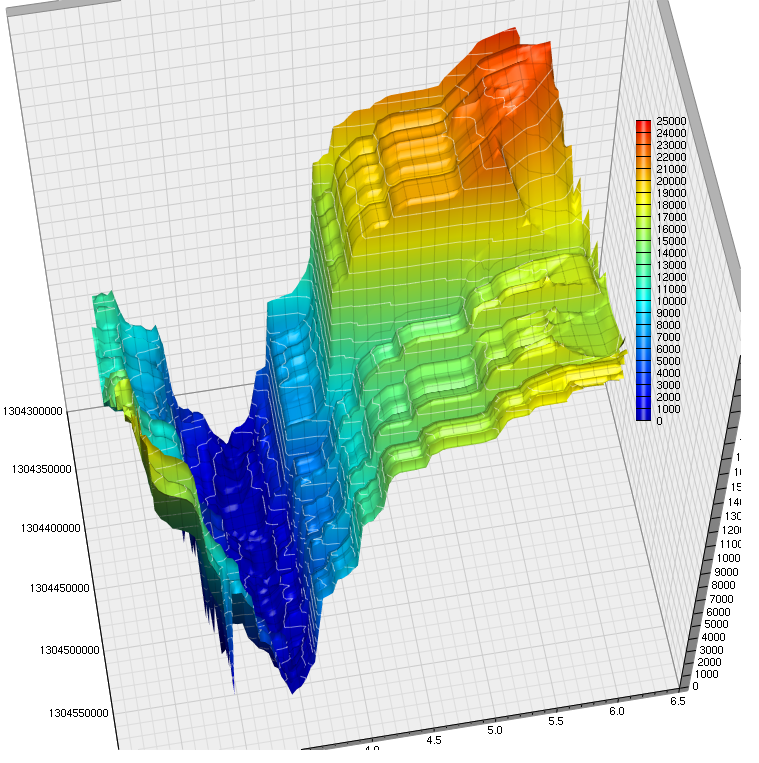
By the way, in the picture you can see the real time stack of bitcoins for about 3 days since May 2, 2011 (on the left side there is a scale with large numbers 1304300000...1304550000 - it is time in seconds since 01.01.1970, on the bottom there is a price scale, on the right - volumes with cumulative totals)Of course it's 3D
By the way, in the picture you can see the real bitcoin stack for about 3 days since May 2, 2011 (on the left is the scale with large numbers 1304300000..1304550000 - this is time in seconds from 01.01.1970, below is the price scale, on the right - volumes with cumulative total)Apparently you can get Qscalp from Quick