Indicator not refreshing values - EMA Predictive
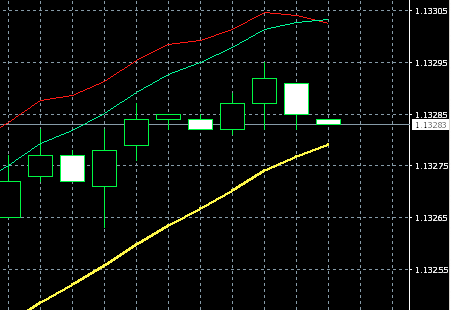
If I hit refresh on the chart, this is how it looks.
//limit=Bars-counted_bars;
limit=1000;
It happens because the initial values of ma1 and ma3 are updated every time.
It happens because the initial values of ma1 and ma3 are updated every time.
"limit" means the loop count of "for-loop" (ie, the number of bars used for calculation).
if(counted_bars>0) counted_bars--;
   limit=Bars-counted_bars;
In the original program, the "limit" is (limit = Bars) at startup because (counted_bars == 0).
But since (limit = Bars - counted_bars), limit is 1 or 0 after the second time.
Therefore, in the following line, ma1 and ma3 are updated every time, it affects the result.
ma1 = Close[limit-1];
ma3 = ma1;
Actually, it is correct to set (limit = Bars - 1), but (limit = 1000) is all right because load is increased.
"limit" means the loop count of "for-loop" (ie, the number of bars used for calculation).
In the original program, the "limit" is (limit = Bars) at startup because (counted_bars == 0).
But since (limit = Bars - counted_bars), limit is 1 or 0 after the second time.
Therefore, in the following line, ma1 and ma3 are updated every time, it affects the result.
Actually, it is correct to set (limit = Bars - 1), but (limit = 1000) is all right because load is increased.
- Free trading apps
- Over 8,000 signals for copying
- Economic news for exploring financial markets
You agree to website policy and terms of use
Hey guys!
I found an indicator online EMAPredictive3 by Matthew "Dr Chaos" Kennel.
The only problem with it is that it doesn't really update. I have to click refresh after every tick, otherwise it will look overlapped (as in the picture attached).
I really tried to do something with RefreshRates() as somebody in another topic suggested, w/o luck.
Can anyone point me in the right direction or even fix it? I would highly appreciate it!!!