How to read the "Optimization Graph" to filter out the overfitting?
Hi all,
One can do the optimization in MT4. This is good. But one has to pay attention to not having the Overfitting. I wonder how to filter out the overfittung result according to the "Optimization Graph"?
And, the "Optimization Graph" has 2D feature. Fro mdark green to light green. What do these mean?
The usual approach is parameters tuning on 60% of the available time data range, then confirmation of the best sets on the remaining interval.
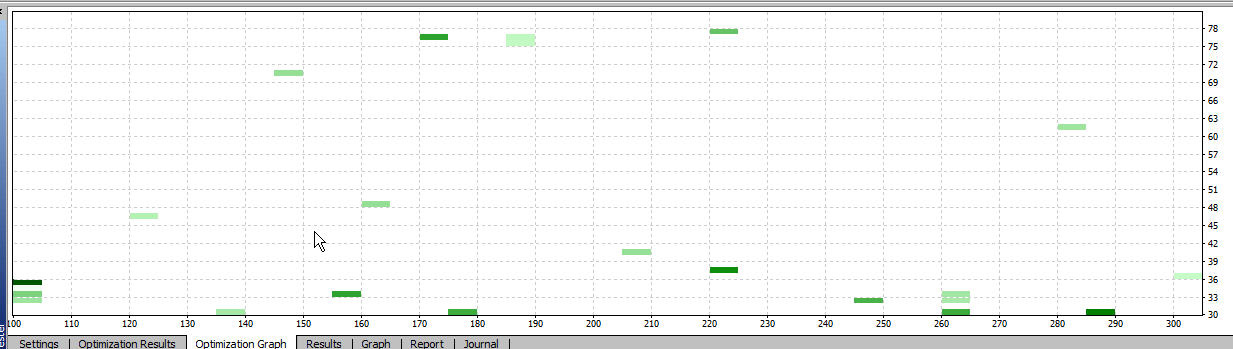
The 2D map is a visual confirmation about randomness of your result - if the green areas are scattered, then the system is weak, and if they are clustered, then it is robust.
The usual approach is parameters tuning on 60% of the available time data range, then confirmation of the best sets on the remaining interval.
The 2D map is a visual confirmation about randomness of your result - if the green areas are scattered, then the system is weak, and if they are clustered, then it is robust.
Bei 2D means I can use at most two parameters to do the optimation, right? If I have more than 2 parameters, maybe I have to many times optimization as this post tells?
https://www.mql5.com/en/articles/1434
My "Optimization Graph 2D" looks as follow. Does this mean my system is very weak?

- 2007.08.23
- Shashev Sergei
- www.mql5.com
- Free trading apps
- Over 8,000 signals for copying
- Economic news for exploring financial markets
You agree to website policy and terms of use
Hi all,
One can do the optimization in MT4. This is good. But one has to pay attention to not having the Overfitting. I wonder how to filter out the overfittung result according to the "Optimization Graph"?
And, the "Optimization Graph" has 2D feature. Fro mdark green to light green. What do these mean?