Debugging undeleted objects
After executing a program, it reported a few undeleted objects of certain type.
How to find out where are these undeleted objects?
Is there a way to access the calling function stack?
I am thinking a solution to store the calling stack at the object constructor so that I can track the various instances that are not destroyed and pinpoint where were they created.
The calling function stack looks like this:
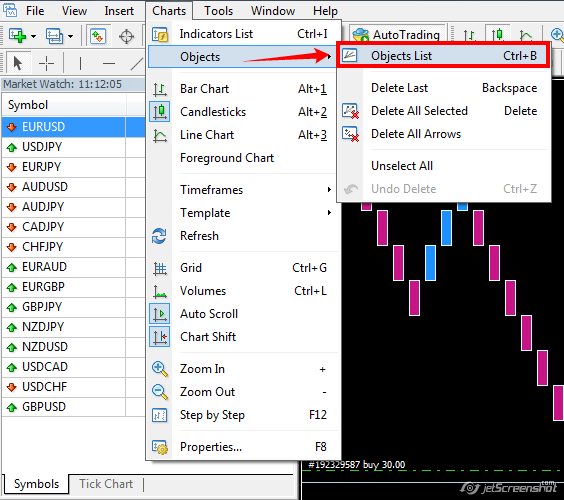
To see what objects are in use, you can access the objects window.
This should be the same for both MT4 & MT5.
There are also a number of Object functions you may find helpful.
For MT4: https://docs.mql4.com/objects
For MT5: https://www.mql5.com/en/docs/objects
Useful information.
To delete a specific object: https://www.mql5.com/en/docs/objects/objectdelete
To delete multiple objects: https://www.mql5.com/en/docs/objects/objectdeleteall
- Jack

- docs.mql4.com
To see what objects are in use, you can access the objects window.
This should be the same for both MT4 & MT5.
There are also a number of Object functions you may find helpful.
For MT4: https://docs.mql4.com/objects
For MT5: https://www.mql5.com/en/docs/objects
Useful information.
To delete a specific object: https://www.mql5.com/en/docs/objects/objectdelete
To delete multiple objects: https://www.mql5.com/en/docs/objects/objectdeleteall
- Jack
Sorry I was referring to class objects not graphic objects.
I appears that your question has already been answered here:
https://www.mql5.com/en/forum/2122
https://www.mql5.com/en/forum/2122
2122 was replied in 2010.9.24 on trapping the out-of-bound array index during debug mode and that the caller stack info is not stored in release compilation for safety reason.
Wonder after so many years if MQL4 has added features that allow access to caller stack so that I can add codes in the constructor to register the caller stack and track which caller is not releasing the object.
I understand the safety issue, but by just showing number of undeleted objects of certain class is not sufficient to trace the erroneous source, I need which caller is not releasing the object and this information can be displayed during debug mode to avoid the safety issue in release compilation?
- Free trading apps
- Over 8,000 signals for copying
- Economic news for exploring financial markets
You agree to website policy and terms of use
After executing a program, it reported a few undeleted objects of certain type.
How to find out where are these undeleted objects?
Is there a way to access the calling function stack?
I am thinking a solution to store the calling stack at the object constructor so that I can track the various instances that are not destroyed and pinpoint where were they created.
The calling function stack looks like this: