Forecast and levels for EURO - page 18
You are missing trading opportunities:
- Free trading apps
- Over 8,000 signals for copying
- Economic news for exploring financial markets
Registration
Log in
You agree to website policy and terms of use
If you do not have an account, please register
Forum on trading, automated trading systems and testing trading strategies
Press review
Sergey Golubev, 2017.12.02 11:13
Weekly EUR/USD Outlook: 2017, December 03 - December 10 (based on the article)
EUR/USD struggled to continue advancing as the dollar found its footing. The upcoming week features a constant stream of data including PMIs, industrial output and more. Here is an outlook for the highlights of this week.
Forum on trading, automated trading systems and testing trading strategies
Press review
Sergey Golubev, 2017.12.03 08:58
EUR/USD - long-term rally to the bullish reversal; 1.2091 is the long-term resistance for bullish (based on the article)
Price on the monthly chart is near and below Ichimoku cloud for the trying to be reversed to the primary bullish market condition. Chinkou Span line broke historical price to above for the secondary rally within the bearish trend, and the price is testing resistance level at 1.2091 to above to be reversed to the primary bullish market condition.
==========
The chart was made on MN1 timeframe with standard indicators of Metatrader 4 except the following indicators (free to download):
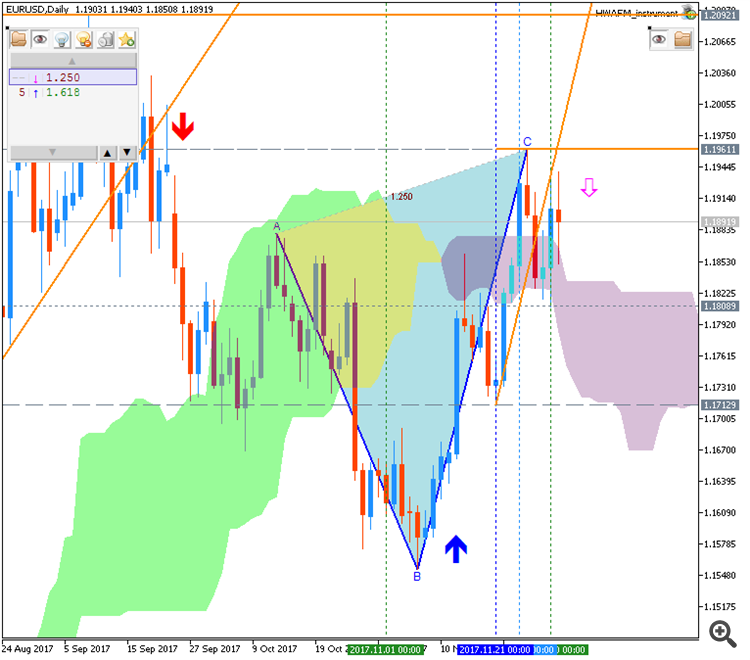
Before New Year there are 25 days left. That is 4 weeks, that is, only 4 week candles:
December 8 will be NonFarm. Dec. 13 will be a decision on the interest rate for the USD, and Dec. 14 - the interest rate on EUR. It seems to me (this is in my subjective sensations), in these days nothing serious will happen. Therefore, most likely by the New Year EURUSD will remain between 1.16 and 1.20. Waveformers will tell you that they are expecting the completion of the fifth wave (see graph). But it is not known when this completion will occur. I think this will be the end after the New Year.
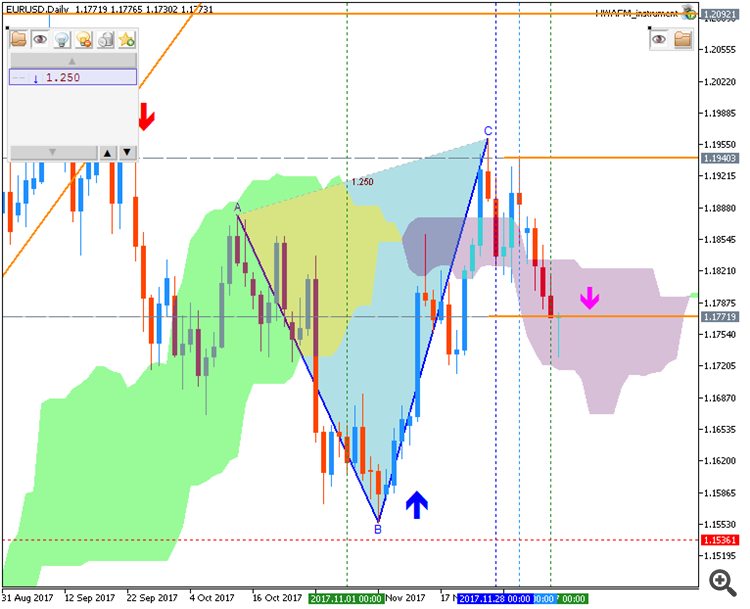
are you opening any trades in EURUSD currently?
Forum on trading, automated trading systems and testing trading strategies
Press review
Sergey Golubev, 2017.12.08 11:34
Trading News Events: U.S. Non-Farm Payrolls (based on article)
The U.S. Non-Farm Payrolls (NFP) report by fuel the near-term decline in EUR/USD as employment is projected to increase another 195K in November, while Average Hourly Earnings are expected to climb an annualized 2.7% during the same period.
What’s Expected:
Why Is This Event Important:
A further improvement in labor market dynamics accompanied by signs of stronger wage growth may heighten the appeal of the greenback as it encourages the Federal Open Market Committee (FOMC) to further normalize monetary policy in 2018, and the dollar may exhibit a more bullish behavior over the remainder of the year should the central bank stay on its current course of delivering three rate-hikes per year.
However, another series of lackluster data prints may encourage the FOMC to adopt a more cautious tone at its last interest rate decision on December 13, and the greenback may face a more bearish fate if the fresh developments drag on interest-rate expectations.
How To Trade This Event Risk
- EUR/USD stands at risk for a larger pullback as it snaps the monthly opening range, with the pair carving a fresh series of lower highs & lows following the failed attempt to break above the 1.1960 (38.2% retracement) hurdle.
- The Relative Strength Index (RSI) highlights a similar dynamic as it fails to preserve the bullish formation carried over from November, with a break below the 50-Day SMA (1.1758) raising the risk for a move back towards 1.1670 (50% retracement).
- Next downside region of interest comes in around 1.1580 (100% expansion), which sits above the November-low (1.1554), followed by the Fibonacci overlap around 1.1480 (78.6% expansion) to 1.1500 (78.6% expansion).
Potential Price Targets For The ReleaseEURUSD Daily
============
The chart was made on D1 timeframe with Ichimoku market condition setup (MT5) from this post (free to download for indicators and template) as well as the following indicators from CodeBase:
============
Forum on trading, automated trading systems and testing trading strategies
Press review
Sergey Golubev, 2017.12.10 08:08
Weekly EUR/USD Outlook: 2017, December 10 - December 17 (based on the article)
EUR/USD failed to hold onto higher ground in a mixed week. The ECB meeting is clearly the big event of the upcoming week, but not the only topics on the agenda. Here is an outlook for the highlights of this week.
Forum on trading, automated trading systems and testing trading strategies
Press review
Sergey Golubev, 2017.12.11 10:53
EUR/USD - daily ranging inside Ichimoku cloud for direction (based on the article)
Daily price is located inside Ichimoku cloud for the ranging within the following s/r levels:
1.1865 resistance for the bullish trend to be resumed with 1.1961 level as a daily bullish target, and
1.1709 support level located in the beginning of the bearish rreversal to be started with 1.1650/1.1554 daily bearish targets
============
The chart was made on D1 timeframe with Ichimoku market condition setup (MT5) from this post (free to download for indicators and template) as well as the following indicators from CodeBase:
Forum on trading, automated trading systems and testing trading strategies
Press review
Sergey Golubev, 2017.12.11 15:23
EUR into ECB with Credit Agricole: "We remain long EUR/USD" (based on the article)
==========
2017-12-14 12:45 GMT | [EUR - Minimum Bid Rate]
if actual > forecast (or previous one) = good for currency (for EUR in our case)
[EUR - Minimum Bid Rate] = Interest rate on the main refinancing operations that provide the bulk of liquidity to the banking system.
==========
Weekly price is on bullish breakout: the price broke Ichimoku cloud to above to be reversed to the primary bullish market condition. For now, the price is on ranging within 1.1554/1.1961 support/resistance level for for secondary correction to be started or for the bullish trend to be resumed.
==========
Chart was made on MT5 with Brainwashing system/AscTrend system (MT5) from this thread (free to download) together with following indicators:
Same system for MT4:
Forum on trading, automated trading systems and testing trading strategies
Press review
Sergey Golubev, 2017.12.12 09:45
EUR/USD - ranging within 55 SMA/200 SMA; 1.1961 is the key (based on the article)
Intra-day price on H4 chart is located within 55 SMA/200 SMA ranging area waiting for the direction of the strong trend to be started.
If the price breaks high for the last monthly bar at 1.1961 so the bullish trend will be resumed, otherwise - ranging within the levels.
==========
The chart was made on H4 timeframe with standard indicators of Metatrader 4 except the following indicator (free to download):
Today, December 13, 2017 at 10:00 on London there will be a meeting of the Fed, where, according to forecasts, will decide to raise the interest rate by a quarter of a point. This should push EURUSD up:
It just coincides with the technical fifth wave of Elliott. I think so. But life, as you know, presents surprises.