Coding help - page 66
You are missing trading opportunities:
- Free trading apps
- Over 8,000 signals for copying
- Economic news for exploring financial markets
Registration
Log in
You agree to website policy and terms of use
If you do not have an account, please register
dasio
If you can attach a picture it would be much better
Hi,
i'm trying to draw multiple rectangle checking the last n candle.
The point have a simple rule.
Attached there is an example.
The big rectangle without background define the rule ( check price included from point 1 to poin 2 using moving everage).
The point for draw the rectangle is the high and low of the bar with high highest of the range.
How i can code it?
Thank you for your reply.
sorry,
i can't attach an image now. However let assume to have two Moving Average .Point 1 is the cross of the fast MA with slow MA upward and point 2 is the cross of fast MA with slow MA downward.dasio If you can attach a picture it would be much better
Hi,
Thank you for your interest.
Attached there is an example image. And belowe the rules. I think that that bars are very important.
For check the rules we need standard deviation indicator an a MA applied on it.
How you can see in the attached image we have to find when the MA cross Upward the SD and after it cross downward (in the image it is rappresent by rectangle on separate windows).
Once we have defined this range we must find the high value of the SD between the range.
So we must draw a rectangle from High/Low of the bars corresponding to the high value of SD value defined.
I must draw all the rectangle for all the point found of the n bars back.
If you see the image i only need the rectangle in the chart. All the other line and rectangle in the Example musn't be draw.
I try to it alone but i couldn't draw more than last.
Thank you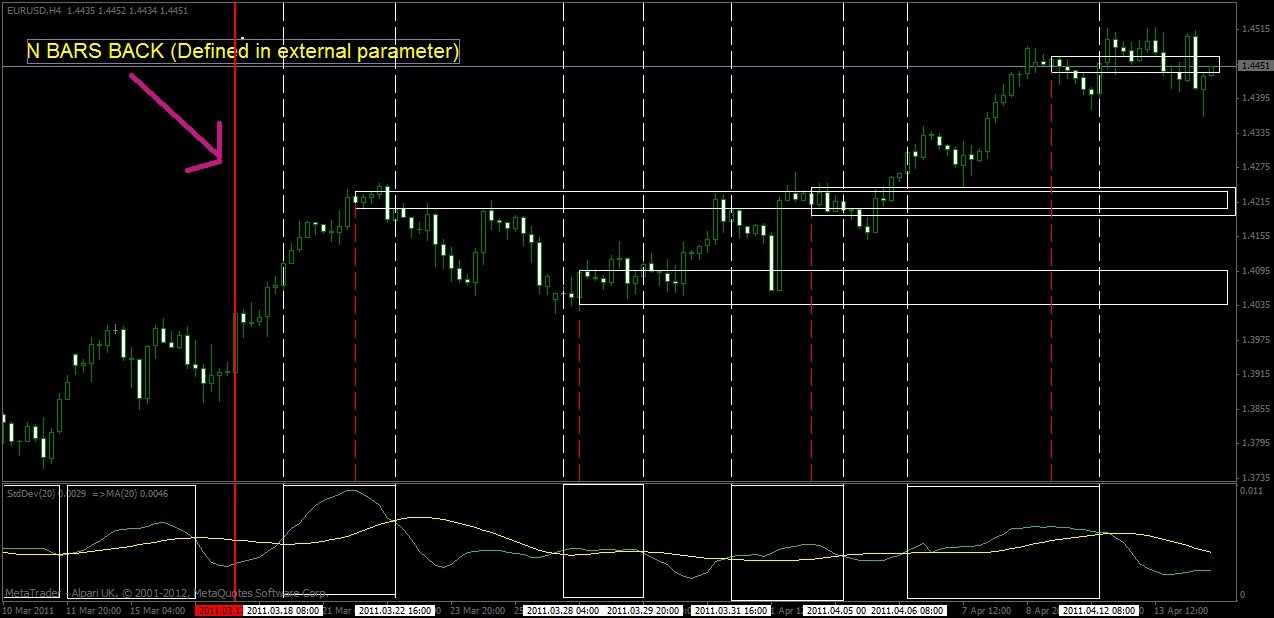
dasio,
Made it this way (you can easily extract the code you need from it - so you can leave out the part that is drawing the standard deviation and it's average in the separate window). It does what you explained. You might alter the the ending (rightmost point - right now it is the current bar, I did not add any extension of that part into the future)
have a pleasant weekend
Hi,
Thank you for your interest.
Attached there is an example image. And belowe the rules. I think that that bars are very important.
For check the rules we need standard deviation indicator an a MA applied on it.
How you can see in the attached image we have to find when the MA cross Upward the SD and after it cross downward (in the image it is rappresent by rectangle on separate windows).
Once we have defined this range we must find the high value of the SD between the range.
So we must draw a rectangle from High/Low of the bars corresponding to the high value of SD value defined.
I must draw all the rectangle for all the point found of the n bars back.
If you see the image i only need the rectangle in the chart. All the other line and rectangle in the Example musn't be draw.
I try to it alone but i couldn't draw more than last.
Thank youLittle help plz
I am slowly learning MQ4 but I am blocked and need a hand plz. I am trying to add extra lines of different lengths and can't figure how. Here is a picture of what I would like it to look like.
You sir, are one of a kind. Thank you Mladen!
loumanchew
try it out nowI am slowly learning MQ4 but I am blocked and need a hand plz. I am trying to add extra lines of different lengths and can't figure how. Here is a picture of what I would like it to look like.
Pls convert this indi into Histo Version
Mrtools is it possible to convert this indicators to histo version and mtf if possible
asctrend1i.mq4trend_signal.mq4
Thanks in advance
Mrtools is it possible to convert this indicators to histo version and mtf if possible
asctrend1i.mq4trend_signal.mq4
Thanks in advanceHi Macerina,
First thing i need to explain is Trend Signal is actually a fixed version of the Asctrend you posted, if on Trend Signal if you set levelOb at 67 and levelOs at 33 and risk = 6 you will be having a Asctrend the Trend Signal is just a little more flexible with the settings and a little more faster sometimes, so knowing that just did the Trend Signal as mtf histo with alerts.
Hi Macerina, First thing i need to explain is Trend Signal is actually a fixed version of the Asctrend you posted, if on Trend Signal if you set levelOb at 67 and levelOs at 33 and risk = 6 you will be having a Asctrend the Trend Signal is just a little more flexible with the settings and a little more faster sometimes, so knowing that just did the Trend Signal as mtf histo with alerts.
mrtools Thank you so much for the info and coding its very helpful to know both are the same and their settings.
Mrtools i tried using the settings u have mentioned in but there are a few places its missing the way asctrend1i turns can u pls let me know the exact syncronisation settings or if it cannot be exact it would be better if asctrend1i can be converted to histo version ... sorry for troubling you on this thanks for your help.