is it possible to create an EA locate this Support & Resistance
Hi Coders
I like to create an EA with my system but wondering if it is possible to make an EA recognize this type of S& R and plot horizontal lines at those points.
The real question is whether or not you can devise a rule or logic to plot such a support/resistance line. Drawing by eye is easy.
Once you can think up a rule for it then the coding is usually pretty easy. It is not immediately obvious to me what such a rule would consist of, but then again I haven't thought about it for more than the time it has taken me to write this post.
You could implement your custom indicator of upper and lower "fractals" using close and open instead of high and low. It's fairly easy.
Thanks for your ideas Guys
Sure, take your favorite SR indicator and change High/Low with Open/Close
Sure, take your favorite SR indicator and change High/Low with Open/Close
The real question is whether or not you can devise a rule or logic to plot such a support/resistance line. Drawing by eye is easy.
Once you can think up a rule for it then the coding is usually pretty easy. It is not immediately obvious to me what such a rule would consist of, but then again I haven't thought about it for more than the time it has taken me to write this post.
Truly draw by eye is easy make up a rule for it a bit harder.Thanks
- Free trading apps
- Over 8,000 signals for copying
- Economic news for exploring financial markets
You agree to website policy and terms of use
Hi Coders
I like to create an EA with my system but wondering if it is possible to make an EA recognize this type of S& R and plot horizontal lines at those points.
Supports and Resistances are normally drawn by the Wick. Instead I like to draw S& R by the Open & Close Price. Please see picture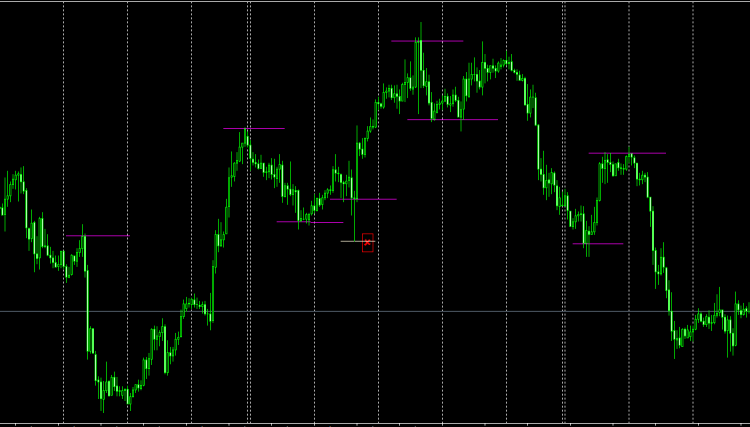
Thank you