Indicators: RoundPriceAlert
Often called "psych" levels, psychological levels occur when price ends with multiple 0's. It's human nature to gravitate towards round numbers when discussing any topic that involves numbers, Forex included.
For example, when traders talk about what they think the Euro will be worth in the future, they probably won't give an answer of 1.4278 or 1.3044. They are much more likely to round off the price to something simpler, like 1.4300 or 1.3000. The same thing happens when Forex traders place their orders. We will often see clusters of orders around these whole numbers, which creates price levels that can affect how price behaves. That's exactly what we want for our support and resistance levels.
The most common psych levels involve price having two zeros at the end (not including the 1/10th of a pip), such as 1.6400 or 102.00. More powerful than that would be psych levels ending in three zeros, such as 1.3000 or 120.00. Leaving the most powerful psych levels of all, four zeros at the end, 1.0000 or 100.00.

- Rob Pasche
- www.dailyfx.com
The Three Most Popular Indicators for Day-Trading
- Price action is an extremely common tool for day-traders’ (scalpers) risk management approaches.
- Moving averages and psychological support and resistance can assist with entry and trade management.
Price Action
The first indicator is more than an indicator, and closer to a
‘field-of-study’ within technical analysis. Because trading on
short-term time frames exposes traders to the complexity of ‘lag’ within
a market, price action is one of the more popular ways of performing
technical analysis with a short-term approach.
The reason this is so popular is because price action removes
technical indicators from the equation and instead focuses on price and
price alone. Price action can be used to grade trends, identify support
and resistance levels, and to show traders potential entry opportunities
in markets.
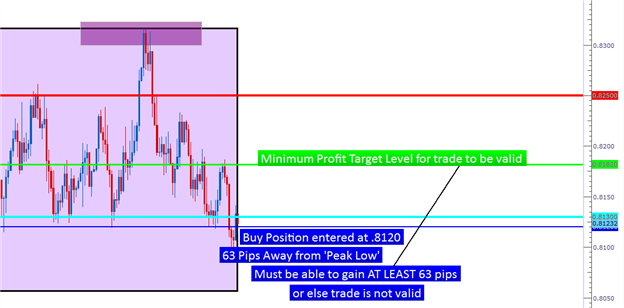
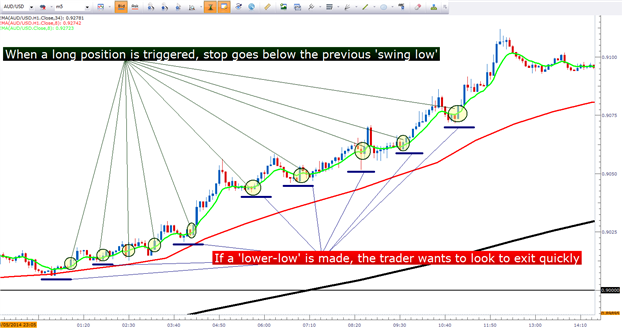
Where price action can come in as especially valuable for a short-term trader is in the realm of trade and risk and trade management. By noting price levels with which reversals or changes in market direction have taken place in the past, traders can look to place stops on positions so that if the market breaks against them (if a new low is put in while in a long position, or a new high while in a short position), the trade can be closed in an effort to mitigate the loss.
If the market does trend in the direction that you’re looking for, price
action can also help with adjusting stops and profit-taking.
Short-term traders will often look to execute a quick break-even stop to
remove their initial risk from the trade. And after prices do continue
to move, traders can look at moving the stop even deeper in-the-money as
the trade works in the trader’s favor.
Moving Averages
Another indicator that’s simple to use and attempts to marginalize the
lag that is ever-present with the usage of indicators, the moving
average is a common chart component of short-term traders.
Moving averages are commonly used for trend diagnoses, so that if
prices are above the moving average the trend is diagnosed as being
‘up,’ and if prices are below the trend is considered being ‘down.’ This
can work phenomenally with a multiple time frame approach in which
trends are being graded on a longer-term chart (like the hourly or
4-hour), and entries performed on the shorter-term chart.
Traders can also use moving averages to trigger into new positions. The moving average crossover is one of the more common ways of doing so and with this method; traders are simply looking for price to cross the moving average to initiate the position.
Support and Resistance via Psychological Whole Numbers, and Pivot Points
Have you ever been in a trade that’s working out great, only to see
that up-trend stop dead-in-its-tracks? And after price struggles to
continue moving up, it begins to oscillate before reversing and moving
down.
This is the story of support and resistance, and to short-term traders
this can take on extreme importance because failure to see ‘the bigger
picture’ can lead to confusion and losses on the shorter-term charts.
There are numerous ways to identify support and resistance, and
traders can use price action to validate any particular level; but this
really only comes into play after-the-fact. Of particular interest to
short-term traders are ‘psychological whole numbers.’
Psychological whole numbers are simply even, rounded values on the
chart. As an example 1.3900, 1.3800 and 1.3700 are ‘round’ whole numbers
in EURUSD, as each of these prices end in ’00.’ But we can take this a
step further with the values mid-way between these three levels, 1.3850
and 1.3750 are also ‘rounded whole numbers.’
Take a look at the most recent move in EURUSD in the chart below, and notice how even in a strong-trending market the level of 1.3850 offered temporary support as the pair could not break through. Eight hours later that momentum came back in the market as the level finally yielded to selling, only to see 1.3750 come in as support shortly thereafter.
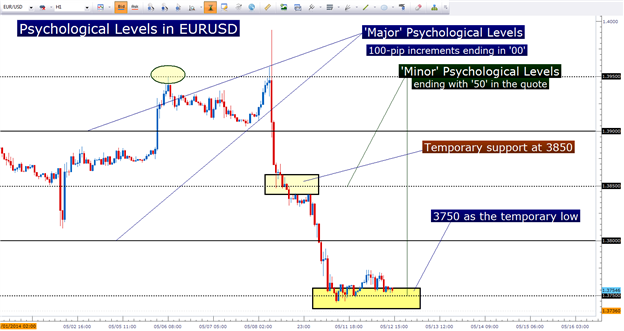
At this point, the pair has still failed to break below 1.3750 as
support has come into the market after the most current 200+ pip run to
the down-side.
Will every price ending in ‘50’ or ‘00’ elicit support or resistance?
No. But short-term traders need to remain cognizant of the potential for
support and resistance to develop at these values as trends move into
new territory.
If a trend appears as though it may have run into a brick wall of
support or resistance, traders can use this opportunity to scale out of a
position, adjust stops, and or plan re-entries after prices finish
retracing and continue moving in the trend-side direction.
- Free trading apps
- Over 8,000 signals for copying
- Economic news for exploring financial markets
You agree to website policy and terms of use
RoundPriceAlert:
The indicator that gives signals in round value of price
Fig.1 The alert using the RoundPriceAlert indicator
Author: Nikolay Kositsin