
Forex and Cryptocurrency Forecast for September 02 – 06 2024


EUR/USD: Dollar Takes the Offensive
● Since the beginning of July, the DXY dollar index had been declining, reaching an eight-month low of 100.51 on 27 August. The primary reason for this negative trend was the concern about a potential slowdown in the U.S. economy. According to the markets, to support the economy, the Federal Reserve (Fed) was expected to begin easing its monetary policy (QE) and aggressively cutting interest rates. As early as July, several members of the Federal Open Market Committee (FOMC) were ready to vote for a rate cut. However, they refrained from doing so, deciding to wait until September to make a decision based on more up-to-date macroeconomic indicators. A 25 basis points (bps) rate cut at the FOMC meeting on 18 September is almost universally anticipated. Moreover, the likelihood of a 50 bps cut reached 35% last week. The futures market also estimated that the total reduction in the cost of dollar borrowing by the end of the year would amount to 95-100 bps. As a result, such actions by the U.S. central bank were expected to lead to a sharp increase in risk appetite and exert additional pressure on safe-haven assets, including the U.S. currency.
In light of forecasts for a U.S. economic slowdown, market participants began discussing a reduction in divergence with the Eurozone and the UK. Consequently, the euro and pound became the main beneficiaries, as clearly reflected in the EUR/USD and GBP/USD charts. However, as the ancient wisdom goes, all good things must come to an end. Life, like the stripes of a zebra, alternates between good and bad times. Thus, after a period of gains, the euro and pound have now entered a darker phase. (Although, to be honest, it’s not entirely dark, just somewhat grey).
● It turns out that things are not so bad in the U.S. After all. According to preliminary data released on Thursday, 29 August, the country's GDP grew by 3.0% in Q2, surpassing both the forecast of 2.8% and the previous figure of 1.4%. On the same day, labour market statistics showed that the number of initial jobless claims in the United States remained virtually unchanged, standing at 231K compared to the forecast of 232K and the previous figure of 233K. Additionally, the Core Personal Consumption Expenditures (Core PCE) Price Index, a key inflation indicator, remained steady in August at 2.6% year-over-year, in line with the July figure and slightly below the forecast of 2.7%.
● From all the figures mentioned above, it is clear that fears of an economic slowdown and a cooling U.S. labour market are greatly exaggerated. It is also premature to declare a final victory over inflation, just as it is too early to assume that the Fed will cut interest rates by 100 basis points by the end of the year. As Raphael Bostic, President of the Federal Reserve Bank of Atlanta, wisely pointed out, it would be undesirable to find ourselves in a situation where, after easing monetary policy, we need to tighten it again. As another saying goes, "haste makes waste."
The idea that there is no need to rush is further supported by the replacement of the elderly Joe Biden with Kamala Harris in the presidential race. For the first time since April of last year, the Wall Street Journal's polls show the Democratic candidate's rating, albeit slightly, surpassing that of Republican Donald Trump. Therefore, forecasts of a U.S. economic recession should also be postponed for the time being. In this context, Citigroup economists believe that September will be a period when the potential outcome of the presidential election could become a source of significant volatility. However, regardless of how candidate ratings fluctuate, this factor of uncertainty will continue to support the dollar as a safe-haven currency.
● All the above suggests that the markets may be significantly overestimating the speed and scale of QE from the Federal Reserve. On the other hand, they may be underestimating the European Central Bank's (ECB) resolve to take similar actions.
It is worth recalling that on 6 June, the pan-European regulator cut the interest rate by 25 basis points to 4.25%. Many assumed that after this move, the ECB would pause and observe the Fed's actions (where the rate stands at 5.5%). However, it is possible that such expectations are misguided. The weakness of the German economy and other Eurozone countries should push the ECB towards more active steps in the direction of QE. (Macroeconomic data released on Tuesday, 27 August, showed a decline in Germany's GDP by -0.1% quarter-on-quarter, compared to +0.2% in Q1). Inflation is also falling sharply: Germany's Consumer Price Index (CPI), according to preliminary data, decreased from +0.3% to -0.1% month-on-month. The same trend is evident across the Eurozone as a whole: according to data published on Friday, 30 August, the CPI here dropped year-on-year from 2.6% to 2.2%. This is very close to the target level of 2.0%. Therefore, it is quite possible that at its meeting on 12 September, the ECB, when choosing between fighting inflation and supporting the economy, may opt for the latter and cut the rate by another 25 basis points.
● It appears that market participants have taken our arguments into account. At least, after surging to 1.1201, the EUR/USD pair returned to its 19 August levels by the end of the week, finishing the five-day period at 1.1047. (The GBP/USD pair demonstrated similar dynamics, where this reversal could also mark the first step in a trend shift from north to south).
The median forecast for EUR/USD in the near term is as follows: 75% of analysts are in favour of further dollar strengthening and a decline in the pair, while 25% expect it to rise. In technical analysis on D1, 25% of oscillators are coloured red, 35% green, and the remaining 40% are neutral grey. Among trend indicators, 35% have sided with the reds, while 65% voted for the greens. The nearest support for the pair is located in the zones of 1.0985-1.1015, 1.0880-1.0910, 1.0780-1.0825, 1.0725, 1.0665-1.0680, and 1.0600-1.0620. Resistance zones are found in the areas of 1.1090-1.1105, 1.1170-1.1200, followed by 1.1230-1.1275, 1.1350, and 1.1480-1.1505.
● The upcoming week promises to be quite eventful, interesting, and volatile. Starting from Tuesday, 3 September, through Thursday, 5 September, data on business activity (PMI) across various sectors of the U.S. economy will be released. Additionally, on 4, 5, and 6 September, we can expect a wave of U.S. labour market statistics, including key indicators such as the unemployment rate and the number of new non-farm jobs created (NFP). As for the Eurozone, Thursday, 5 September, will be noteworthy for retail sales data in the region. And at the very end of the workweek, on 6 September, the Eurozone GDP volume will be announced. Moreover, traders should keep in mind that Monday, 2 September, is a holiday in the U.S. as the country observes Labour Day.

CRYPTOCURRENCIES: The Fed, a Cup Handle, and the Banana Season of Madness
● Inflation is one of the key indicators influencing the monetary policy and interest rate decisions of the U.S. Federal Reserve. These, in turn, are among the primary factors determining the attractiveness of cryptocurrencies for investors. A recent example of this was the dovish speech by the head of the U.S. Central Bank, Jerome Powell, at the Annual Economic Symposium in Jackson Hole, USA, on 23 August. Powell did not rule out a series of interest rate cuts for the remainder of the year. The market reacted to this with a plunge in the DXY Dollar Index to 100.60 and a nearly 7% surge in the BTC/USD pair, from $60,800 to $65,000.
However, the rally did not continue. The eight-day period of net inflows into spot BTC ETFs, during which they attracted over $756 million, ended on Tuesday, 27 August. On that single day, more than $127 million flowed out of cryptocurrency funds. As a result, the BTC/USD pair plummeted and found support only in the $58,000 zone. Naturally, the leading cryptocurrency dragged the altcoin market down with it.
● According to analysts at QCP Capital, the trigger for the market crash was the uncertainty among participants regarding the future of the leading cryptocurrency. As a result, traders were quick to lock in profits. In this situation, while the market sentiment remains bullish, QCP Capital believes that a rapid rise in BTC prices should not be expected for now. Signals of renewed interest in BTC from large institutional investors are necessary to resume active growth. Michael van de Poppe, the head and founder of MN Trading, also believes that bitcoin has not yet fully escaped the "range of lows" between $61,000 and $62,000. In his view, a decisive breakout from this range is essential to confirm a rally toward BTC's all-time high.
Analysts at Glassnode agree with their colleagues. They believe that in the short term, BTC is unlikely to surpass the $70,000 mark. However, according to their observations, "both on-chain indicators and perpetual contracts show that the period of equilibrium is coming to an end, with the beginning of increased volatility and trading volume," which could allow the asset to break out of its narrow price corridor.
● Samson Mow, a bitcoin maximalist and a well-known figure in the crypto industry, has raised concerns by drastically reducing his BTC price forecast by a factor of ten. Just recently, in July, Mow declared that the leading cryptocurrency would reach $1 million within a year. However, in a new comment, he stated that "as long as bitcoin's price remains below $0.1 million, the coins are being sold at a discount." This comment has led the crypto community to believe that he may have lost faith in a powerful bull rally. The $0.1 million mark refers to $100,000, which means that anything below this figure is considered a discounted price, and $100,000 is what Mow now sees as the fair value of bitcoin. (For reference, Samson Mow is a crypto investor, entrepreneur, blogger, and television host. He was the CEO of the blockchain company Pixelmatic and the Chief Strategy Officer at Blockstream. He is currently the CEO of JAN3 and Pixelmatic.)
Another influencer, Anthony Scaramucci, CEO of SkyBridge Capital, shares a similar view on the "fair" value of bitcoin. He continues to uphold his forecast that digital gold will rise to $100,000, driven by spot BTC-ETFs. However, he has now cautioned that reaching this target may be delayed from the end of 2024 to 2025 due to regulatory uncertainty and the increasing prevalence of crypto fraud. "I could be wrong about the timing, but not the actual outcome. I genuinely believe that bitcoin will reach $100,000; it just might take longer," he wrote.
● Renowned macroeconomist Henrik Zeberg is convinced that a recession in the United States is inevitable, potentially arriving as early as Q4 of this year. Moreover, he believes it will be the worst since the Great Depression of 1929. According to Zeberg, the upcoming bear market will unfold in two stages: a deflationary phase followed by stagflation, with an intermediate rebound as the Fed intervenes in 2025. After this, there will be a "blow-off top," where prices skyrocket to unsustainable levels before plummeting rapidly.
Alongside this forecast, Zeberg has revised his target figures for stock indices and bitcoin upwards. According to his BlowOffTop business cycle model, the price of the leading cryptocurrency should rise to $115,000-$120,000 by the end of 2024. However, the economist cautions that this surge will be short-lived.
Arthur Hayes, former CEO of the crypto exchange BitMEX, also weighed in, suggesting that a reduction in Federal Reserve interest rates might temporarily diminish the appeal of traditional financial instruments, causing speculative investors to focus more closely on cryptocurrencies. However, Hayes warns that this rate reduction "will have only a short-term effect, much like sugar provides a quick burst of energy." He believes that assets like bitcoin are likely to benefit from the increased liquidity in financial markets, but overall, the Fed's decision could further exacerbate inflationary pressures.
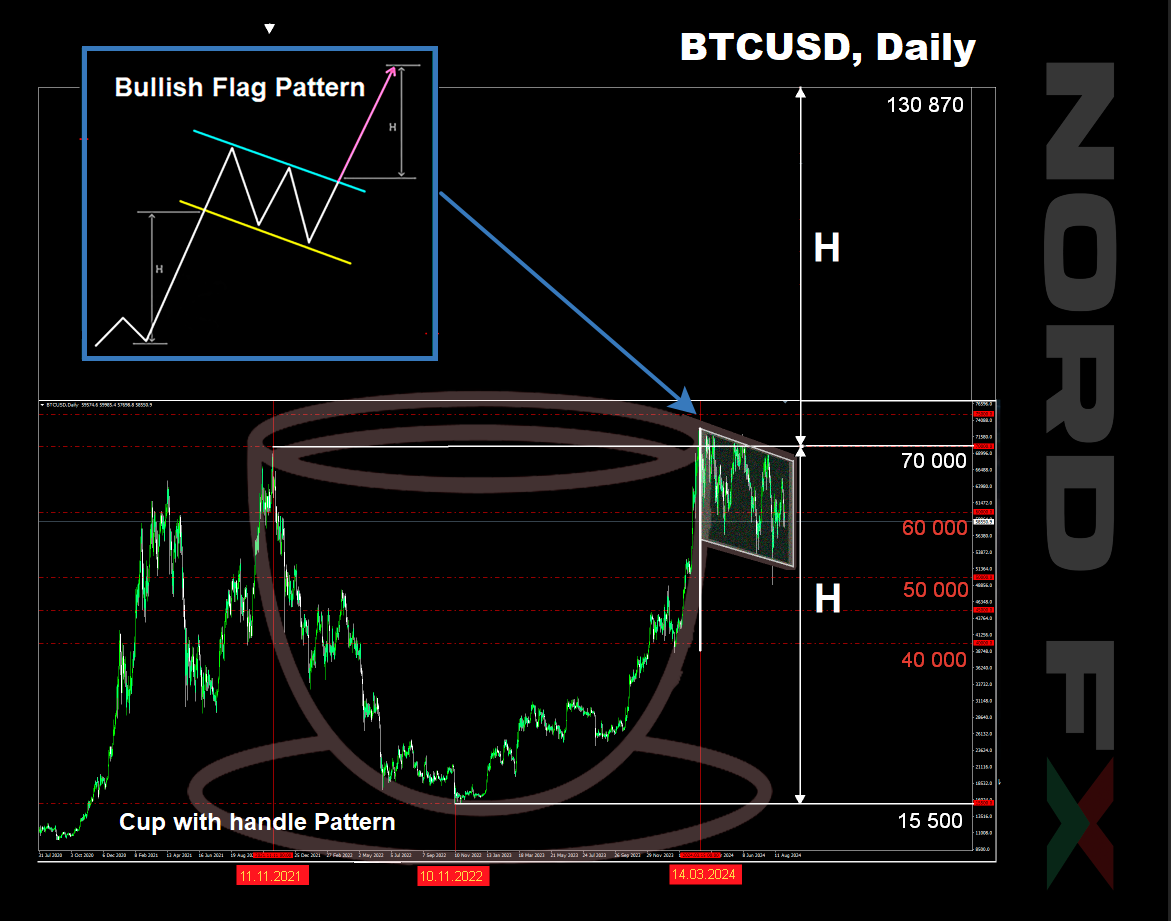
● Shifting from fundamental to technical analysis, the forecast by the analyst known as MetaShackle is noteworthy. He suggests that bitcoin's continued consolidation within an increasingly narrow price range makes its breakout inevitable. On a larger scale, this range acts as the "handle" of a 3-year "cup." "BTC is forming a massive 'Cup and Handle' on the daily/weekly chart. Such a formation has never been seen before in the history of cryptocurrencies, and it will surely lead to an incredible run to levels that will shock the world," writes MetaShackle.
The "Cup and Handle" pattern is a bullish chart formation in trading. It typically consists of a rounded bottom (the cup), followed by a slight downward drift (the handle), indicating a potential upward breakout. The "largest cup and handle in cryptocurrency history," as described by MetaShackle, begins with bitcoin's peak in November 2021 at $69,000. This was followed by a bear market that consolidated over the next two years, forming a cup with a bottom at $15,500. The opposite rim of the "cup" is marked by a new all-time high in March 2024 at $73,800. After this, the "cup" formation was completed, and the "handle" phase began. This next phase has been ongoing for six months, consolidating with a slight downward trend.
Traders use this model to determine price targets by measuring the depth of the "cup" and projecting that distance upwards from the breakout point of the "handle." According to MetaShackle's calculations, BTC could rise from the bottom by 761% and soar to $130,870.
Another well-known analyst, Gert van Lagen, also believes that the chart shows bitcoin transitioning from a downtrend to an uptrend. Bitcoin is currently moving around the "handle," he notes, "on the verge of entering the banana zone," signifying a period when BTC and altcoins experience explosive price growth. Previously, Real Vision's Jamie Coutts stated that the leading cryptocurrency is about to "enter a season of madness." According to Coutts, by the end of the year, bitcoin's price could exceed $150,000.
Two weeks ago, we mentioned another analyst, Rekt Capital, who predicted a surge in the first cryptocurrency's value in October. His forecast was based on a different pattern forming on the BTC/USD chart: a "bull flag," where the breakout height equals the height of the flagpole.
● At the time of writing this review, on the evening of Friday, 30 August, the BTC/USD pair is trading around the $59,100 zone. The total market capitalization of the crypto market stands at $2.07 trillion, down from $2.24 trillion a week ago. The Crypto Fear & Greed Index has risen from 27 to 34 points, but it remains in the Fear zone.
● And finally, some encouraging statistics. According to consulting firm Henley and Partners, the number of bitcoin millionaires (those holding more than $1 million in BTC) has increased by 111% since January 2024, reaching 85,400 individuals. If we consider not only the holders of the flagship asset but crypto millionaires in general, the number is even higher: 172,300 people. This represents a 95% increase compared to a year ago when the figure was 88,200. The number of individuals with digital assets worth $100 million or more has grown by 79% to 325 people. Six new members have joined the ranks of crypto billionaires, bringing the total to 28.
NordFX Analytical Group
Disclaimer: These materials are not an investment recommendation or a guide for working on financial markets and are for informational purposes only. Trading on financial markets is risky and can lead to a complete loss of deposited funds.
#eurusd #gbpusd #usdjpy #forex #forex_forecast #nordfx #cryptocurrencies #bitcoin


